galaxies: abundances — galaxies: dwarf — galaxies: evolution — galaxies: individual (HSC J1631+4426) — galaxies: ISM
Subaru/FOCAS IFU revealed the metallicity gradient of a local extremely metal-poor galaxy
Abstract
We present the first measurement of the metallicity gradient in extremely metal-poor galaxies (EMPGs). With Subaru/Faint Object Camera And Spectrograph (FOCAS) Integral Field Unit (IFU), we have observed a nearby, low-mass EMPG, HSC J1631+4426, whose oxygen abundance and stellar mass are known to be 12+log(O/H) and , respectively. The measured metallicity gradient is dex kpc-1 corresponding to dex R for the continuum effective radius of kpc. Our observation has successfully demonstrated that three-dimensional spectroscopy with 8m-class telescopes is powerful enough to reveal the metallicity distribution in local EMPGs, providing precious information of the baryon cycle in local analogs of primordial galaxies in the early Universe.
1 Introduction
Metallicity of galaxies are the key to unveiling their formation and evolution processes (e.g., [Pagel (1997)]). Metallicity gradient, expressed in dex kpc-1 or dex , where is the effective radius, is one of the important diagnostics for evaluating gaseous flows in the interstellar medium (ISM) and its mixing processes (e.g., [Sharda et al. (2021)]). Observations have demonstrated that normal disk galaxies in the local Universe and dwarf galaxies in Local Group have negative metallicity gradient (e.g., [Belfiore et al. (2017)] and references therein). In the “inside-out” galaxy growth scenario in which the star formation begins at the central part of the galaxy and propagates to the outer region, the metallicity gradient is negative and steep in the early stage and flattens as the galaxy grows in size and mass ([Wang et al. (2019)] and references therein). On the other hand, there are also several galaxies that have positive metallicity gradient both in local and distant Universe (e.g., [Wang et al. (2019), Belfiore et al. (2017), Cresci et al. (2010)]). The positive gradient observed in high- galaxies indicates the gas accretion to their central part in the “cold mode”, with the accretion of pristine gas from the cosmic web ([Sánchez Almeida et al. (2013)]). Since these studies commonly target on galaxies with 12+log(O/H) , metallicity gradients in metal-poor galaxies are observationally hitherto unknown.
In this Paper, we report a negative metallicity gradient in a local extremely metal-poor galaxy (EMPG), HSC J16314426, whose metallicity fall on this unexplored range. EMPGs are defined as galaxies with their oxygen abundance lower than 12+log(O/H) = 7.69, which is equivalent to 10% solar metallicity ([Sánchez Almeida et al. (2015)], [Kojima et al. (2020)], [Isobe et al. (2021)]). They are believed to be the dominant population in the early Universe. Local EMPGs are of great importance as analogs of high- galaxies which are difficult to observe directly. More than 90% of EMPGs have diffuse structures in their immediate vicinity (Isobe et al., 2021). Preceding studies suggest that EMPGs are star-forming regions in such diffuse host galaxies whose metallicities are higher than the metal-poor parts, indicating positive metallicity gradients when considered their whole structures (Sánchez Almeida et al. (2013), Sánchez Almeida et al. (2016), Olmo-García et al. (2017)). Our result suggests possible diversity of metallicity gradients in EMPGs.
The rest of this Paper is organized as follows. In section 2, observational information and the data reduction process are presented. In Section 3, we explain the method of flux measurement and gas-phase oxygen abundance (i.e., metallicity)111For the sake of simplicity, we refer hereafter to gas-phase oxygen abundance (i.e., not in the stellar atmosphere) as metallicity.) calculation. Section 4 describes the measurement of metallicity gradient and discusses its relation with the central metallicity and stellar mass. Throughout this Paper, a standard CDM cosmology with parameters of is adopted. This cosmology gives a scale of 0.629 kpc per arcsec at . Solar metallicity is defined by (Asplund et al., 2009).
2 Observation and data reduction
Our target, HSC J1631+4426, is identified to be the most metal-poor galaxy with a 1.6% solar metallicity (i.e., 12+log(O/H) = 6.90; Kojima et al. (2020)). HSC J1631+4426 is a local dwarf galaxy at redshift , which has been discovered in a metal-poor galaxy survey program named Extremely Metal-Poor Representatives Explored by the Subaru Survey (EMPRESS; Kojima et al. (2020)). Its stellar mass is and effective radius is measured as pc using the Subaru Hyper Suprime-Cam (HSC) i-band surface brightness profile (Isobe et al., 2021). To reveal the metallicity distribution of the galaxy, we utilize Faint Object Camera And Spectrograph (FOCAS: Kashikawa et al. (2002)) Integral Field Unit (IFU: Ozaki et al. (2020)) mounted on Subaru Telescope. We carried out integral field spectroscopy for the target galaxy, HSC J1631+4426 (RA=16h31m1424, DEC=44∘26′0443), on 2020 March 6 with FOCAS IFU (PI: S. Fujimoto). We obtained a single 1200-second exposure using the 300B grism and the SY47 filter with the wavelength coverage of 4700–7600 Å and the spectral resolution of . An O-type subdwarf, HZ44 (RA=13h23m35263, DEC=36∘07′5955) was also observed as a standard star. During the observation, atmospheric condition was good with the seeing size varying between and .
To reduce the target and the standard star data, we used the FOCAS IFU pipline software222https://www2.nao.ac.jp/~shinobuozaki/focasifu/. A detailed explanation of the reduction flow is given in Ozaki et al. (2020). The size of spatial pixel (called spaxel) and spectral pixel of the final data cube are and 1.34 Å, respectively. The total field of view is .
3 Analysis
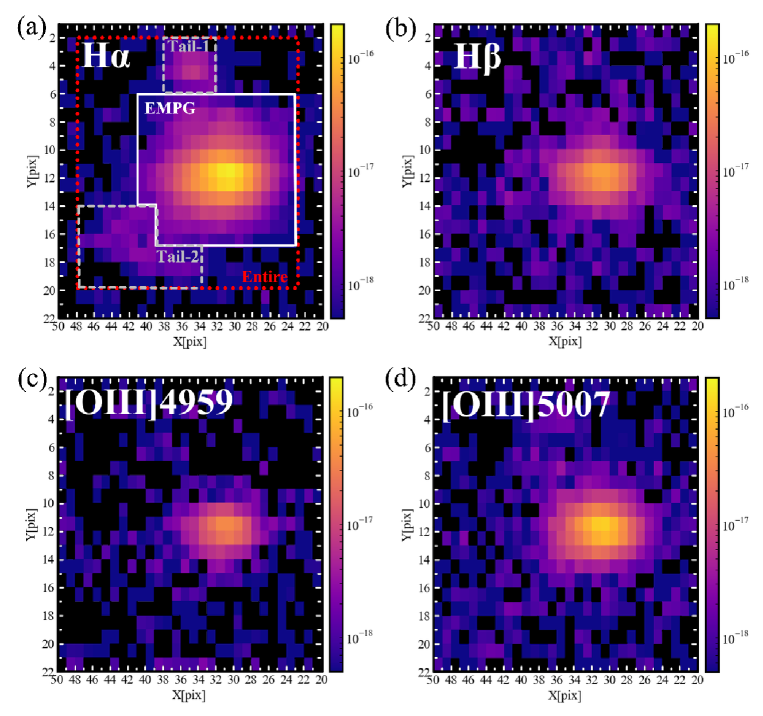
We visually identified four emission lines (H, H, [O \emissiontypeIII]4959, and [O \emissiontypeIII]5007) in our data cube. The velocity Full Widths at the Half Maximum (FWHMs) of the lines are km s-1 (i.e., 5–6 spectral pixels). They are about the velocity resolution: the lines are unresolved. We integrated the data cube over twice of the FWHM for each line to create the velocity-integrated line intensity map.
For each velocity-integration, we subtracted continuum (or sky-residual in spaxels without the object). The continuum (or sky-residual) level in each spaxel was obtained by integrating the spectra in the wavelength around the emission line over the same number of spectral pixels as that in the line map. The wavelength range was carefully chosen in order not to include any emission lines.
Figure 1 shows the results.
As shown in Figure 1 (a) H map, we defined four regions: the Entire region, the EMPG region, the Tail-1 region, and the Tail-2 region. The latter two regions correspond to the diffuse structures found in the continuum image (Isobe et al., 2021). We measured the total line fluxes for each region by summing up the intensity within the region of each line intensity map. As flux errors, we used RMS per spaxel calculated from the spaxels outside of the Entire region and scaled it by the square-root of the number of the spatial pixels. We also measured the upper limits of the line fluxes of [N\emissiontypeII]6584, [S\emissiontypeII]6717, and [S\emissiontypeII]6731. We corrected the total fluxes for the dust extinction within the Milky Way by utilizing Galactic Dust Reddening and Extinction Service333https://irsa.ipac.caltech.edu/applications/DUST/ and the Cardelli et al. (1989) extinction curve. Visual extinction by the Milky Way toward the target galaxy is mag. The corrected line fluxes and upper limits are listed in Table 3.
For the dust attenuation in the target galaxy, we estimated the color excess for each region based on the H/H line ratio, the Balmer Decrement, under the assumptions of the Cardelli et al. (1989) extinction curve, the electron temperature K measured by [O\emissiontypeIIII]4363 (Kojima et al., 2020), and the case B approximation (Osterbrock (1989)). The obtained values are listed in Table 3. Since we obtained non-zero only for the Tail-1 region, we applied the internal dust attenuation correction only for that region, assuming the Cardelli et al. (1989) extinction curve.
The gas-phase metallicity, 12+log(O/H) for each region was estimated from the index: (Maiolino & Mannucci, 2019). Since the relation between and 12+log(O/H) is known to be a binary function, there can be high and low 12+log(O/H) branches for a value of . To know the more likely case, we also examined the index: . Although the [N \emissiontypeII]6584 line is not detected in the galaxy, its upper limit can be useful to reject the high 12+log(O/H) solution.
First, we calculated the and indices for each region, using the dust-corrected total line fluxes and upper limits. Next, we used the empirical relation by Curti et al. (2020) calibrated for the index to obtain upper limits of 12+log(O/H). We found that all regions should have 12+log(O/H) – which is consistent with the EMPG nature (Kojima et al., 2020). Curti et al. (2020) also present the calibration, which is limited to 12+log(O/H) , while the target galaxy is an EMPG (Kojima et al., 2020). We then used the theoretical models by Inoue (2011) which cover a very wide range of 12+log(O/H).
The models were calculated by CLOUDY (Ferland et al., 1998) for the cases with gas-phase metallicity ( and ), ionization parameter (), and hydrogen number density (). They also changed the input stellar spectra depending on the metallicity (gas and stellar metallcities were assumed to be the same). Finally, they presented the emission line intensities normalized by H as a function of metallicity, averaging over the 25 different sets of (, ) in each metallicity case. They noted that the standard deviations of the line ratios relative to H are 5–25%. The obtained average line ratios are consistent with observations as shown in their Figure 1 for some strong emission lines including [O \emissiontypeIII] lines. Since the metallicity grid of the line ratios was sparse, we used the following interpolation function:
| (5) |
where = 12+log(O/H). The obtained 12+log(O/H) for each region are summarized in Table 3.
Measurement of emission lines, color excess, and metallicity for the four regions∗*∗*footnotemark: H [O \emissiontypeIII]4959 [O \emissiontypeIII]5007 H [N\emissiontypeII]6584 [S\emissiontypeII]6717 [S\emissiontypeII]6731 12+log(O/H) Entire 953.5 16.7 396.6 15.1 1467.1 13.9 2493.7 11.1 31.6 189.0 1484.9 0.0503 EMPG 867.6 11.2 427.5 10.0 1408.6 9.3 2367.6 7.4 21.1 126.0 990.0 0.0338 Tail-1 15.0 3.9 10.4 21.4 3.3 57.7 2.6 7.4 44.6 350.0 0.349 0.114 Tail-2 27.0 6.4 17.2 20.8 5.3 65.7 4.3 12.0 72.1 567.1 0.789 {tabnote} ∗*∗*footnotemark: Measurement for the total fluxes after the correction for the Milky Way dust attenuation, in the target galaxy, and 12+log(O/H). The observed total flux within each region in units of 10-18 erg cm-2 s-1. Upper limits are given at the 3 level.
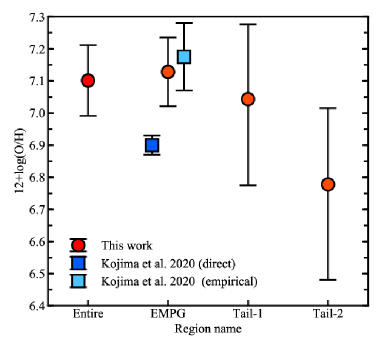
Figure 2 shows our 12+log(O/H) for each region with error-bars, plotted along with those reported by Kojima et al. (2020). We added systematic uncertainty of to the results based on empirical calibrations because such dispersion exists in these calibrations (e.g., Maiolino & Mannucci (2019)). The oxygen abundances for the Entire, EMPG, and Tail-1 regions are consistent with each other within the uncertainty when the systematic errors are considered. The oxygen abundance of the Tail-2 region may be lower than the other three regions although the uncertainty is large.
There is a systematic offset of our 12+log(O/H) values from that obtained by a direct temperature method in Kojima et al. (2020). We could not detect the [O\emissiontypeIII]4363 in our data cube because of the short exposure. It is a future work to apply the direct temperature method to the target galaxy in a spatially resolved way after taking a deeper data set (see also a discussion below).
4 Metallicity gradient measurement
To derive metallicity gradient, we created metallicity map by calculating 12+log(O/H) for each spaxel based on the index as in section 3. Since the H line flux is required in the denominator of the index, we restricted ourselves to the spaxels where the S/N of H is larger than 3, which are confined only in the EMPG region. The line fluxes corrected only for the Milky Way dust extinction were used for the calculation because in the EMPG region is consistent with zero (Table 3).
In this Paper, we present the metallicity gradient purely observationally and do not consider any geometric model to correct for the inclination effect. Since our target galaxy is not edge-on, the projection effect on the distance may not be too large. We assumed the center of the galaxy to be the intensity peak position of the H map and calculated the projected distance of each spaxel from the center. Note that the kinematic center of the H emission is consistent with its intensity peak (Isobe et al. in prep).
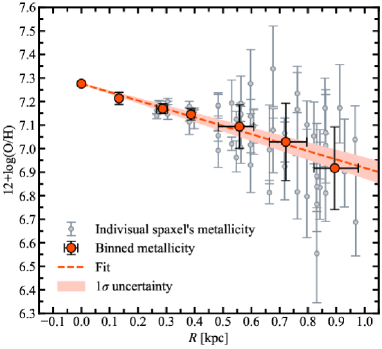
Figure 3 shows the obtained radial profile of the metallicity in the EMPG region.
It is important to consider the beam smearing effect on metallicity gradient measurements (Yuan et al., 2013). Since our metallicity measurements reach a scale twice larger than the seeing size ( kpc), the beam smearing effect would not be large.
We fitted the binned data and their standard deviations with a linear function by a method, varying both the central metallicity and the gradient. We obtained dex kpc-1 as the metallicity gradient as well as the central metallcity of 12+log(O/H) . Note that the observational seeing of does not affect the linear function fit because a linear function is conserved by a Gaussian convolution. We also obtained a consistent gradient value even when we divided the data into two groups (i.e., the inside and the outside of kpc).
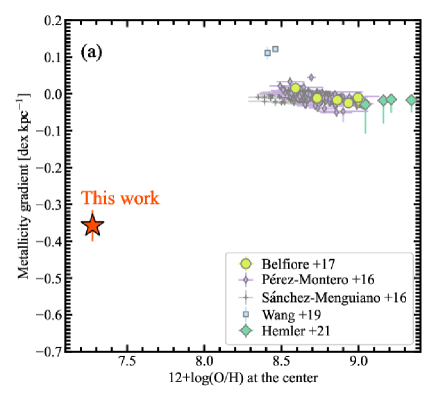
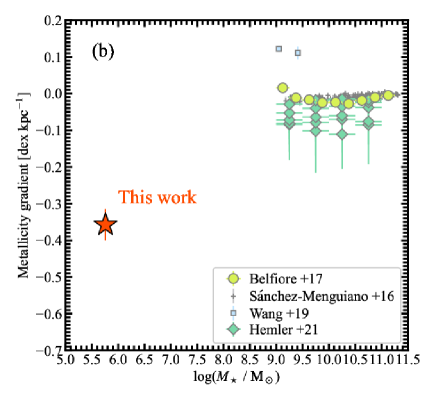
To evaluate the properties of our galaxy, we compare our result with previous studies. Figure 4 shows the metallicity gradient as functions of the central metallicity (a) and the stellar mass (b), respectively. Our work successfully reports the metallicity gradient in a considerably metal-poor, low-mass galaxy with for the first time.
The metallicity gradient of our EMPG in units of dex is considerably steep compared to those almost flat observed in local high-mass galaxies (). This steep gradient can be interpreted by a simple chemical evolution model as follows.
A simple closed-box model approximately gives the time evolution of oxygen abundance as when (Pagel, 1997), where is the stellar yield of oxygen and is the time-scale of star formation. This equation can be reduced to when we adopt (Kojima et al., 2020), (Asplund et al., 2009), (Meynet & Maeder, 2002; Sánchez Almeida et al., 2015), and our metallicity gradient of kpc-1. Therefore, the observed metallicity gradient can be realized quickly compared to the galaxy evolution (i.e., ). On the other hand, the ISM mixing time-scale is with the mixing velocity . The presented data cube of the H line indicates a velocity gradient of km s-1. Assuming to be the same order of that velocity, we find . If Gyr, a metallicity gradient produced by the chemical enrichment can be kept against the ISM mixing. The observed steep negative gradient indicates inside-out star formation in the EMPG and its inefficient ISM mixing due to a slow turbulent velocity induced by a shallow gravitational potential.
On the origin of the metal-poor gas of EMPGs, Sánchez Almeida et al. (2015) suggest that the cold, metal-poor gas infall from the cosmic web dilutes the metallicity of the central part and triggers star formation there. They also report that diffuse structures have dex higher metallicity than the star-forming region of EMPGs. Therefore, the metallicity gradient of their EMPGs seem positive when we consider the whole system including the diffuse structures. Positive metallicity gradients are also observed in some local and high- galaxies (Cresci et al., 2010; Sánchez-Menguiano et al., 2016; Wang et al., 2019). On the other hand, metallicites of the two Tail regions in our galaxy are similar to or lower than the mean of the EMPG region (figure 2) and are likely to be lower than the centeral metallicity of the EMPG region. Although the distances of these regions from the EMPG center are about kpc, out of the range of the current analysis shown in Figure 3, the galaxy we discuss here probably do not have any positive gradient even if we include the Tail regions.
A caveat of the analysis in this Paper is possible radial dependence of the nebular parameters. We have implicitly assumed radial constancy of nebular parameters by using the empirical calibration formula. For example, if the ionization parameter changes radially, the empirical -index method we used may suffer from larger uncertainties caused by missing information of the O+ amount traced by the [O\emissiontypeII]3727 lines. A potential more serious case is that the electron temperature is as high as K, obtained from [O\emissiontypeIII]4363 (Kojima et al., 2020), only in the central part of the EMPG and decreases along the radial distance. This case may lead to a dex lower metallicity (figure 2), only in the central part because the same index gives a lower 12+log(O/H) value for higher temperature. As a result, the gradient would become shallower than that derived here. Examining these points require a shorter wavelength coverage for [O\emissiontypeII]3727 or much deeper data cube for faint [O\emissiontypeIII]4363, which is a future work.
Another caveat is the contribution of diffuse ionized gas (DIG) to the emission lines (Zhang et al., 2017; Sanders et al., 2017, 2021). The half-light radius of H emission is measured at pc from the line map, which is about three times larger than pc of the stellar component measured in the HSC -band image (Isobe et al., 2021). In the image, the galaxy is detected but not resolved, providing no spatial information of the young stellar component. If we assume the -band size to be the size of the young stellar component, it is significantly smaller than the spatial extension of the H emission. A part of H emission may come from DIG. Indeed, the DIG fraction is estimated at based on equation (24) in Sanders et al. (2017) from the mean H surface brightness of erg s-1 kpc-2 in our line map. On the other hand, the metallicity estimated by the index, which we adopted here, may not be affected by the DIG contribution because the indices of HII regions and DIG are similar (Zhang et al., 2017; Sanders et al., 2017). In addition, the DIG correction for the strong line methods for metallicity tends to be small at lower metallicity (Sanders et al., 2021), suggesting the DIG effect on our measurements to be small.
We would like to thank anonymous reviewer for insightful comments that are helpful for us to improve the quality and clarity of the Paper. This work was supported by the joint research program of the Institute for Cosmic Ray Research (ICRR), University of Tokyo. The Cosmic Dawn Center is funded by the Danish National Research Foundation under grant No. 140. Takashi Kojima was supported by JSPS KAKENHI Grant Number 18J12840. We would like to thank the staffs of the Subaru Telescope for their help with the observation. This research has made use of the NASA/IPAC Infrared Science Archive, which is funded by the National Aeronautics and Space Administration and operated by the California Institute of Technology.
References
- Asplund et al. (2009) Asplund, M., Grevesse, N., Sauval, A. J., & Scott, P. 2009, ARA&A, 47
- Belfiore et al. (2017) Belfiore, F., et al. 2017, MNRAS, 469, 1, 151–170
- Cardelli et al. (1989) Cardelli, J. A., Clayton, G. C., & Mathis, J. S. 1989, AJ, 345, 245–256
- Curti et al. (2020) Curti, M., Mannucci, F., Cresci, G., & Maiolino, R. 2020, MNRAS, 491, 1, 944–964
- Cresci et al. (2010) Cresci, G., Mannucci, F., Maiolino, R., Marconi, A., Gnerucci, A., & Magrini, L. 2010, Nature, 467, 7317, 811–813
- Ferland et al. (1998) Ferland, G. J., et al. 1998, PASP, 110, 761
- Hemler et al. (2021) Hemler, Z.S., et al. 2021, MNRAS, 506, 2, 3024–3048
- Inoue (2011) Inoue, A. K. 2011, MNRAS, 415, 2920–2931
- Isobe et al. (2021) Isobe, Y., et al. 2021, ApJ, 918, 54
- Izotov et al. (2019) Izotov, Y. I., Guseva, N. G., Fricke, K. J., & Henkel, C. 2019, A&A, 623, A40
- Jones et al. (2010) Jones, T., Ellis, R., Jullo, E., & Richard, J. 2010, ApJ, 725, 2, L176
- Kashikawa et al. (2002) Kashikawa, N., et al. 2002, PASJ, 54, 6, 819–832
- Kojima et al. (2020) Kojima, T., Ouchi, M., Rauch, M., et al. 2020, ApJ, 898, 142
- Maiolino & Mannucci (2019) Maiolino, R., & Mannucci, F. 2019, 27, 1, 3
- Meynet & Maeder (2002) Meynet, G., & Maeder, A. 2002, A&A, 390, 561
- Olmo-García et al. (2017) Olmo-García, A., Sánchez Almeida, J., Muñoz-Tuñón, C., Filho, M. E., Elmegreen, B. G., Elmegreen, D. M., Pérez-Montero, E., & Méndez-Abreu, J. 2017, ApJ, 834, 2, 181
- Osterbrock (1989) Osterbrock, D. E. 1989, Astrophysics of gaseous nebulae and active galactic nuclei (University Science Books)
- Ozaki et al. (2020) Ozaki, S., et al. 2020, PASJ, 72, 6
- Pagel (1997) Pagel, B. E. J. 1997, Nucleosynthesis and Chemical Evolution of Galaxies (Cambridge, UK: Cambridge University Press)
- Pérez-Montero et al. (2016) Pérez-Montero, E., et al. 2016, A&A, 595, A62
- Sánchez Almeida et al. (2013) Sánchez Almeida, J., Muñoz-Tuñón, C., Elmegreen, D. M., Elmegreen, B. G., & Méndez-Abreu, J. 2013, ApJ, 767, 1, 74
- Sánchez Almeida et al. (2015) Sánchez Almeida J., et al. 2015, ApJ, 810, 2, L15
- Sánchez Almeida et al. (2016) Sánchez Almeida, J., Pérez-Montero, E., Morales-Luis, A. B., Munoz-Tunón, C., García-Benito, R., Nuza, S. E., & Kitaura, F. S. 2016, ApJ, 819, 2, 110
- Sánchez-Menguiano et al. (2016) Sánchez-Menguiano, L., et al. 2016, A&A, 587, A70
- Sanders et al. (2017) Sanders, R., Shapley, A. E., Zhang, K., Yan, R. 2017, ApJ, 850, 136
- Sanders et al. (2021) Sanders, R., et al. 2021, ApJ, 914, 19
- Sharda et al. (2021) Sharda, P., Krumholtz, M. R., Wisnioski, E., Forbes, J. C., Federrath, C., Acharyya, A. 2021, MNRAS, 502, 5935
- Wang et al. (2019) Wang, X., et al. 2019, AJ, 882, 2, 94
- Yuan et al. (2013) Yuan, T.-T., Kewley, L. J., Rich, J. 2013, ApJ, 767, 106
- Zhang et al. (2017) Zhang, K., et al. 2017, MNRAS, 466, 3217