Talk2Data: A Natural Language Interface for
Exploratory Visual Analysis via Question Decomposition
Abstract.
Through a natural language interface (NLI) for exploratory visual analysis, users can directly “ask” analytical questions about the given tabular data. This process greatly improves user experience and lowers the technical barriers of data analysis. Existing techniques focus on generating a visualization from a concrete question. However, complex questions, requiring multiple data queries and visualizations to answer, are frequently asked in data exploration and analysis, which cannot be easily solved with the existing techniques. To address this issue, in this paper, we introduce Talk2Data, a natural language interface for exploratory visual analysis that supports answering complex questions. It leverages an advanced deep-learning model to resolve complex questions into a series of simple questions that could gradually elaborate on the users’ requirements. To present answers, we design a set of annotated and captioned visualizations to represent the answers in a form that supports interpretation and narration. We conducted an ablation study and a controlled user study to evaluate the Talk2Data’s effectiveness and usefulness.
1. Introduction
Exploratory visual analysis is an open-ended process that involves identifying questions of interest and visualizing data-oriented answers iteratively, which is non-trivial for general users while exploring unfamiliar data (Tukey et al., 1977; Wongsuphasawat et al., 2015; Battle and Heer, 2019). Natural Language Interfaces (NLI) provides an accessible approach for exploratory visual analysis, in which users can can ask questions about input data in natural language and the system reveals the corresponding data-related answers in visual forms (Gao et al., 2015; Setlur et al., 2016; Narechania et al., 2020). Recent works in this topic attract great attention in both academics (Sun et al., 2010; Gao et al., 2015; Setlur et al., 2016; Aurisano et al., 2016; Narechania et al., 2020) and industry (pow, [n. d.]; tab, [n. d.]). These NLIs provide a more intuitive communication approach and better user experience for data analysis. Users can directly “tell” the analysis system their needs or “ask” the system for the answers to their questions about the input data. This process greatly lowers the barriers of data analysis, but the quality of the response highly depends on the system’s capability of understanding users’ questions that are presented in natural language.
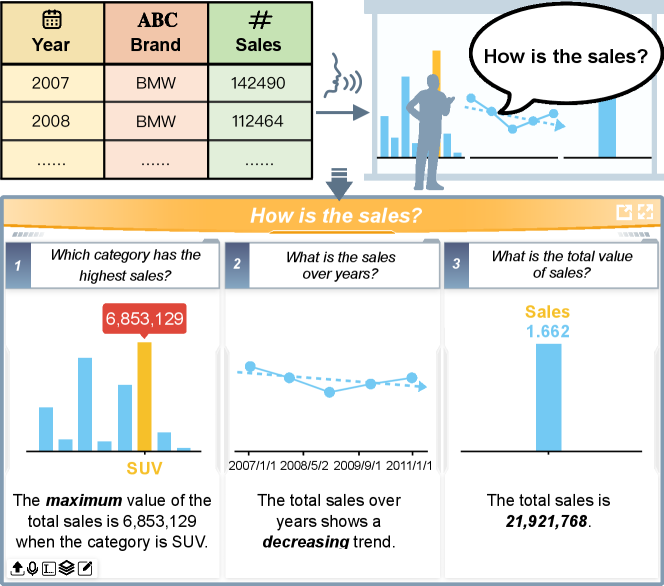
To improve the quality of response, existing techniques are designed either to guide users to provide a specific nature language query (Yu and Silva, 2019) or untangle ambiguities in the input query (Gao et al., 2015) to better capture user requirements and more precisely drive the underlying data analysis for question answering. Following these ideas, most recently, Arpit et al. introduce NL4DV (Narechania et al., 2020), an open source python toolkit that integrates many state-of-the-art techniques (Manning et al., 2014; Miller, 1995; Gao et al., 2015) to translate user queries into a high-level visualization grammar (Satyanarayan et al., 2016). The toolkit is able to map precise queries with concrete requirements to low-level analysis tasks (Amar et al., 2005), which significantly lowers the technique barriers of building an NLI for visualization. In real-world practice, users may not only ask simple questions that can be directly solved by a low-level analysis task (Amar et al., 2005). Instead, complex questions, such as the one shown in Fig 1, requiring combining multiple low-level analysis tasks are also frequently asked, which cannot be easily resolved by the existing techniques (Srinivasan and Stasko, 2017).
To resolve such a complex question is difficult. Many challenges exist: first, complex questions usually cover multiple data dimensions and correspond to multiple low-level analysis tasks that are difficult for a system to differentiate. Second, complex questions usually cannot be directly answered without mentioning the context and elaborating the details from different aspects. It is difficult to correctly extract these contextual information and details from the data merely based on a fuzzy question. Third, to better present the answers, the extracted contextual information and data details should be organized in order and visualized in a form that facilitates result narration and interpretation.
To address the above challenges, we introduce Talk2Data, a natural language interface for exploratory visual analysis that supports natural language queries about an input spreadsheet given by both simple and complex questions. In particular, the system first employs a deep-learning based decomposition model to resolve a complex question into a series of relevant simple questions. After that, a search algorithm is introduced to explore the data space and extract meaningful data facts (Srinivasan et al., 2018) that are most relevant to each simple question. These facts are finally shown in the visualizations as the parts of the answer to the input question. We evaluate the effectiveness of the Talk2Data system via both qualitative evaluation and a controlled user study by comparing it with a baseline system developed based on NL4DV and Vega-Lite. The major contributions are as follows:
-
•
Question Decomposition. We introduce a novel decomposition model that extends the classic sequence-to-sequence architecture (Sutskever et al., 2014) from four aspects: (1) A conditional vector to support the decomposition of different types of complex questions; (2) A decomposition layer to transform the encoding vector of the input complex question into two hidden vectors corresponding to two simple questions; (3) An attention mechanism (Bahdanau et al., 2015; Luong et al., 2015) to enhance the relevance between the input complex question and the output simple questions. (4) A copying mechanism (Gu et al., 2016) to generalize the model to ensure it will correctly respond to the unseen datasets beyond the training corpus.
-
•
Visualization and System. We designed and implemented the first natural language interface for exploratory visual analysis that supports complex questions. A set of re-designed diagrams that facilitate data narratives is also proposed and implemented in the system to represent the data facts extracted for answering the input question.
2. Related Works
In this section, we review the recent studies that are most relevant to our work, including natural language interfaces for visualization and question answering system.
2.1. Natural Language Interface for Data Visualization
Natural Language Interfaces (NLI) provide an accessible approach for data analysis, greatly lowering the requirements of user knowledge. With the goal of improving the usability of visualization NLIs, various systems have been explored both within the research community (Sun et al., 2010; Gao et al., 2015; Setlur et al., 2016; Aurisano et al., 2016; Narechania et al., 2020; Hoque et al., 2017; Cox et al., 2001; Wen et al., 2005; Srinivasan et al., 2020; Liu et al., 2021; Luo et al., 2021) and industry (pow, [n. d.]; tab, [n. d.]). A common challenge for NLIs is how to precisely understand users’ intentions that are presented in a nature language (NL). In order to enhance the capability of NL interpretation, existing NLIs are designed either to guide users to provide a more concrete nature language query (Cox et al., 2001; Setlur et al., 2016; Yu and Silva, 2019) or untangle ambiguities in the input query (Gao et al., 2015; Wen et al., 2005; Sun et al., 2010; tab, [n. d.]) to better capture user’ requirements and more precisely drive the underlying data analysis for question answering.
The initial prototype of visualization NLI (Cox et al., 2001) does not relay on any intelligent approach to interpret user questions but create a set of supporting commands to guide users’ inputs. Flowsense (Yu and Silva, 2019) and Eviza (Setlur et al., 2016) depends on the pre-defined grammar to capture query patterns. When the user types a partial query and pauses, the system triggers the feature of query auto-completion to guide users’ queries. However, the grammar-based methods limits the range of questions as it is impossible to cover all of the possible tasks.
To improve the flexibility in posing data-related questions while managing ambiguities in NL queries, many NLIs leverage the sophisticated NLP parsing techniques (e.g., dependencies) to understand the intuitions of queries and detect ambiguities present in the queries. In Articulate (Sun et al., 2010), the translation of user’s imprecise specification is based on a NL parser imbued with machine learning algorithms that are able to make reasoned decisions automatically. DataTone (Gao et al., 2015) adopts a mixed-initiative approach to manage ambiguities in NLIs. Specifically, the system displays ambiguity widgets along with the main visualization, therefore users are allowed to switch the content in widgets to get desired alternative views. The idea in DataTone are extended to NL4DV toolkit (Narechania et al., 2020), a python-based library released to translate user queries into a high-level visualization grammar. For the developers without experience with NLP, NL4DV can save their efforts on learning NLP knowledge when building the visualization NLIs.
The aforementioned NLIs are only able to answer the precise simple questions. The grammatical-based methods do not support complex questions as interpreting multiple tasks in one query poses parsing difficulty (Yu and Silva, 2019), on the other hand, the NLP parsing techniques leverage rule-based parsers to comprehend user instructions and questions. Thus, when a question does not specifically contain keywords for analytic tasks, these interfaces cannot precisely understand user intentions. However, for the users with few knowledge about the data, it is almost impossible for them to ask precise and concrete question. In practically, the usability of these systems is under user expectations. In order to overcome these limitations, We built a novel deep-learning based model that not only can resolve a complex question into a series of relevant specific simple questions, but also improve the robustness of NL interpretation. In Talk2Data, users can ask both simple and complex questions about a table, and get well-designed diagrams that represent the facts extracted for answering the input question.
2.2. Question Answering System
Question Answering (QA) is a well-researched area about building systems that can answer NL questions. Advances in NLP facilitate the development of various QA systems, such as Text-Based QA (Iyyer et al., 2014; Tran and Niederée, 2018; Feldman and El-Yaniv, 2019; Min et al., 2019; Ding et al., 2019; Perez et al., 2020), Knowledge-Based QA (Bao et al., 2016, 2014; Berant et al., 2013; Saxena et al., 2020), and Table-Based QA (Pasupat and Liang, 2015; Yin et al., 2016; Jauhar et al., 2016; Yin et al., 2020).
In this paper, our work concerns about Table-Based QA, where we are tasked to answer both complex and simple queries given a table. The existing Table-Based QA system, such as (Pasupat and Liang, 2015; Yin et al., 2016; Neelakantan et al., 2016), are designed to answer the simple questions. Given a NL query and a table, Neural Enquirer (Yin et al., 2016) first encodes the query and table into distributed representations, and then use a multi-layer executor to derive the answer. It can be trained using Query-Answer pairs, where the distributed representations of queries and the table are optimized together with the query execution logic in an end-to-end fashion. However, Cho et al. (Cho et al., 2018) stated that only using the answer annotated dataset for training and evaluation may count “spurious” programs, the system will accidentally lead to correct answers by using the wrong cells or operations. Therefore, the authors propose a multi-layer sequential network with attention supervision to answer questions; it uses multiple Selective Recurrent Units to improve the interpretability of the model. Moreover, translating NL to SQL queries is a commonly used approach to answer the questions related to spreadsheets or database (Zhong et al., 2017; Xu et al., 2017; Yu et al., 2018). Seq2SQL (Zhong et al., 2017) leverage the policy-based reinforcement learning to translate the NL queries to corresponding SQL queries. SQLNET (Xu et al., 2017) proposes a sequence-to-set model and a column attention mechanism to synthesize the SQL queries from NL as a slot filling problem. In the past few years, the large-scale pre-trained language models have rapidly improved the ability to understand and answer the free-form questions. The most recent work, TaBERT (Yin et al., 2020), is a pre-trained language model that is built on top of BERT (Devlin et al., 2019) to jointly learn contextual representations for queries and tables, which can be used as encoder of query and table in QA systems.
Although efficient, the above existing Table-Based QA systems are designed to conduct information retrieval tasks, which cannot answer the questions requiring to analyzing the data. Moreover, the input questions for existing systems have to be precise and concrete. When the input question contains multiple tasks or drops the anchor words, the accuracy of system will be strongly impacted (Pasupat and Liang, 2015). Existing works, proposed to resolving complex questions, are concentrated on text-based QA, such as (Perez et al., 2020; Min et al., 2019). To our best knowledge, there is no prior study working on resolving the complex questions about a table. To fill this gap, we introduce Talk2Data, a data-oriented question and answering system that supports both simple and complex questions. In order to answer the complex questions, in Talk2Data, we adopt a novel decomposition model to resolve the complex questions into a series of simples that can be answered by data facts. The decomposition model extends the classic sequence to sequences architecture (Sutskever et al., 2014) and integrate attention and copy mechanism to guide the generation of each simple questions.
3. Overview and System Design
In this section, we describe the design requirements of the Talk2Data system, followed by an introduction of the system architecture and the problem formulation.
3.1. Design Requirements
Our goal is to design and develop a data-oriented question and answering system that is able to automatically extract data facts from an input spreadsheet to answer users’ complex questions about the data. To achieve the goal, a number of requirements should be fulfilled:
-
R1
Elaborate complex questions in context. The system should be able to resolve complex questions and elaborate the problem gradually from different aspects to give a comprehensive answer in context of the input data.
-
R2
Rank the answers. The system should be able to rank the potential answers, i.e., data facts, in order according to their relevance to the question.
-
R3
Clear answers narration. The answers to a complex question, should be visualized with narrative information such as captions and annotations and arranged in a logic order so that the users can easily read and understand them in a short time.
-
R4
Real-time communication and responding. To improve the user experience, the system should be able to support real-time query and should search for the results and respond to users immediately without latency.
3.2. System Architecture and Formulation
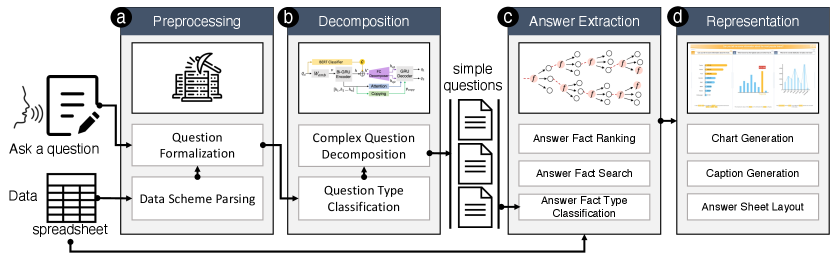
To fulfill the above requirements, as shown in Fig. 2, we design Talk2Data system with four major modules: (a) the preprocessing module, (b) the decomposition module, (c) the answer seeking module, and (d) the answer representation module. In particular, the preprocessing module parses the input tabular data and the corresponding question and combines the parsing results together as word sequence in the following form to facilitate computation:
| (1) |
where is a word / phrase in and is a column in and shows its corresponding data type, i.e., numerical (), temporal () and categorical () respectively.
The decomposition module introduces a deep learning model by extending the classic sequence-to-sequence model to resolve a complex data-oriented question (represented by ) into a series of relevant low-level questions that cover different aspects of the question to guide the answer seeking process (R1):
| (2) |
where is a hidden vector corresponding to a low-level question that can be answered by specific data facts. The details about the decomposition algorithm is discussed in Section 4.
In the answer extraction module, the system searches the data space to extract data facts that are relevant to each of the low-level questions and rank them to find out the answers (R2). The whole process is based on a parallel beam-search algorithm that guarantees the performance requirement as described in (R4). This step can be formally presented as:
| (3) |
where each data fact is a potential answer to the question . The facts are ordered based on their relevance to the question. We define the data fact as a 5-tuple following the definition introduced in (Shi et al., 2020), which is briefly described as follows:
where type (denoted as ) indicates the type of analysis task of the fact, whose value is one of the following cases: showing value, difference, proportion, trend, categorization, distribution, rank, association, extreme, and outlier; subspace (denoted as ) is the data scope given by a set of filters; breakdown (denote as ) is given by temporal or categorical data fields based on which the data items in the subspace can be divided in groups; measure (denote as ) is a numerical data field based on which the program can retrieve a data value or compute a derived aggregated value in the subspace or each data group; focus (denote as ) indicates a set of specific data items in the subspace that require extra attention.
Finally, the representation module organizes the data facts in order and visualize them via a set of captioned and annotated charts (R3) that are specifically designed to help with the narration of data semantics. In the following sections, we will describe the technique details of the decomposition, answer extraction, and representation modules.
4. Question Decomposition
In this section, we first introduce the two basic question decomposition methods followed by a detailed description of the decomposition algorithm and model. After that, we introduce a data corpus that we collected to train our model. Finally, we describe how we implement our algorithm.
4.1. Question Types
Our system is designed to resolve two types of complex questions corresponding to two ways of defining compound tasks (bottom-up and top-down) (Schulz et al., 2013):
-
•
Type-I are questions directly mentioning multiple data facts in the sentence, which can be resolved by the bottom-up approach via enumerating and separating the simple individual questions. For example, the question “In the year with most reviews, what is the distribution of price over different genres?” can be resolved into two simple questions “Which year has the highest reviews?” and “What is the overall distribution of price over genre?”.
-
•
Type-II are questions involving multiple potential data facts due to the omission of some details, which can be resolved by top-down approach via exploring possible individual simple questions. For instance, the question “Which genre of book is an outlier?” can be resolved as simple questions such as “Which genre of books has anomaly user ratings?” and “Which genre of books has anomaly reviews?”.
4.2. Decomposition Algorithm
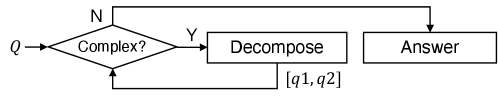
Fig. 3 illustrates the running pipeline of the system’s question decomposition algorithm. Given an input question the algorithm first check if the question is a complex or simple question based on a pre-trained classifier. The simple questions will be directly send to the system’s answering module, but the complex ones will be decomposed iteratively into a series of relevant simple questions via a deep decomposition model. The model resolves an formalized input complex question into a set of sub-questions . If is a simple question, it will be directly answered, otherwise it will be decomposed again. This process runs iteratively until all the complex questions are resolved.
4.3. Decomposition Model
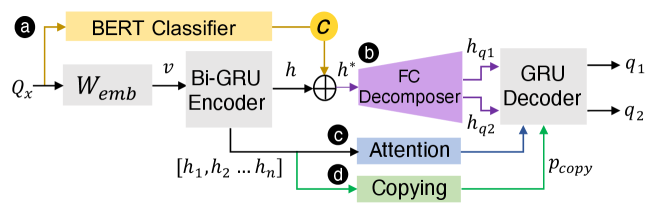
The decomposition model is designed by extending the classic sequence-to-sequence model (Sutskever et al., 2014) from four aspects: (1) we pre-train a BERT-classifier (Devlin et al., 2019) to compute a conditional vector for each input question to indicates the question type (i.e., Type-1 or Type-II) so a proper decomposition method could be chosen by the model; (2) we add a decomposition layer in the model to transform the encoding vector of into two hidden vectors () corresponding to two output questions; (3) we employ the attention mechanism (Bahdanau et al., 2015; Luong et al., 2015) in the model to ensure and enhance the relevance between the input complex question and the output questions. (4) we integrate a copying mechanism (Gu et al., 2016) to generalize the model so that it could make a correct response when users ask questions about a new dataset beyond the training corpus. To make it simple, our model decomposes a complex question into exactly two sub-questions that could either be a simple question or another complex question.
Specifically, given the formulated question , an embedding layer projects each of the input words into a latent vector , which is further encoded by a bidirectional GRU encoder:
| (4) |
where is the vector representation of that captures the semantics of the input question and the corresponding tabular data.
At the same time, as shown in Fig 5-a, a condition vector that indicates the question type is calculated by classifying based on BERT (Devlin et al., 2019), a large scale pre-trained nature language model:
| (5) |
where is the intermediate vector encoded by BERT and is a parameter matrix to be trained. The output is a two-dimensional one-hot conditional vector that indicates the question type with indicating Type-I questions and indicating Type-II questions. With the vector, the model is able to select a proper approach to decompose the input question.
In the next, a decomposition layer is introduced in the model to transform into two hidden vectors and (Fig 5-b). It is implemented by a fully connected feed-forward neural network. Formally, the decomposition process is defined as follows:
| (6) |
where , and are the weight matrix and bias vector to be trained.
Finally, a GRU is used to decode and to generate two sub-questions and word by word as the final output of the model:
| (7) |
In the above process, an attention mechanism (Fig 5-c) (Bahdanau et al., 2015; Luong et al., 2015) is incorporated to allow the decoder referencing to the relevant words in the input question when generating each word in the decomposed sub-question. It further enhances the semantic relevance between the input and output questions. At the time step , the attention layer first calculates the attention weights by considering current hidden state in the decoder and all the hidden states of the encoder :
| (8) |
The contextual vector for the input question is then computed as the weighted average over all the encoder states. After that, the attention layer concatenate and to produce a new hidden state for further predicting next word in the decoder:
| (9) |
where is the weight matrix to be trained.
To design a robust model, we have to consider the situation when decomposing a question about a dataset outside the scope of the training corpus. In this case, an attention mechanism is not enough as it is difficulty to predict an unseen word, e.g., the column name in the new dataset, when generating a sub-question. To address this issue, we integrated the copying mechanism (Fig 5-d) (Gu et al., 2016) in the model, which generalized the model by selectively copying some unseen words directly from the input (either question or data columns) when generating a sub-question. Intuitively, it estimates the probability of using a word copied from the question/data column instead of using a word generated by decoder when produces a new sub-question. Formally, is computed by combining the current hidden state in the RNN model, the contextual vector from the attention mechanism, and the last generated word together:
| (10) |
where is the trainable weighting vector that transform the above three vectors into a single value to predict the probability.
To encourage the output of the decomposition model as identical as possible with the target sentences in our training corpus, the model is trained by minimizing the word-level negative log likelihood loss (Edunov et al., 2018):
| (11) |
where is the current reference word in the target sentence. Given the previous words and the input question , this loss function tends to maximize the probability of the reference word as the prediction for current word.
| Type | Method | % | Complex Question | Decomposed Question | |||||||
|---|---|---|---|---|---|---|---|---|---|---|---|
| Comparison | 10.0 |
|
|
||||||||
| Type-I | Intersection | 13.2 |
|
|
|||||||
| Bridging | 27.7 |
|
|
||||||||
| No fact type | 26.5 |
|
|
||||||||
| Type-II | No measure | 9.5 |
|
|
|||||||
| No breakdown | 13.1 | What is the outlier of user rating? |
|
Implementation
The decomposition model was implemented in PyTorch (Paszke et al., 2019). Both encoder and decoder takes a two-layer GRU with 0.1 dropout rate for avoid over-fitting. The word embedding size and hidden size are both set to 256. The maximum length of the input sentence is 60 words. All the training parameters are initialized and updated via the Adam optimizer (Kingma and Ba, 2014), with a learning rate of 0.0001. The model was trained on a Nvidia Tesla-V100 (16GB) card.
4.4. Training Corpus
To train our model, we prepared a new table-based question decomposition corpus (Table 1) with the help of 700 English native speakers from the crowdsourcing platform111https://www.prolific.co/. The corpus consists of 7,096 complex questions including 3,492 Type-I questions and 3,604 Type-II questions. Two simple questions were prepared as the decomposition results for each of these complex questions, i.e., 14,192 simple questions were prepared. In our corpus, we guarantee each simple question corresponds to an simple analysis task to ensure the question can be answered by at least one data fact. In general, we prepared the corpus via four steps: (1) selecting a set of meaningful data tables in various domains based on which complex questions will be prepared; (2) generating complex questions with all type of structures by a computer program; (3) manually polishing the machine-generated questions to reach the standard of natural language via the crowdsourcing platform; (4) eliminating the low-quality questions.
Table Selection. We collected 70 tabular datasets in different domains from Kaggle and Google dataset search. These datasets were further filtered based on three criteria: (1) containing meaningful data column headers; (2) having sufficient data columns and diverse column types to support all types of questions; and (3) containing informative data insights. As a result, 26 data tables were selected. Each of them has a meaningful column header and contains at least one numerical, one temporal, and one categorical field. All of them were tested by the online auto-insights platform (Shi et al., 2020) to make sure meaningful data insights could be discovered from the data. We also make the size of the data diverse, the number of rows ranges from 26 to 86,454 (mean 7,067); the number of columns ranges from 4 to 16 (mean 9).
Question Generation. To generate a complex question, we created a set of random facts and select the insightful ones based on the methods introduced in (Shi et al., 2020). After that, we enumerated the facts to generate meaningful fact combinations that are potential answers to a complex question based on the methods introduced in (Schulz et al., 2013; Min et al., 2019). Finally, the fact combinations are translated into a complex question based on over 200 manually prepared question templates. We traversed all 26 selected data tables and generated 5,500 Type-I questions and 7,500 Type-II questions, respectively.
Specifically, to create the Type-I questions, we selected data facts via three question reasoning methods, i.e., comparison, intersection, and bridging, as introduced in (Min et al., 2019). In particular, the “comparison” type of questions compare facts within different data scopes based on the same measurement. The “intersection” type of questions seek for data elements that satisfy a number of conditions specified by different data facts. Finally, the “bridging” type of questions asks for a data fact that satisfies a prior condition specified by another.
To generate Type-II questions, we consider three forms of complex questions: (1) the questions without mentioning an analysis task (i.e., no fact type) ; (2) the questions without mentioning the aspect to be estimated (i.e., no measure) ; (3) the questions without mentioning data divisions (i.e., breakdown methods). Obviously these questions do not have a unique answer. Therefore, we choose all the facts that potentially answers such a complex question to help generate questions in these three forms.
Question Rephrasing. To produce high-quality natural language questions, we employed a group of native English speakers to rephrase and polish the generated questions manually. An online system was developed to split the job by randomly allocating 50 machine-generated questions to each participant. They were asked to fix the grammar errors and polish the questions into a natural language representation without changing their original meanings. Finally, 700 native English speakers were involved in our job and 35,000 rephrased questions were collected with an average cost of 0.12 USD per question.
Question Validation. To ensure a high-quality corpus, we validated the rephrased questions through a strict process. First, all the empty and short (less than 3 words) submissions are eliminated from the corpus. After that, from each of the 50 questions processed by a participant, we manually review a 10% question sample. Any problem found in the sample will result in an immediate rejection of all the questions rephrased by the same participant.
Finally, we checked both the semantic and text similarities between the machine-generated and the rephrased questions to eliminate the questions that simply copy the original sentence or greatly alter the original meaning based on the following metric:
| (12) |
where we employ sentence-BERT (Reimers and Gurevych, 2019) to project a machine-generated question and rephrased questions into the same vector space and estimate their based on the cosine-similarity between the corresponding vectors. We computed the text similarity based on the Levenshtein distance , which directly estimates the word differences between two sentences that is formally defined as:
| (13) |
Intuitively, a positive score indicates and share the similar semantics but are different in the text representation, i.e., is a high-quality rephrasing of . In opposite, a negative score indicates the two questions share a similar textual representation but have different meanings, which should be eliminated.
5. Answer Extraction
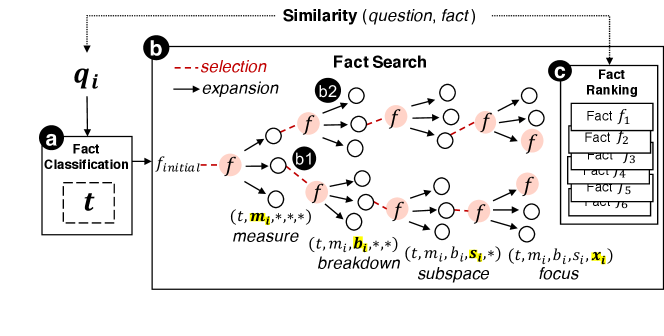
In Talk2Data, the answer extraction module searches the data space to extract data facts that are relevant to each of the simple questions and rank them to find out the answers. To balance performance and efficiency, we employ the BEAM search algorithm, which reduces computation cost when searching in large space, to retrieve the relevant facts for simple questions . As shown in Fig 5, the answer extraction module consists of three parts, including (a) fact classification, (b) fact search, and (c) fact ranking.
5.1. Fact Classification
The first thing to retrieve an answer fact to a simple question is to figure out the analysis tasks that are mentioned or implied in a question, so that the fact type could be determined and the rest fields in the fact could be explored guiding by the fact type. To this end, we pre-trained a BERT-classifer to indicate the type of fact given a simple question . We fine-tuned the BERT model by combining an additional classification layer and trained it on our corpus to classify the input simple question:
| (14) |
where is the intermediate vector encoded by the BERT model and is the trainable matrix in the classification layer. The output is a ten-dimensional one-hot vector that represents the type of answer fact to the input simple question .
5.2. Fact Search
Given a preferred fact type (), we employ the beam search algorithm (Ow and Morton, 1988) to determine the rest of fact fields, i.e., subspace (), breakdown () , measure () and focus () by searching through the entire data space . In particular, we use semantic similarities between the resulting facts and the input question as the heuristic function to guide the searching process with the goal of retrieving facts that are most relevant to the question. As shown in Fig 5 and summarized in Algorithm 1, the algorithm explores the data space to examine a number of candidate choices for each fact field step by step via a search tree . In each searching step, the algorithm chooses a candidate value (e.g, a data column) for the corresponding fact field that makes the fact having the highest reward. Finally, the fact is determined by a path from the root to a leaf in the search tree.
The search tree is gradually generated through a searching process as described in Algorithm 1. In particular, the algorithm takes a simple question , a fact type , a tabular data , and a beam width (the number of selected facts at each round) as the input and automatically generates a set of data facts that are most relevant to the question. At the beginning, the type initializes a data fact to confirm the rest fields in the fact, and use as the root of the (line 1, Fig 5-b). In next, the algorithm generates data facts by iteratively searching the rest fields in facts via three major steps: selection, expansion, ranking. The first step selects that contains the highest facts ranked in , from which the next expansion step will be performed (line 3, Fig 5-b1). The second step expands the by creating a set of data facts. (line 4 - 8, Fig 5-b2). The new data facts are generated by filling the field in with candidate values from . The third step ranks the new facts in based on the semantic similarities between and question (line 10). The top facts ranked in are identified as the most relevant facts for the question (line 12).
5.3. Fact Ranking
To retrieve a set of facts that are most relevant to the input simple question , in each round of expansion, the facts in are ranked by their semantic similarity between and . As facts are in the form of 5-tuple, we first use hand-written templates to transform facts into machine-generated questions. If the facts are not complete, questions will be generated based on existing fields. Then we employ the Sentence-BERT (Reimers and Gurevych, 2019) to project machine-generated questions and the input question into the same vector space and use the cosine-similarity between corresponding vectors to estimate their semantic similarity.
6. User Interface and Visualization
In this section, we introduce the representation module of the Talk2Data system. We demonstrate the design of the system’s user interface and the corresponding interactions. After that, we introduce how the data facts are visually represented by a library of annotated charts and arranged in order to answer the input question.
6.1. User Interface and Interactions
The user interface of the Talk2Data system consists of two views: (1) the data view (Fig. 6(a)) and (2) the answer view (Fig. 6(b)). In particular, the data view is designed to illustrate the raw data to users so that they could initiate a question. In particular, the data is shown in a data table (Fig. 6(a1)) whose columns are colored by the corresponding data types. A question panel (Fig. 6(a2)) is also provided in the view to display potential questions that could be asked about the data. When a data column is selected, the question list will be updated accordingly to show questions that are only relevant to the selected column. The answer view (Fig. 6(b)) represents data facts that answer the question via a library of annotated charts, the charts are arranged in order to facilitate the interpretation and narration of the answers. In particular, in this view, user’s question is represented as the title of view (Fig. 6(b1)), and decomposed questions are shown as sub-titles in each section that are answered by data facts (Fig. 6(b2)). Each data fact is visualized by an annotated chart with a narrative caption.
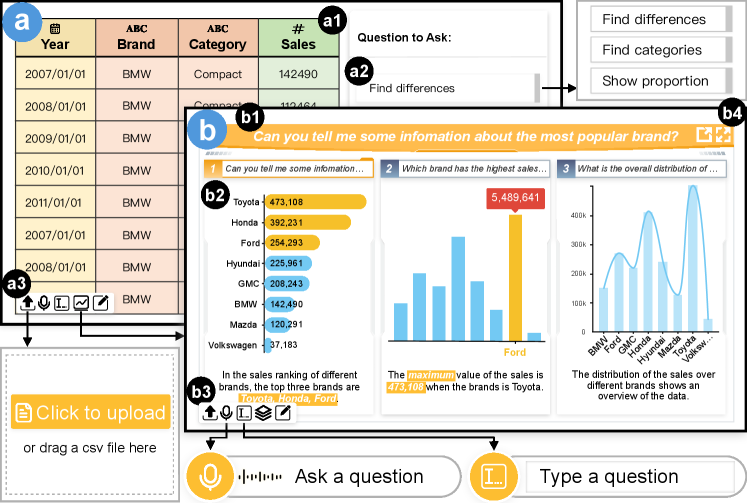
A floating tool bar (Fig. 6(a3, b3)) is designed and placed at the bottom of both views, through which users can upload the data, ask a question via both voice and text input, enter the edit mode for editing the answers, and switch between the data and answer views. We use the Web Speech API 222Web Speech API: https://developer.mozilla.org/Web/API/Web_Speech_API to convert audio to text in the web browser. Users can also enter the full-screen mode or covert the results into a PDF report by clicking the buttons in the up-right corner (Fig. 6(b4)).
6.2. Annotated Chart Library for Tabular Data
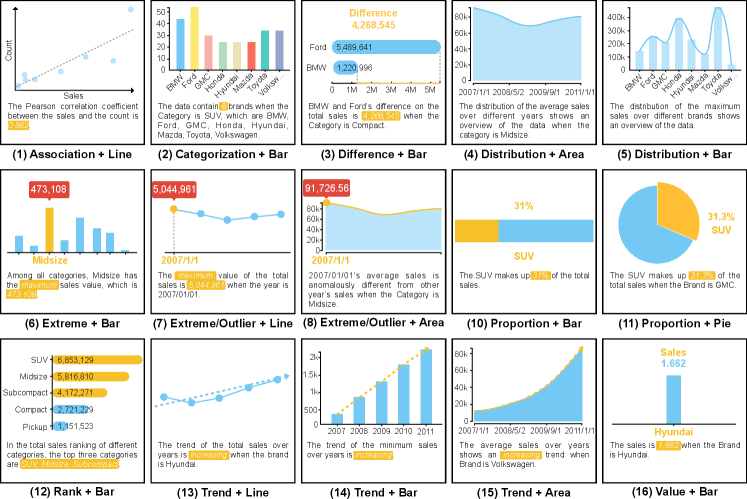
In data storytelling, annotations in charts will help emphasize the information and avoid ambiguity (Lee et al., 2015). Therefore, we design a library of annotated statistical charts 333The chart library will be released after the review to display the data facts that answer the question with the goal of helping with the answer narration and interpretation. Our chart library consists of 5 types of basic statistic diagrams (bar chart, line chart, pie chart, area chart, and scatter plots) that are frequently used in data stories as summarized in (Shi et al., 2021). To design the annotations, we further investigated a large number of relevant designs by exploring the design of the charts frequently used in over 200 data videos and over 1500 info-graphics. As a result, annotations involving text, colors, shapes, pointers, lines are designed for showing values, illustrating the trends and relations, highlighting anomalies and extremes, emphasizing differences and ranks, and differentiate categories and proportions. Applying annotations in the aforementioned 5 types of charts to represent different narrative semantics gives us 15 different annotated charts(Fig. 7). For example, we use dash-lines in a bar chart to emphasize difference but use trending lines in bar chart to illustrate trend, which result in two different annotated charts.
Despite the above annotations, caption is another crucial component in each of the annotated charts. It usually describes the important data patterns in a nature language to help users quickly capture the information shown in the chart. To generate the caption, we adopt the sentence template for each type of fact introduced in (Shi et al., 2020). Considering these templates may generate problematic descriptions that have grammar errors, our system enables a free editing function, through which users can easily edit the captions to fix the errors when necessary.
6.3. Answer Facts Layout
We display the answers to the input question in the form of a dashboard that could be easily displayed on a big screen to facilitate online discussions about the data in real-time. The annotated charts are arranged in order to facilitate reading and answer narration. In particular, we divide the screen into several regions and allocate to decomposed questions. Within each region, we arrange the charts in order according to their relevance to the corresponding questions, and place them one by one from left to right and top to bottom to facilitate reading. The size of each chart is determined by their relevance score to the question.
7. Evaluation
We estimate the design of the system via an example case, an ablation study, and a controlled user study.
7.1. Example Case
We performed a case study by inviting an expert from a business school to explore and analyzing a marking dataset about car sales records. The dataset consists of four dimensions: year, sales value, model, and brand (Fig. 1). The user started with a complex fuzzy question (i.e., Type-II) “How is the sales?”. The system automatically decomposed the question into three relevant simple questions: “which category has the highest sales?” (Q1.1), “what is the sales over years?” (Q1.2), and “what is the overall value of the sales?” (Q1.3), which are answered by three annotated charts showing the best selling model, the overall sales trend, and the total sales value as shown in Fig. 1.
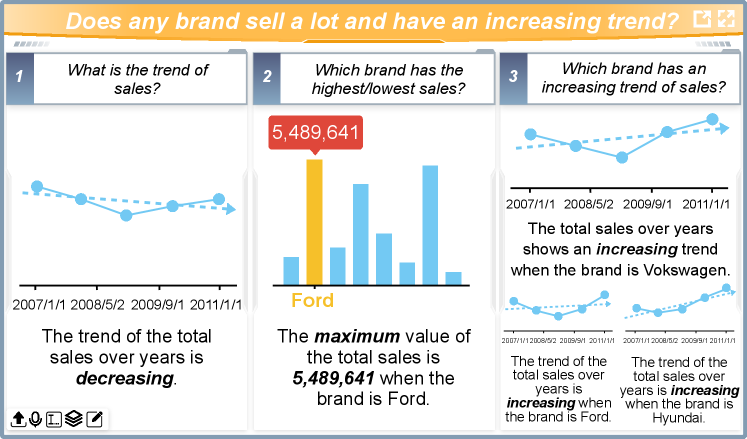
Having the above overview of the data, the user would like to dig deeper into the data. He asked “does any brand sell a lot and have an increasing trend?” (i.e., Type-I). The system resolves the question into three relevant simple questions: (1) “what is the trend of sales?” (Q2.1), (2)“which brand has the highest/lowest sales?” (Q2.2), and (3) “which brand has an increasing trend of sales?” (Q2.3). The answers to these questions are shown in a group of charts as illustrated in Fig. 8, which respectively illustrates the sales trend, showing the highest sales record among different brands and the sales trend of each brand.
7.2. Ablation Study
We estimate the quality of the question decomposition results based on the testing corpus via two frequently used metrics in nature language processing, i.e., BLEU (Papineni et al., 2002) and METEOR (Banerjee and Lavie, 2005). These metrics are originally designed to estimate the quality of sentence translation. In particular, BLEU estimates the word-level translation precision based on the number of exactly matched words between the translated sentences and the ground-truth. METEOR computes a weighted F1-score to estimate the translation quality by comparing the translated sentences and ground-truth based on WordNet (Miller, 1995). These metrics are verified to be able to provide estimations that are consistent with humans’ judgments (Nema and Khapra, 2018). In our experiment, we use these matrices to estimate the decomposition quality by comparing the decomposed sub-questions to the corresponding targets in the testing corpus.
We estimate the performance of the proposed decomposition model by comparing it to three simplified versions that respectively have (1) no copying mechanism, (2) no copying and attention mechanisms, and (3) no copying, attention, and question type classification components. All these models were trained based on the question decomposition corpus under the same parameters settings. In particular, the training set, validation set, and evaluation set respectively takes 80%, 10%, and 10% of the corpus. We also involve a high-quality sentence rewriting technique as the baseline for comparison (Xiao et al., 2020).
The evaluation results are summarized in Table 2, which shows that (1) the sentence quality of our technique is equivalent to that of the high-quality sentence rewriting technique, and (2) our designs of the key components (question type classifier, attention, and copying mechanism) indeed improve the performance of the question decomposition model.
| Models | BLEU | METEOR |
|---|---|---|
| Sentence Rewriting Baseline | - | 22.12 |
| Decomposer | 23.88 | 24.02 |
| Decomposer + Classifier | 25.23 | 25.73 |
| Decomposer + Classifier + Attention | 25.56 | 26.09 |
| Decomposer + Classifier + Attention + Copying | 26.22 | 27.55 |
7.3. User Study
To estimate the usability of the system, we conducted a controlled within-subject study with 20 participants to make a comparison between Talk2Data and a baseline system developed based on NL4DV and vega-lite charts. The participants (13 female, 7 male, between 21 and 28 years old (M = 24.8, SD = 1.94)) are university students major in design and literature. They have limited knowledge about data analysis.
Two real datasets were used for the study. The first one describes 549 Amazon bestselling books (rows) from six dimensions (columns) including book title, rating, number of reviews, published year, price, and genre. The second dataset describes 275 car sales records from four dimensions including the sales value, brand, model, and the year. These two datasets were used in both the Talk2Data and the baseline system during the study in a counterbalanced order.
During the study, we first introduced the systems and let the participants to try it by their own. After the users were getting familiar with systems, they were asked to finish six tasks by asking relevant questions by their own. Three of these tasks were simple ones such as “find the distribution of ratings over books” but the other three were complex ones such as “find the most popular author”. During the experiment, we recorded the number of questions asked by a user to finish each task in each system. This number were together with the accuracy to estimate their performance. Finally, the participants were also asked to finish a post-study questionnaire. The study results are reported as follows:
Accuracy. As shown in Fig. 9(a), Talk2Data (M=95%, SD=0.16) and the baseline (M=95%, SD=0.12) had a similar accuracy when finding answers to low level questions. However, our system (M=87.6%, SD=0.17) significantly outperformed the baseline system (M=67.5%, SD=0.28) in case of resolving complex questions based on the paired-t test (t(19) = 4.08, p <0.01).
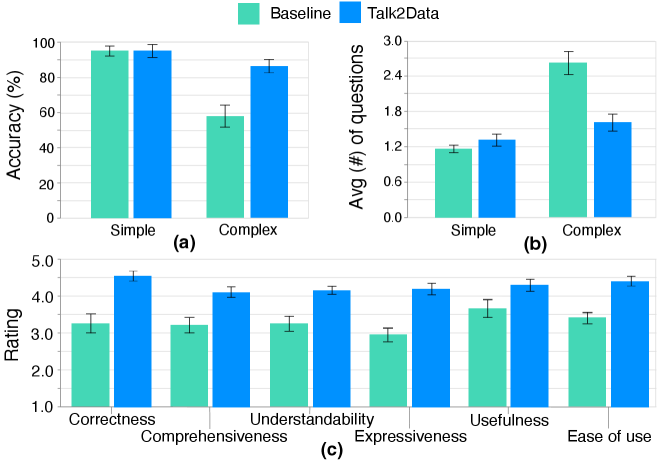
Efficiency. We compared the averaged number of questions that users need to finish each of the tasks to demonstrate a system’s efficiency. As shown in Fig. 9(b), when solving simple tasks, users explored a similar number of questions when using Talk2Data (M = 1.17,SD = 0.49) and the baseline (M = 1.32,SD = 0.76) system. However, for complex tasks, users obviously tend to ask more questions when using the baseline system (M = 2.63,SD = 1.53) comparing to that of Talk2Data (M = 1.62,SD = 1.11). The difference is significant regarding to the paired-t test (t(59) = 4.4, p <0.01).
Feedback. The results (Fig. 9(c)) of our post-study questionnaire showed that all the users preferred our system. Most of them mentioned “Talk2Data is a useful tool”, “it can greatly save one’s efforts when exploring the data”, and “the system is easy to use”. Many users also mentioned “dividing a complex question into simple ones and answer them one by one is an intuitive and effective way to solve the problem”.
8. Limitations and Future Work
Here, we would like to report and discuss several limitations that was found during our system implementation and evaluation.
Scalability Issue. The current implementation of the prototype system still cannot handle large datasets that contain tens of thousands of data records, where the answer extraction algorithm is the primary bottleneck. It will be more difficult to find out accurate answers from a large dataset within a fixed period of time. There are several approaches that could be applied to address the issue, which will be our future work. First, using parallel searching algorithms (Roosta, 2000) will greatly improve the algorithm efficiency. Second, using a pre-trained model such as TaBERT (Yin et al., 2020), to built a table-based Q&A system, will also improve the system’s performance. Although such a system doesn’t exist yet, we believe it is a promising research direction.
Accuracy Issue. Although showing the relevant context is helpful for the answer interpretation, when mistake happens, the irrelevant charts could also be a distraction, which will affect users’ judgments. We believe there are two methods that could be used to improve the accuracy of the system. First, we can employ knowledge bases such as WolframAlpha 444WolframAlpha: https://www.wolframalpha.com/ and knowledge graphs to guide the searching directions so that the answers could be more directly found without checking too many irrelevant candidates in the space. Second, again, training a QA system based on TaBERT (Yin et al., 2020) could also help improve the accuracy.
Generalization Issue. Our training corpus is generated based on 26 tabular data that primarily contain marketing data records such as car sales values, and best selling books. As a result, our model could better handle complex questions in the marking domain, but may have a lower question decomposition quality when facing a question from other domains. To overcome the issue, more datasets in various domains should be collected and more questions should be prepared to train the model and improve the generalization of the system.
9. Conclusion
We present Talk2Data, a natural language interface for exploratory visual analysis that supports answering both simple and complex questions. It employs a deep-learning based question decomposition model to resolve a complex question into a series of relevant simple questions, and a search algorithm to extract the data facts that are most relevant to each of simple questions. To visualize the data facts, we designed a set of annotated and captioned visualization charts to support interpretation and narration. The proposed technique was evaluated via an ablation study and a controlled user study. The evaluation showed the power of the Talk2Data and revealed limitations and future work of the current system.
Acknowledgements.
Nan Cao and Qing Chen are the corresponding authors. This work was supported in part by NSFC 62061136003, NSFC 6200070909, NSFC 62072338, and NSF Shanghai 23ZR1464700.References
- (1)
- pow ([n. d.]) [n. d.]. Microsoft Power BI Q&A. https://powerbi.microsoft.com. [Online; accessed 11-March-2021].
- tab ([n. d.]) [n. d.]. Tableau Ask Data. https://www.tableau.com/products/new-features/ask-data. [Online; accessed 11-March-2021].
- Amar et al. (2005) Robert Amar, James Eagan, and John Stasko. 2005. Low-level components of analytic activity in information visualization. In IEEE Symposium on Information Visualization. IEEE, 111–117.
- Aurisano et al. (2016) Jillian Aurisano, Abhinav Kumar, Alberto Gonzalez, Jason Leigh, Barbara DiEugenio, and Andrew Johnson. 2016. Articulate2: Toward a conversational interface for visual data exploration. In IEEE Visualization.
- Bahdanau et al. (2015) Dzmitry Bahdanau, Kyunghyun Cho, and Yoshua Bengio. 2015. Neural Machine Translation by Jointly Learning to Align and Translate. In International Conference on Learning Representations.
- Banerjee and Lavie (2005) Satanjeev Banerjee and Alon Lavie. 2005. METEOR: An Automatic Metric for MT Evaluation with Improved Correlation with Human Judgments. In Proceedings of the ACL Workshop on Intrinsic and Extrinsic Evaluation Measures for Machine Translation and/or Summarization. Association for Computational Linguistics, Ann Arbor, Michigan, 65–72.
- Bao et al. (2016) Junwei Bao, Nan Duan, Zhao Yan, Ming Zhou, and Tiejun Zhao. 2016. Constraint-Based Question Answering with Knowledge Graph. In Proceedings of International Conference on Computational Linguistics. The COLING 2016 Organizing Committee, Osaka, Japan, 2503–2514.
- Bao et al. (2014) Junwei Bao, Nan Duan, Ming Zhou, and Tiejun Zhao. 2014. Knowledge-Based Question Answering as Machine Translation. In Proceedings of the Association for Computational Linguistics. Association for Computational Linguistics, Baltimore, Maryland, 967–976.
- Battle and Heer (2019) Leilani Battle and Jeffrey Heer. 2019. Characterizing exploratory visual analysis: A literature review and evaluation of analytic provenance in tableau. In Computer graphics forum, Vol. 38. Wiley Online Library, 145–159.
- Berant et al. (2013) Jonathan Berant, Andrew Chou, Roy Frostig, and Percy Liang. 2013. Semantic Parsing on Freebase from Question-Answer Pairs. In Proceedings of the Conference on Empirical Methods in Natural Language Processing. Association for Computational Linguistics, Seattle, Washington, USA, 1533–1544.
- Cho et al. (2018) Minseok Cho, Reinald Kim Amplayo, Seung-won Hwang, and Jonghyuck Park. 2018. Adversarial tableqa: Attention supervision for question answering on tables. In Asian Conference on Machine Learning. PMLR, 391–406.
- Cox et al. (2001) Kenneth Cox, Rebecca E Grinter, Stacie L Hibino, Lalita Jategaonkar Jagadeesan, and David Mantilla. 2001. A multi-modal natural language interface to an information visualization environment. International Journal of Speech Technology 4, 3 (2001), 297–314.
- Devlin et al. (2019) Jacob Devlin, Ming-Wei Chang, Kenton Lee, and Kristina Toutanova. 2019. BERT: Pre-training of Deep Bidirectional Transformers for Language Understanding. In Proceedings of the Association for Computational Linguistics. Association for Computational Linguistics, Minneapolis, Minnesota, 4171–4186.
- Ding et al. (2019) Ming Ding, Chang Zhou, Qibin Chen, Hongxia Yang, and Jie Tang. 2019. Cognitive Graph for Multi-Hop Reading Comprehension at Scale. In Proceedings of the Association for Computational Linguistics. Association for Computational Linguistics, Florence, Italy, 2694–2703.
- Edunov et al. (2018) Sergey Edunov, Myle Ott, Michael Auli, David Grangier, and Marc’Aurelio Ranzato. 2018. Classical Structured Prediction Losses for Sequence to Sequence Learning. In Proceedings of the 2018 Conference of the North American Chapter of the Association for Computational Linguistics. Association for Computational Linguistics, New Orleans, Louisiana, 355–364.
- Feldman and El-Yaniv (2019) Yair Feldman and Ran El-Yaniv. 2019. Multi-Hop Paragraph Retrieval for Open-Domain Question Answering. In Proceedings of the Association for Computational Linguistics. Association for Computational Linguistics, Florence, Italy, 2296–2309.
- Gao et al. (2015) Tong Gao, Mira Dontcheva, Eytan Adar, Zhicheng Liu, and Karrie G. Karahalios. 2015. DataTone: Managing Ambiguity in Natural Language Interfaces for Data Visualization. In Proceedings of the Annual ACM Symposium on User Interface Software & amp; Technology (Charlotte, NC, USA). Association for Computing Machinery, New York, NY, USA, 489–500.
- Gu et al. (2016) Jiatao Gu, Zhengdong Lu, Hang Li, and Victor O.K. Li. 2016. Incorporating Copying Mechanism in Sequence-to-Sequence Learning. In Proceedings of the Association for Computational Linguistics. Association for Computational Linguistics, Berlin, Germany, 1631–1640.
- Hoque et al. (2017) Enamul Hoque, Vidya Setlur, Melanie Tory, and Isaac Dykeman. 2017. Applying pragmatics principles for interaction with visual analytics. IEEE Transactions on Visualization and Computer Graphics 24, 1 (2017), 309–318.
- Iyyer et al. (2014) Mohit Iyyer, Jordan Boyd-Graber, Leonardo Claudino, Richard Socher, and Hal Daumé III. 2014. A Neural Network for Factoid Question Answering over Paragraphs. In Proceedings of the Conference on Empirical Methods in Natural Language Processing. Association for Computational Linguistics, Doha, Qatar, 633–644.
- Jauhar et al. (2016) Sujay Kumar Jauhar, Peter Turney, and Eduard Hovy. 2016. Tables as Semi-structured Knowledge for Question Answering. In Proceedings of the Association for Computational Linguistics. Association for Computational Linguistics, Berlin, Germany, 474–483.
- Kingma and Ba (2014) Diederik P Kingma and Jimmy Ba. 2014. Adam: A method for stochastic optimization. arXiv preprint arXiv:1412.6980 (2014).
- Lee et al. (2015) Bongshin Lee, Nathalie Henry Riche, Petra Isenberg, and Sheelagh Carpendale. 2015. More Than Telling a Story: Transforming Data into Visually Shared Stories. IEEE Computer Graphics and Applications 35, 5 (2015), 84–90.
- Liu et al. (2021) Can Liu, Yun Han, Ruike Jiang, and Xiaoru Yuan. 2021. Advisor: Automatic visualization answer for natural-language question on tabular data. In 2021 IEEE 14th Pacific Visualization Symposium (PacificVis). IEEE, 11–20.
- Luo et al. (2021) Yuyu Luo, Nan Tang, Guoliang Li, Jiawei Tang, Chengliang Chai, and Xuedi Qin. 2021. Natural Language to visualization by neural machine translation. IEEE Transactions on Visualization and Computer Graphics 28, 1 (2021), 217–226.
- Luong et al. (2015) Thang Luong, Hieu Pham, and Christopher D. Manning. 2015. Effective Approaches to Attention-based Neural Machine Translation. In Proceedings of the Conference on Empirical Methods in Natural Language Processing. Association for Computational Linguistics, Lisbon, Portugal, 1412–1421.
- Manning et al. (2014) Christopher Manning, Mihai Surdeanu, John Bauer, Jenny Finkel, Steven Bethard, and David McClosky. 2014. The Stanford CoreNLP Natural Language Processing Toolkit. In Proceedings of the Association for Computational Linguistics. Association for Computational Linguistics, Baltimore, Maryland, 55–60.
- Miller (1995) George A Miller. 1995. WordNet: a lexical database for English. Commun. ACM 38, 11 (1995), 39–41.
- Min et al. (2019) Sewon Min, Victor Zhong, Luke Zettlemoyer, and Hannaneh Hajishirzi. 2019. Multi-hop Reading Comprehension through Question Decomposition and Rescoring. (2019), 6097–6109.
- Narechania et al. (2020) Arpit Narechania, Arjun Srinivasan, and John Stasko. 2020. NL4DV: A Toolkit for Generating Analytic Specifications for Data Visualization from Natural Language Queries. IEEE Transactions on Visualization and Computer Graphics (2020).
- Neelakantan et al. (2016) Arvind Neelakantan, Quoc V Le, Martin Abadi, Andrew McCallum, and Dario Amodei. 2016. Learning a natural language interface with neural programmer. arXiv preprint arXiv:1611.08945 (2016).
- Nema and Khapra (2018) Preksha Nema and Mitesh M. Khapra. 2018. Towards a Better Metric for Evaluating Question Generation Systems. In Proceedings of the Conference on Empirical Methods in Natural Language Processing. Association for Computational Linguistics, Brussels, Belgium, 3950–3959.
- Ow and Morton (1988) Peng Si Ow and Thomas E Morton. 1988. Filtered beam search in scheduling. The International Journal Of Production Research 26, 1 (1988), 35–62.
- Papineni et al. (2002) Kishore Papineni, Salim Roukos, Todd Ward, and Wei-Jing Zhu. 2002. Bleu: a Method for Automatic Evaluation of Machine Translation. In Proceedings of the Association for Computational Linguistics. Association for Computational Linguistics, Philadelphia, Pennsylvania, USA, 311–318.
- Pasupat and Liang (2015) Panupong Pasupat and Percy Liang. 2015. Compositional Semantic Parsing on Semi-Structured Tables. (2015), 1470–1480.
- Paszke et al. (2019) Adam Paszke, Sam Gross, Francisco Massa, Adam Lerer, James Bradbury, Gregory Chanan, Trevor Killeen, Zeming Lin, Natalia Gimelshein, Luca Antiga, et al. 2019. Pytorch: An imperative style, high-performance deep learning library. Proceedings of the International Conference on Neural Information Processing Systems (2019), 8026–8037.
- Perez et al. (2020) Ethan Perez, Patrick Lewis, Wen-tau Yih, Kyunghyun Cho, and Douwe Kiela. 2020. Unsupervised Question Decomposition for Question Answering. In Proceedings of the Conference on Empirical Methods in Natural Language Processing. Association for Computational Linguistics, Online, 8864–8880.
- Reimers and Gurevych (2019) Nils Reimers and Iryna Gurevych. 2019. Sentence-BERT: Sentence Embeddings using Siamese BERT-Networks. In Proceedings of the Conference on Empirical Methods in Natural Language Processing. Association for Computational Linguistics, Hong Kong, China, 3982–3992.
- Roosta (2000) Seyed H Roosta. 2000. Parallel Search Algorithms. In Parallel Processing and Parallel Algorithms. Springer, 319–353.
- Satyanarayan et al. (2016) Arvind Satyanarayan, Dominik Moritz, Kanit Wongsuphasawat, and Jeffrey Heer. 2016. Vega-lite: A grammar of interactive graphics. IEEE Transactions on Visualization and Computer Graphics 23, 1 (2016), 341–350.
- Saxena et al. (2020) Apoorv Saxena, Aditay Tripathi, and Partha Talukdar. 2020. Improving Multi-hop Question Answering over Knowledge Graphs using Knowledge Base Embeddings. In Proceedings of the Association for Computational Linguistics. Association for Computational Linguistics, Online, 4498–4507.
- Schulz et al. (2013) Hans-Jörg Schulz, Thomas Nocke, Magnus Heitzler, and Heidrun Schumann. 2013. A design space of visualization tasks. IEEE Transactions on Visualization and Computer Graphics 19, 12 (2013), 2366–2375.
- Setlur et al. (2016) Vidya Setlur, Sarah E. Battersby, Melanie Tory, Rich Gossweiler, and Angel X. Chang. 2016. Eviza: A Natural Language Interface for Visual Analysis. In Proceedings of the Annual Symposium on User Interface Software and Technology (Tokyo, Japan). Association for Computing Machinery, New York, NY, USA, 365–377.
- Shi et al. (2021) Danqing Shi, Fuling Sun, Xinyue Xu, Xingyu Lan, David Gotz, and Nan Cao. 2021. AutoClips: An Automatic Approach to Video Generation from Data Facts. In Computer Graphics Forum, Vol. 40. Wiley Online Library, 495–505.
- Shi et al. (2020) Danqing Shi, Xinyue Xu, Fuling Sun, Yang Shi, and Nan Cao. 2020. Calliope: Automatic Visual Data Story Generation from a Spreadsheet. IEEE Transactions on Visualization and Computer Graphics (2020).
- Srinivasan et al. (2018) Arjun Srinivasan, Steven M Drucker, Alex Endert, and John Stasko. 2018. Augmenting visualizations with interactive data facts to facilitate interpretation and communication. IEEE transactions on visualization and computer graphics 25, 1 (2018), 672–681.
- Srinivasan et al. (2020) Arjun Srinivasan, Bongshin Lee, and John T Stasko. 2020. Interweaving multimodal interaction with flexible unit visualizations for data exploration. IEEE Transactions on Visualization and Computer Graphics (2020).
- Srinivasan and Stasko (2017) Arjun Srinivasan and John Stasko. 2017. Natural language interfaces for data analysis with visualization: Considering what has and could be asked. In Proceedings of the Eurographics/IEEE VGTC Conference on Visualization. 55–59.
- Sun et al. (2010) Yiwen Sun, Jason Leigh, Andrew Johnson, and Sangyoon Lee. 2010. Articulate: A Semi-Automated Model for Translating Natural Language Queries into Meaningful Visualizations. In Proceedings of the International Conference on Smart Graphics (Banff, Canada). Springer-Verlag, Berlin, Heidelberg, 184–195.
- Sutskever et al. (2014) Ilya Sutskever, Oriol Vinyals, and Quoc V. Le. 2014. Sequence to Sequence Learning with Neural Networks. In Proceedings of the International Conference on Neural Information Processing Systems (Montreal, Canada). MIT Press, Cambridge, MA, USA, 3104–3112.
- Tran and Niederée (2018) Nam Khanh Tran and Claudia Niederée. 2018. A Neural Network-Based Framework for Non-Factoid Question Answering. In Companion Proceedings of the The Web Conference (Lyon, France). International World Wide Web Conferences Steering Committee, Republic and Canton of Geneva, CHE, 1979–1983.
- Tukey et al. (1977) John W Tukey et al. 1977. Exploratory data analysis. Vol. 2. Reading, MA.
- Wen et al. (2005) Zhen Wen, Michelle X Zhou, and Vikram Aggarwal. 2005. An optimization-based approach to dynamic visual context management. In IEEE Symposium on Information Visualization. IEEE, 187–194.
- Wongsuphasawat et al. (2015) Kanit Wongsuphasawat, Dominik Moritz, Anushka Anand, Jock Mackinlay, Bill Howe, and Jeffrey Heer. 2015. Voyager: Exploratory analysis via faceted browsing of visualization recommendations. IEEE transactions on visualization and computer graphics 22, 1 (2015), 649–658.
- Xiao et al. (2020) Liqiang Xiao, Lu Wang, Hao He, and Yaohui Jin. 2020. Copy or Rewrite: Hybrid summarization with hierarchical reinforcement learning. In Proceedings of the AAAI Conference on Artificial Intelligence, Vol. 34. 9306–9313.
- Xu et al. (2017) Xiaojun Xu, Chang Liu, and Dawn Song. 2017. Sqlnet: Generating structured queries from natural language without reinforcement learning. arXiv preprint arXiv:1711.04436 (2017).
- Yin et al. (2016) Pengcheng Yin, Zhengdong Lu, Hang Li, and Kao Ben. 2016. Neural Enquirer: Learning to Query Tables in Natural Language. In Proceedings of the Workshop on Human-Computer Question Answering. Association for Computational Linguistics, San Diego, California, 29–35.
- Yin et al. (2020) Pengcheng Yin, Graham Neubig, Wen-tau Yih, and Sebastian Riedel. 2020. TaBERT: Pretraining for Joint Understanding of Textual and Tabular Data. In Proceedings of the Association for Computational Linguistics. Association for Computational Linguistics, Online, 8413–8426.
- Yu and Silva (2019) Bowen Yu and Cláudio T Silva. 2019. Flowsense: A natural language interface for visual data exploration within a dataflow system. IEEE Transactions on Visualization and Computer Graphics 26, 1 (2019), 1–11.
- Yu et al. (2018) Tao Yu, Zifan Li, Zilin Zhang, Rui Zhang, and Dragomir Radev. 2018. TypeSQL: Knowledge-Based Type-Aware Neural Text-to-SQL Generation. In Proceedings of the Conference of the North American Chapter of the Association for Computational Linguistics. Association for Computational Linguistics, New Orleans, Louisiana, 588–594.
- Zhong et al. (2017) Victor Zhong, Caiming Xiong, and Richard Socher. 2017. Seq2sql: Generating structured queries from natural language using reinforcement learning. arXiv preprint arXiv:1709.00103 (2017).