Temperature dependence and limiting mechanisms of the upper critical field of FeSe thin films
Abstract
We use magnetoresistance measurements at high magnetic field ( T) and low temperature ( mK) to gain fresh insights into the behavior of the upper critical field, , in superconducting ultrathin FeSe films of varying degrees of disorder, grown by molecular beam epitaxy on SrTiO3. Measurements of across samples with a widely varying superconducting critical temperature (1.2 K K) generically show similar qualitative temperature dependence. We analyze the temperature dependence of in the context of Werthamer-Helfand-Hohenberg (WHH) theory. The analysis yields parameters that indicate a strong Pauli paramagnetic pair-breaking mechanism which is also reflected by pseudo-isotropic superconductivity in the limit of zero temperature. In the lower samples, we observe a spin-orbit scattering driven enhancement of above the strongly-coupled Pauli paramagnetic limit. We also observe clear deviations from WHH theory at low temperature, regardless of . We attribute this to the multi-band superconductivity of FeSe and possibly to the emergence of a low temperature, high field superconducting phase.
I Introduction
Understanding superconductivity in the structurally and stoichiometrically simple material system FeSe has been the target of many experimental efforts since its initial discovery in tetragonal phase single crystals with K [1, 2]. The superconducting behavior of FeSe thin films in the 2D limit has received a particular surge in attention in recent years after reports of significantly enhanced superconducting gap closing critical temperatures up to 65 K when interfaced with SrTiO3 (STO) substrates, as measured by in vacuo angle-resolved photoemission spectroscopy (ARPES) and scanning tunneling spectroscopy (STS) [3, 4, 5, 6, 7, 8]. In vacuo electrical transport measurements on pristine (uncapped) 2D FeSe films grown on STO show reproducible zero resistance at as high as K [9, 10, 11], significantly higher than in FeSe bulk crystals and consistent with the large superconducting gap seen in ARPES and STS. Despite many experimental studies of superconductivity in 2D FeSe/STO [12, 13], there are still opportunities to improve our understanding of the superconductivity of this material system. One pathway is to study the upper critical field, , a fundamental parameter of superconductivity, which represents the strength at which an externally applied magnetic field will break down the Cooper pairs of a superconductor.
Pair-breaking at is generally considered to have two origins: the polarization of the spins of the constituent electrons of Cooper pairs via Pauli paramagnetism, and the orbital effect when cores of Abrikosov vortices start to overlap. It is an essential parameter for understanding numerous superconducting properties of a material, including the coherence length, the dimensionality of superconductivity, and anisotropy. Systematic measurements of can also provide insight into pair-breaking mechanisms and their relative strengths. Due to its relatively low , bulk, single crystal FeSe has been an ideal subject for several high magnetic field measurements aimed at establishing the overall behavior and dependencies of in the limit of zero temperature and at various pressures and sample thicknesses [14, 15, 16, 17]. However, similarly rigorous studies of have been technically challenging in ultrathin films of FeSe grown on STO because the greatly enhanced values of are accompanied by extremely large values of [18]. To our knowledge, a detailed analysis of the temperature dependence of for FeSe/STO has not yet been reported. In this paper, we use high magnetic field ( T) magnetoresistance (MR) measurements to map out the variation of as a function of temperature and disorder in four ultrathin FeSe films grown by molecular beam epitaxy (MBE) on STO. Our observations provide important insights into the unique interfacial superconductivity in this material system.
II Experiment
To produce FeSe thin films capable of achieving high temperature superconductivity, 20 K, we first treated commercially obtained (Shinkosha) STO (001) substrates with a chemical etching process which included 45 minutes in deionized water at C and another 45 minutes in a 25% HCl solution at room temperature. Substrates were then annealed under a flow of oxygen in a tube furnace for 3 hours at 980∘C, rendering atomically flat, TiO2-terminated surfaces. Substrates were additionally outgassed in vacuo at 500∘C for 2 hours prior to growth.
We deposited the FeSe thin films using a Scienta Omicron EVO-50 MBE system, with a base pressure of 10-11 Torr, using high purity Fe (99.99%) and Se (99.999%) elemental sources simultaneously evaporated from thermal Knudsen effusion cells. We maintained the substrate temperature at roughly C, as measured by an infrared pyrometer, and used Fe and Se fluxes that yielded a deposition rate of roughly 1 layer every 6.5 minutes. This yielded films of around 3 unit cells (U.C.) thickness (1.65 nm) after a typical growth period of 20 minutes (Fig. 2). A post-growth anneal was performed at a substrate temperature between 525∘C and 550∘C for a duration varying between 2 to 3 hours. This annealing process is expected to induce Se vacancies, allowing for electron charge transfer into the film from the STO, and is a critical step in the realization of high temperature superconductivity in this system [19, 20]. We grew four samples, A, B, C, and D, with varying post-growth annealing conditions, yielding a large variation in . Prior to their removal from the UHV chamber, samples were capped with approximately 10 U.C.s (5-6 nm) of crystalline FeTe, grown at 350∘C for surface passivation, and 10 nm of amorphous Te deposited at room temperature for additional protection from oxidation; we find that this capping protocol provides consistent results when studying the superconducting properties of FeSe/STO films ex situ[10]. Grown on 5 x 5 mm2 pieces of STO held in place with clips of tantalum foil, the typical coverage of films in this study was around 10 mm2.
We then prepared samples for ex situ electrical transport measurements by mechanically etching six-terminal Hall bar patterns with effective areas of . Electrical contacts were formed with pressed indium dots. Samples were initially evaluated in a Quantum Design 14 T Physical Property Measurement System in order to identify candidate samples representing different levels of disorder. Finally, we measured field-dependent longitudinal resistivities and in pulsed magnetic fields up to 65 T applied in plane and out of plane, respectively. We focus on four particular samples (A, B, C, and D) of similar thickness but with widely varying zero resistance critical temperatures (Fig. 1).
Samples were mounted on a transport probe and loaded into a cryostat with a double-walled vacuum jacket, which in turn was immersed in a bath of liquid 4He. We achieved temperatures down to 500 mK by condensing 3He into the cryostat and subsequent pumping. The capacitor-driven 65 T pulsed magnet produced 80 ms pulses, with a rise time of 8 ms. Eddy currents induced by this rapidly changing magnetic field, or dB/dt, result in self-heating effects which can become non-negligible at very low temperatures. Thermal stability was maximized by measuring in liquid 4He for temperatures between 1.2 K and 4K. Additionally, only data gathered during the down-sweep of the magnetic field pulse, where the dB/dt was much smaller, was considered during our analysis.
After performing all other characterization, the samples were analyzed by annular dark-field scanning transmission electron microscopy (ADF-STEM) imaging. Samples were first prepared by depositing 15 nm of amorphous carbon in a Leica sputter coater, and then they were transferred into an FEI Scios 2 dual-beam scanning electron microscopy focused ion beam (SEM-FIB) for the creation of electron-transparent lamellae for STEM imaging. The lamellae were extracted from the regions that had previously been patterned for electrical transport measurements, and they were subsequently thinned to electron transparency using FIB accelerating voltages of 30 kV and 5 kV, with a final cleaning step at 2 kV. ADF-STEM imaging and energy-dispersive X-ray spectroscopy (EDX) elemental analysis were performed on a dual-spherical aberration-corrected FEI Titan3 G2 60-300 S/TEM at an accelerating voltage of 300 kV with a convergence angle of 25.2 mrad. Images were collected by a high-angle ADF detector with collection angles of 42-244 mrad.
III Results and Discussion
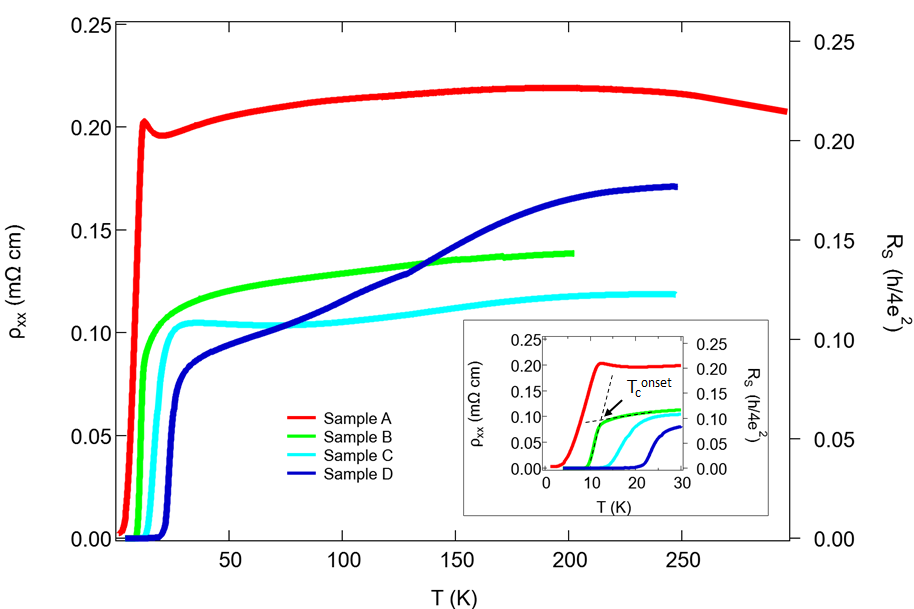
The temperature dependent resistivity for all 4 samples (A, B, C, D) is shown in Fig. 1. Samples A, B, and C show similar behavior in the normal state, where is almost independent of temperature before reaching the superconducting transition at their respective values of . The qualitative behavior of in sample D resembles the metallic behavior seen in bulk crystals of FeSe, monotonically decreasing with decreasing temperature, albeit with a smaller residual resistivity ratio (RRR) than observed in high quality bulk crystals [1, 2, 21]. Sample D exhibits the highest zero resistance critical temperature, as well as the highest RRR, indicating that it is the least disordered of the thin film samples we studied. These sample-specific parameters and others are outlined in Table 1.
It is interesting to note that sample A with the highest disorder shows a small increase in resistivity just before going superconducting. The increase in resistivity in the more disordered sample is consistent with emergent granularity. In the normal state, the grains or patches become locally superconducting but the different patches are not Josephson coupled. As the temperature is reduced, the Josephson coupling increases and the patches get coupled into a globally coherent state [22, 23, 24].
The onset superconducting critical temperature and normal state resistivity for each sample are determined from the intersections of two extrapolated lines. The first is drawn through the steepest portion of within the superconducting transition and the second through in the normal state just above the superconducting transition (Fig. 1 inset).
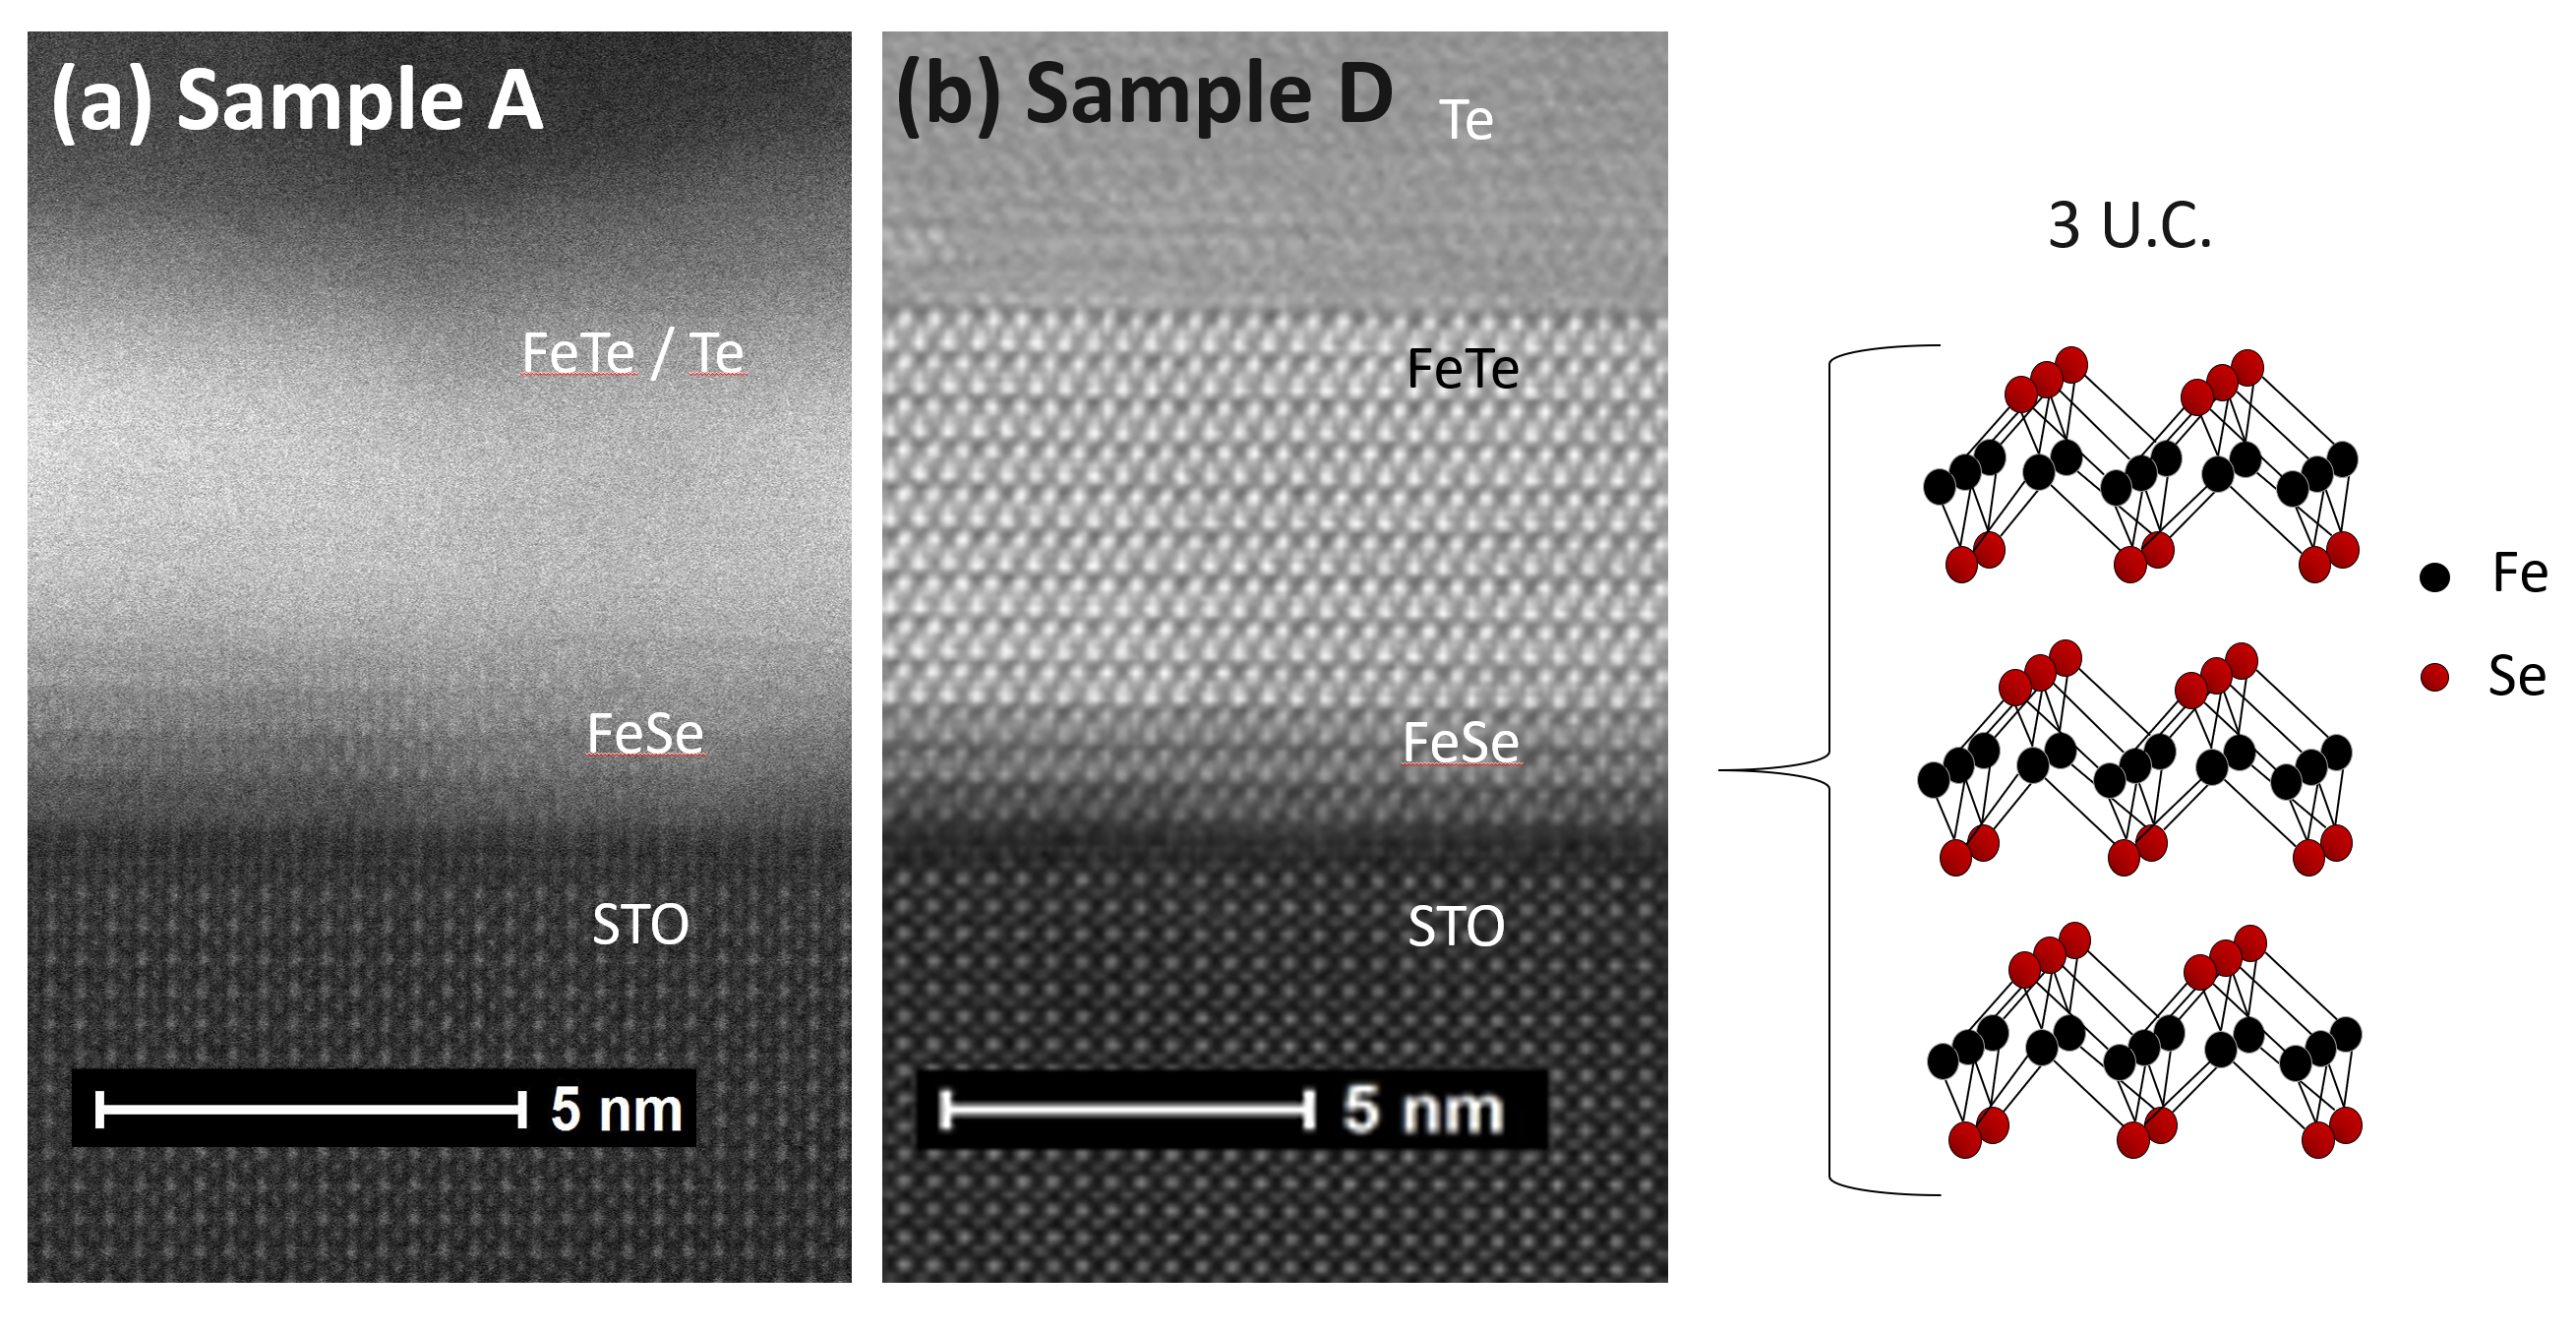
Since the four samples presented in this study were grown under similar growth conditions, we performed scanning transmission electron microscopy (STEM) measurements in an effort to understand the large variation in their superconducting critical temperatures from a microscopic point of view. The cross-sectional high-angle annular dark-field (HAADF) images in Fig. 2 compare samples A and D, the lowest and highest samples, respectively. Sample D shows the expected 3 U.C. FeSe (001) epitaxial layer, and clearly defined FeTe and Te capping layers. While the TEM measurements potentially indicate a greater level of disorder in sample A, we note that the lack of clarity in the image (Fig. 2(a)) most likely arises from some form of contamination (perhaps due to In contacts during sample preparation for TEM measurements); it cannot be directly associated with crystallographic disorder. We note that these STEM measurements were carried out on the actual sample used in high field measurements after the transport experiments were performed. More detailed STEM data for these samples and for sample B, C is available in the Supplementary Material [25].
| Sample | [K[ | [K] | [K] | RRR |
|---|---|---|---|---|
| A | 11.0 | 10.3 | 1.2 | 1.1 |
| B | 12.6 | 11.8 | 8.5 | 1.4 |
| C | 24.0 | 22.0 | 14.0 | 1.2 |
| D | 32.0 | 27.2 | 21.0 | 2.1 |
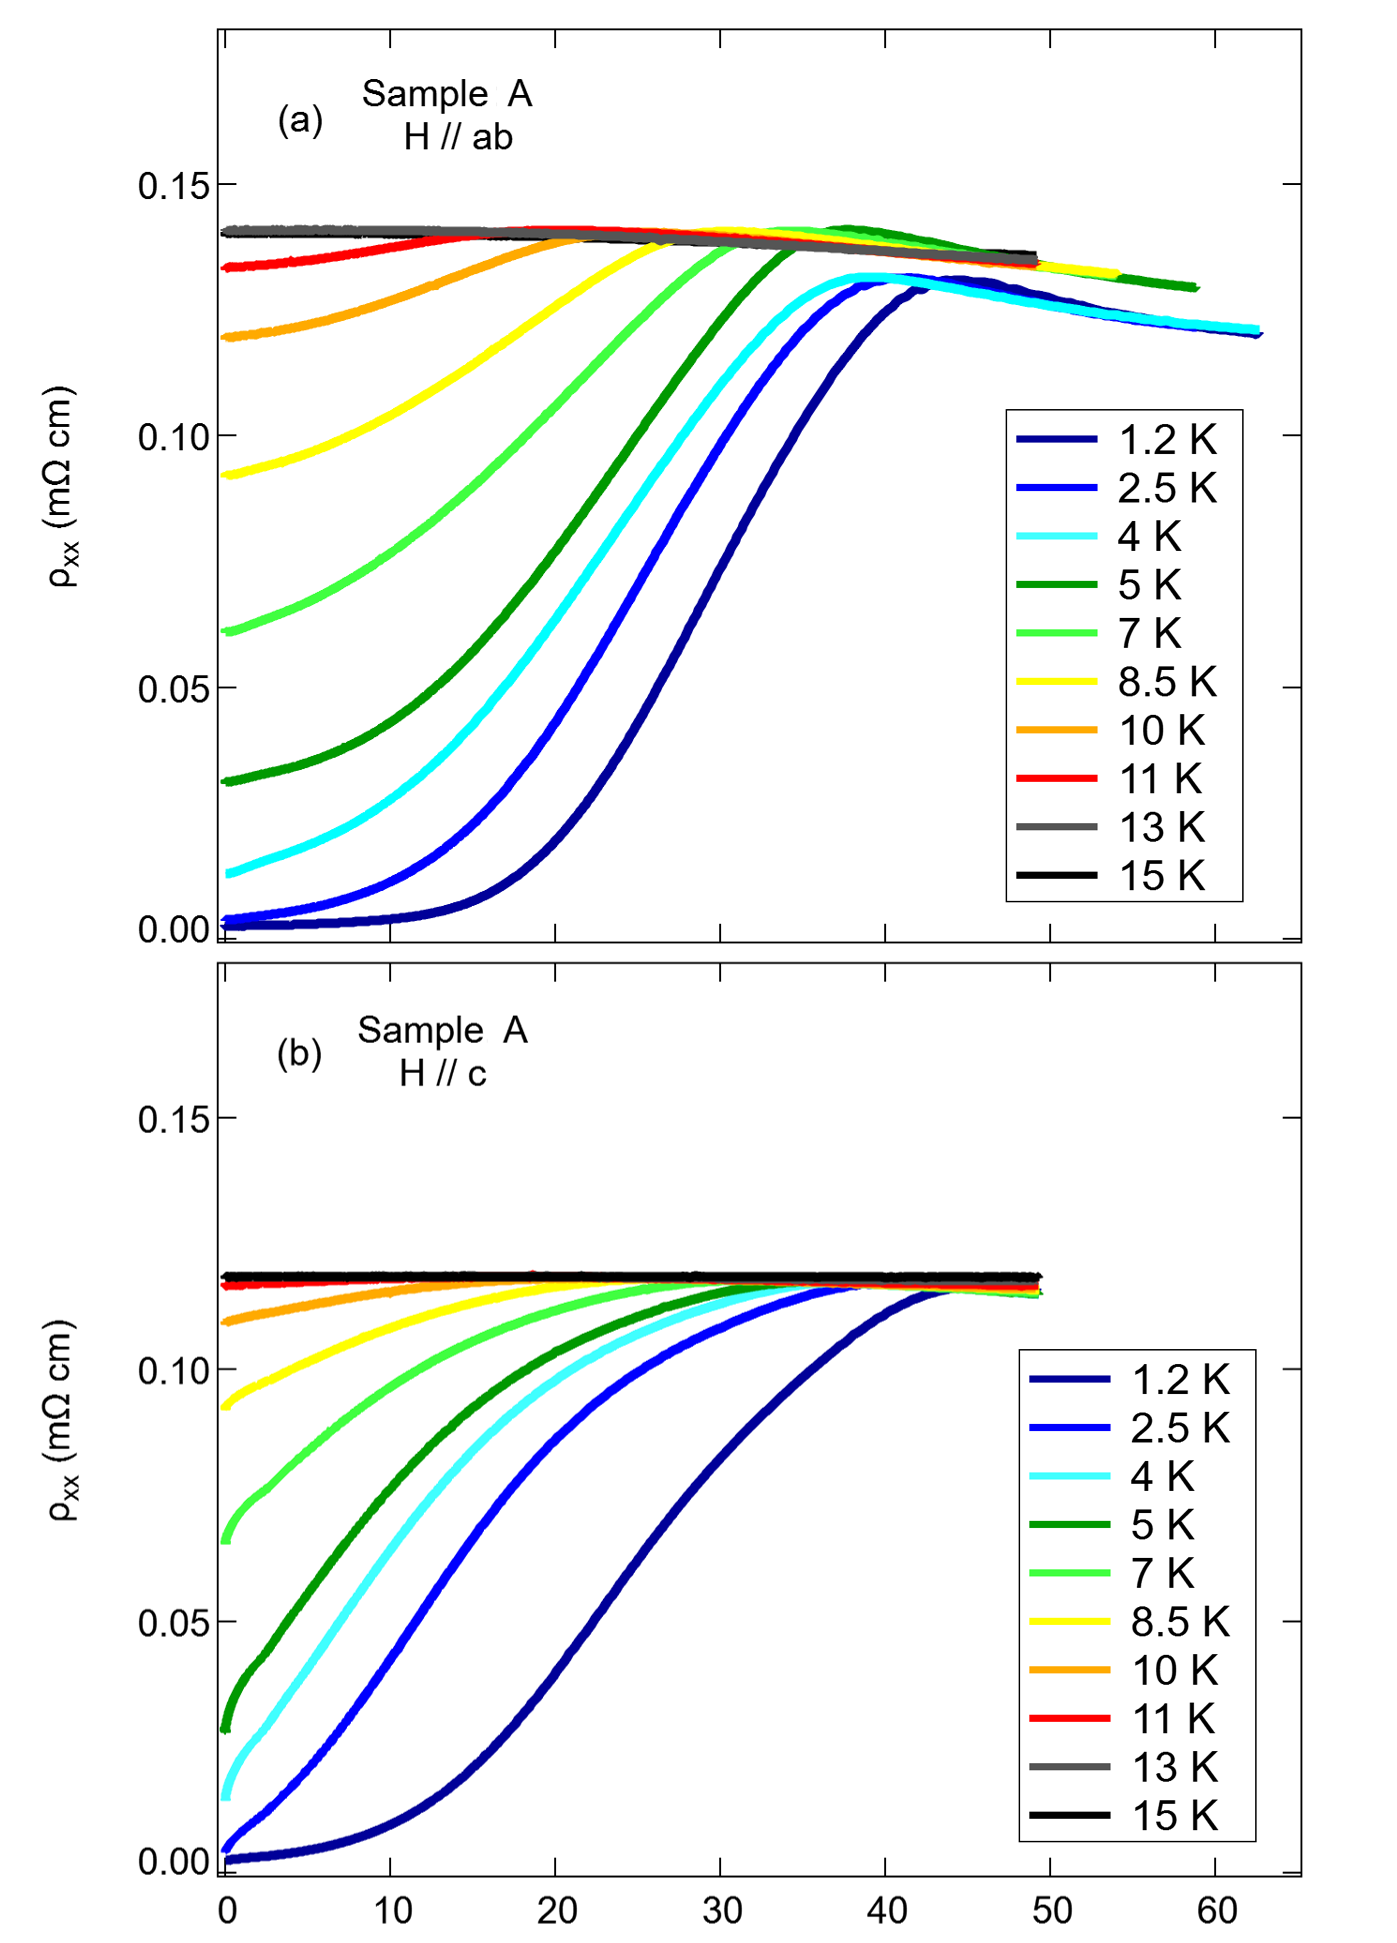
The results of MR measurements in pulsed high magnetic fields are shown in Fig. 3 for sample A in both and geometries. The temperature dependence of is extracted from these plots by identifying the abscissa corresponding to 10% (), 50% (), and 90% () of the normal state resistivity along each isotherm. These positions correspond to three separate but self-consistent definitions of . Similar data for samples B, C, and D are shown in the Supplementary Material [25].
For samples A and B (which have the lowest ), we can determine down to the 4He base temperature in both field orientations. For samples C and D (which have higher ), the available data in the geometry was restricted to temperatures near the superconducting transition because exceeds the available field strength (65 T). This observation is consistent with the fact that orbital-limiting effects in the configuration should be suppressed for such a highly anisotropic few-layer system where vortex formation is confined to a relatively small cross sectional area.
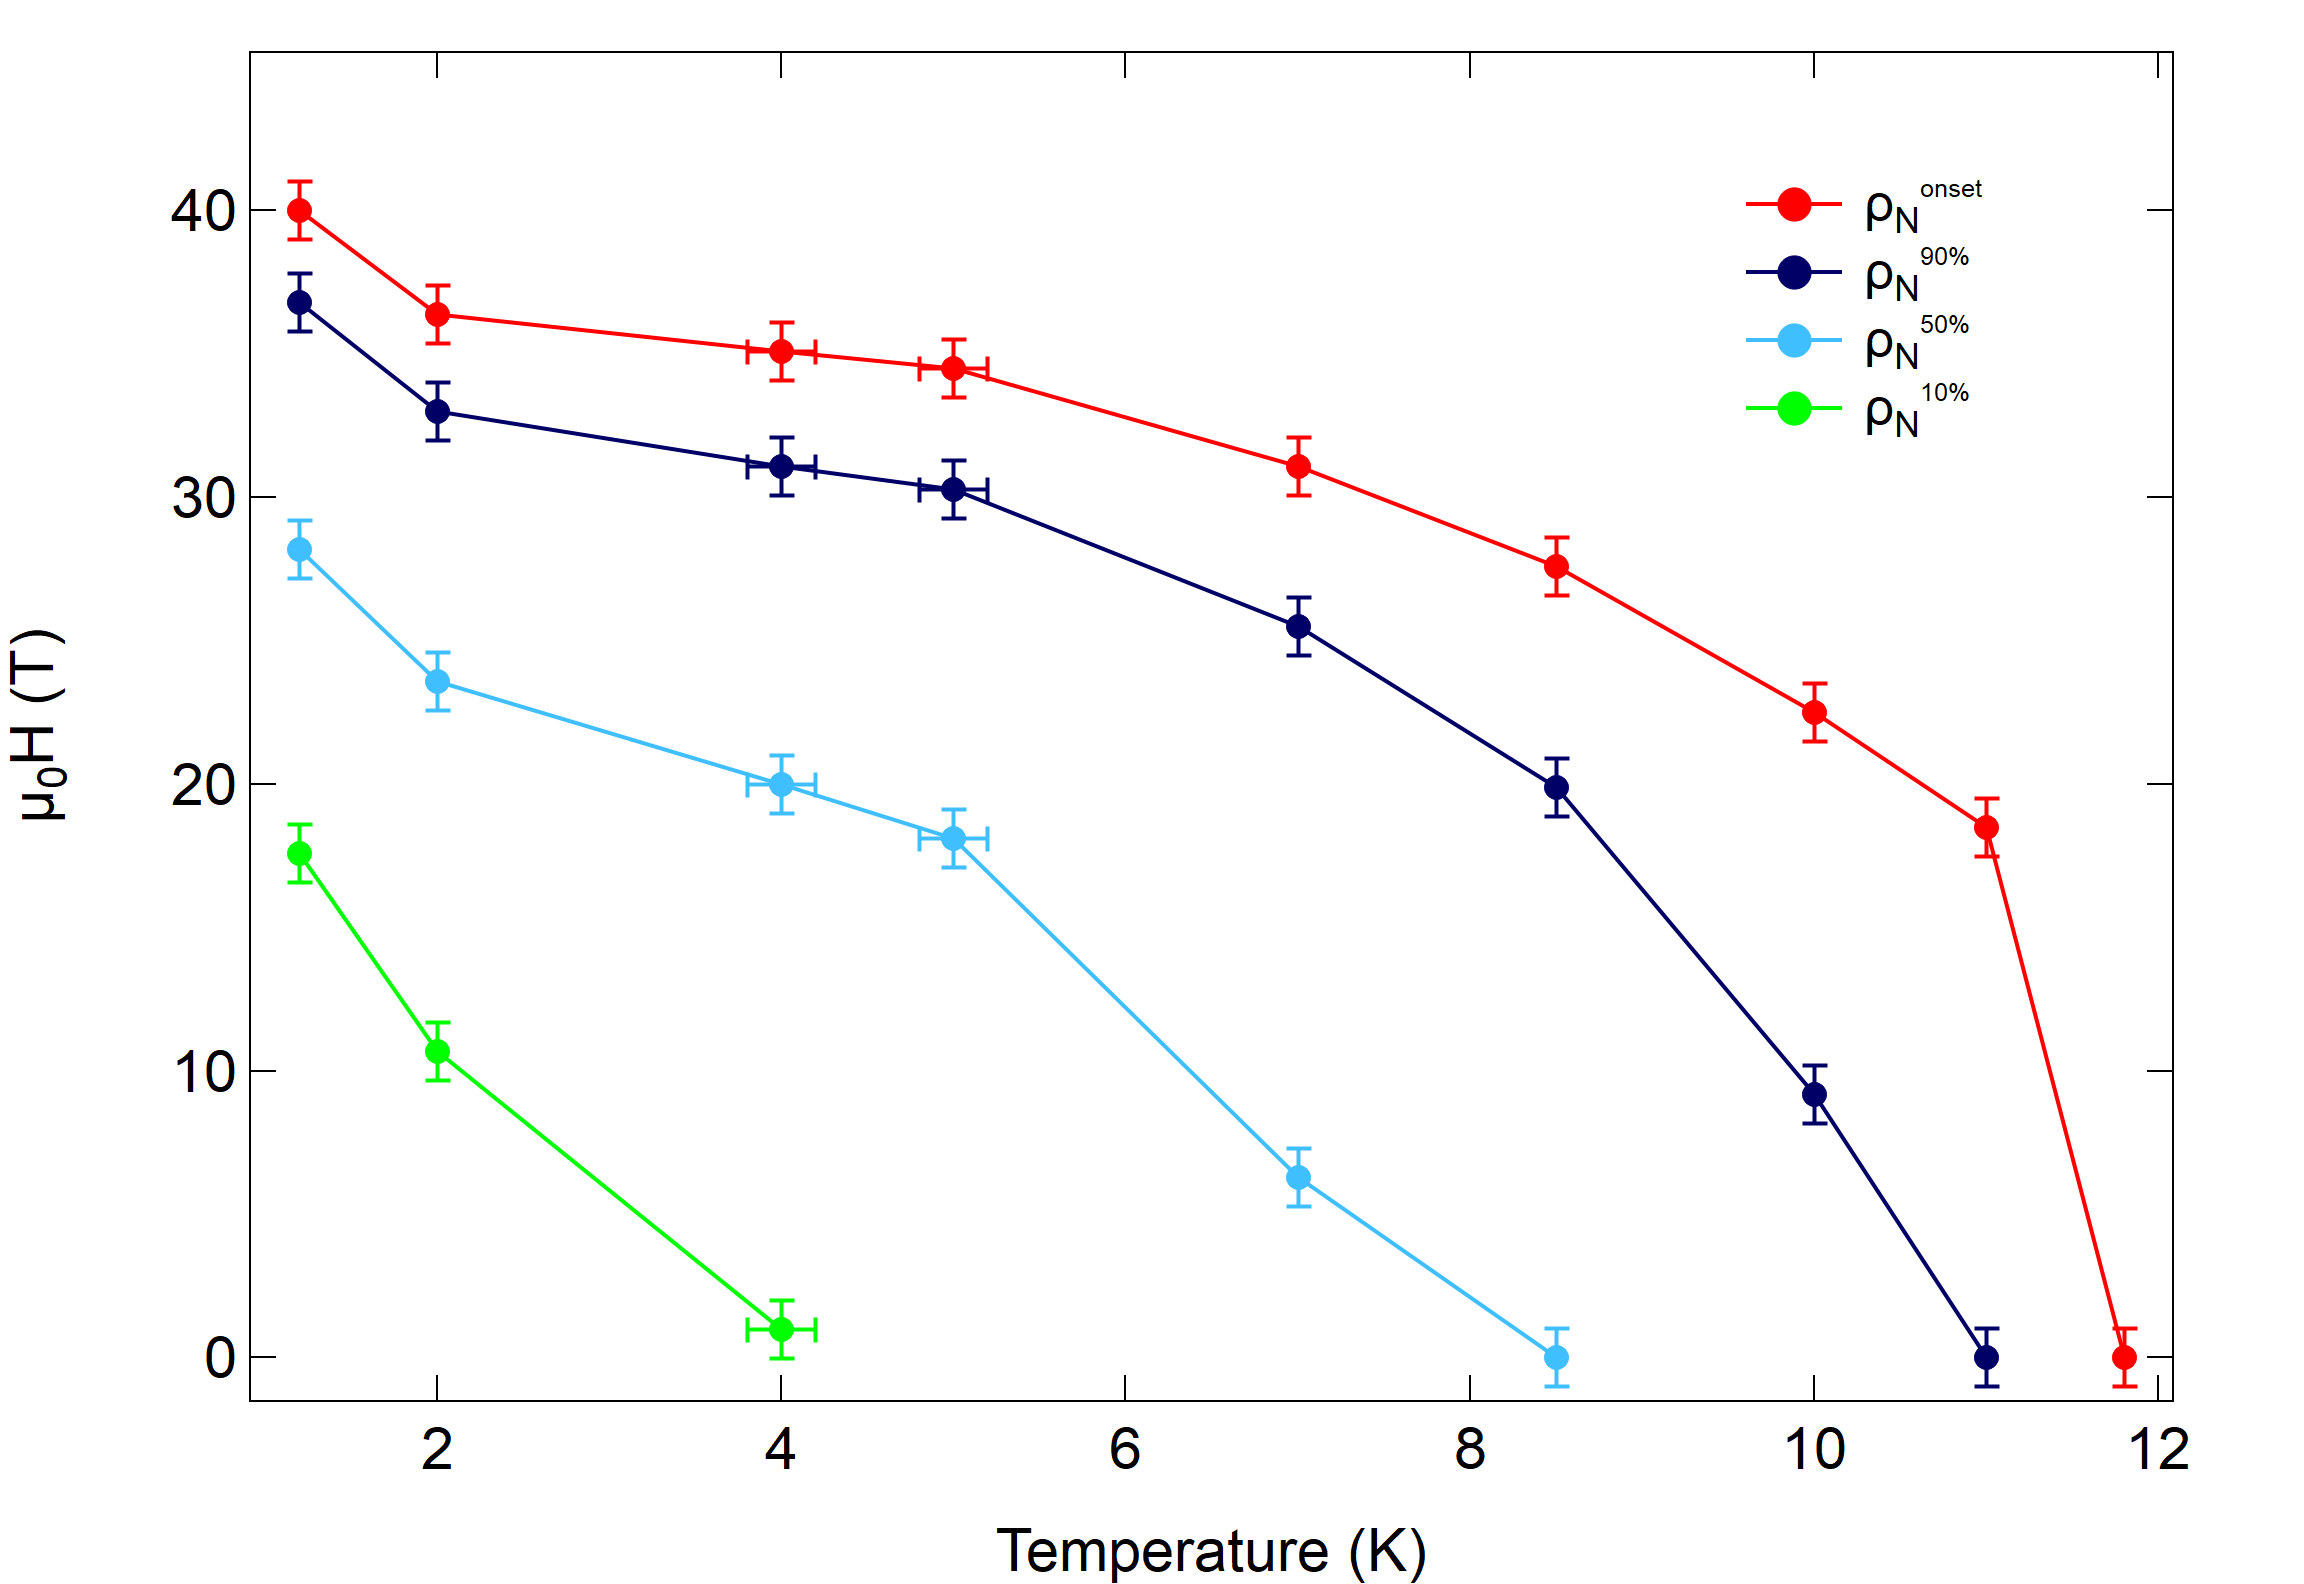
Measured temperatures, in general, were selected in order to comprehensively sample the superconducting and normal states, as well as the entire breadth of the superconducting transition region in each film. The resulting values of for sample A are compiled in Fig. 4 as an example. We found that the qualitative behavior of was not heavily dependent on the resistivity criteria used to define it, possibly indicating minimal field-induced broadening of the superconducting transition in these samples. We therefore proceed strictly with the criteria for defining due to the abundance of data points it provides, without loss of generality.
We analyze our data using Werthamer-Helfand-Hohenberg (WHH) theory which provides a prediction of the temperature dependence of for type-II superconductors, and can account for the effects of both orbital and paramagnetic limitation [26, 27, 28]. In the dirty limit, where the electron mean free path is much smaller than the superconducting coherence length , (T) is determined when the following condition is met [29]:
| (1) | ||||
Here, , is the complex digamma function, is the normalized temperature, is the reduced magnetic field, and the Maki parameter and spin-orbit coupling parameter are defined as:
| (2) | |||
Last, we define as another dimensionless representation of the upper critical magnetic field convenient for plotting.
Special cases of the upper critical field arise first in the absence of both Pauli paramagnetic limitation and spin-orbit interaction, when , where the entirely orbital-limited is determined to be [28]:
| (3) |
Second, if is instead entirely Pauli-limited, superconductivity is quenched when the Zeeman energy exceeds the superconducting condensation energy. In the case of a weakly-coupled BCS superconductor, this corresponds to the Chandrasekhar-Clogston limit [30, 31]:
| (4) |
This assumes that .
The Maki parameter (Eq. 2) describes the relative strengths of the Pauli paramagnetic effect and the orbital limiting field when these two mechanisms have comparable effects in the pair-breaking process [32]. In this case, it can be written as . Experimentally, the Maki parameter can be interpreted from the slope of in the vicinity of using this relation and Eqns. 3 and 4:
| (5) |
We numerically solve Eq. 1 using and as fitting parameters for the experimental and data of each sample. The numerical results are summarized in Table 2 along with the values from theoretical predictions. The magnitude of the spin-orbit coupling parameter, , is indicative of the spin-flip scattering strength in the sample, and a non-zero value of incorporated into the WHH model enhances the predicted values of , especially in the zero temperature limit. Physically, this corresponds to a suppression of the Pauli paramagnetic effect through a reduction of the Zeeman energy.
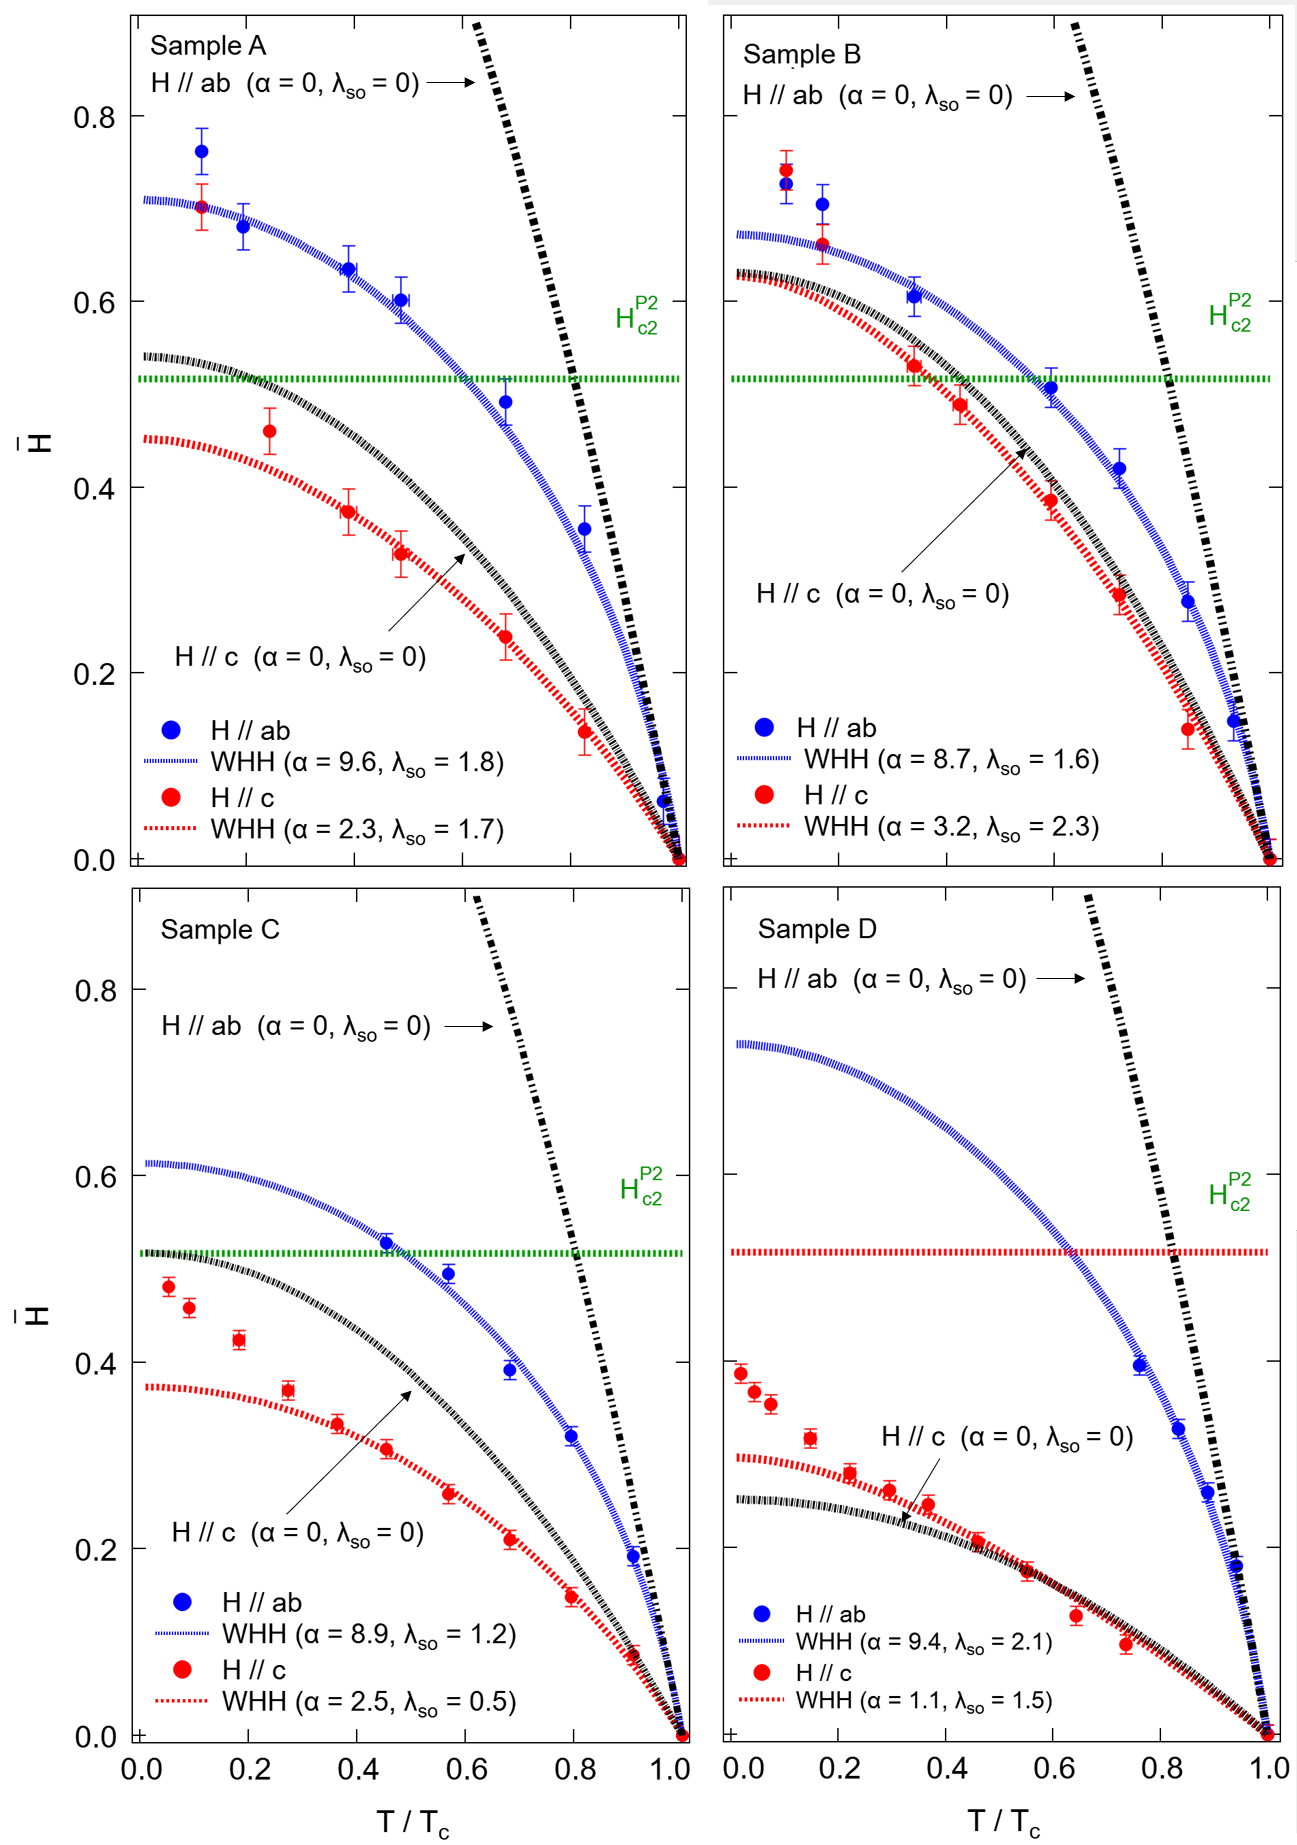
We now discuss the WHH fits of the temperature dependence of the upper critical field for all four samples (Fig. 5). Here, we assume [33]. Each plot includes additional WHH curves constructed using the non-zero Maki parameter calculated while fitting experimental data but without the contribution of spin-orbit scattering to highlight the necessity of a non-zero . Additionally, for sample A, we have calculated five WHH curves with from 1 to 5 and (see Supplementary Material [25]). All these plots reveal a clear necessity for including a non-zero in order to accurately fit the experimental data for both the parallel and perpendicular field geometries, reflecting the significant role of spin-orbit coupling in FeSe [16, 34].
In the geometry, we observe very large Maki parameters in all four samples. Physically, this suggests weak orbital limitation, and conversely, stronger Pauli-limiting effects in this configuration. This result is consistent with the picture of vortex formation and flow being hindered by the relatively small cross-sectional area of the 1.5 nm thick films during the superconducting-normal state transition. The fits in Fig. 5 (a)-(d) also show a large deviation between the WHH fit of the data and the theoretical fully-orbital-limited curves (), especially towards zero temperature, as another indication of weak orbital-limiting effects. Finally, to this point, we note that the extracted Maki parameters are greater than those calculated under the assumption of comparable limiting mechanisms (Table 2) by nearly a factor of two for each sample. This further suggests the significance of Pauli-limiting effects here.
The values of the Maki and spin-orbit scattering parameters derived from our WHH analysis are larger than observed in single crystal FeSe samples. Reported values in bulk FeSe crystals include () and () [16], and () [35], both without contribution from a non-zero . In thin flakes of FeSe, values of and have been observed for sample thicknesses of nm, and nm, respectively [17]. Complete descriptions of the data in this case of thin flakes required . Results obtained from the work presented here ( for H ab and for H c) on nm thin films of FeSe are consistent with a trend of increased Maki parameters, as well as the inclusion of spin-orbit scattering into the WHH model to effectively describe the data, in the 2D limit.
| Sample | |||||||
|---|---|---|---|---|---|---|---|
| A | 9.6, 2.3 | 1.8, 1.7 | 34.2 T | 21.8 T | 71.1 T | 26.1 T | 19.2 T |
| B | 8.7, 3.2 | 1.6, 2.3 | 37.1 T | 34.6 T | 83.5 T | 34.8 T | 21.9 T |
| C | 8.9, 2.5 | 1.2, 0.5 | 63.1 T | 38.5 T | 150.3 T | 67.6 T | 40.9 T |
| D | 9.4, 1.1 | 2.1, 1.5 | 94.2 T | 37.2 T | 204.9 T | 32.1 T | 50.6 T |
When the magnetic field is aligned perpendicular to the plane of the film, orbital effects are expected to play a more significant role, and this is demonstrated in part by the WHH fits of the H c data in Fig. 5 (a-d). At higher temperatures, closer towards , there is a clear reduction in the values of compared to those from the H ab measurements at comparable temperatures. Additionally, the calculated fit for samples A and B closely follow the purely orbital-limited curves (). We also observe a clear deviation from the prediction of WHH as increases almost linearly, upwards, in the limit of zero temperature in all four samples. Such upward curvature have been demonstrated in the ’1111’ [36, 37] and ’122’ [38, 39] systems, and has been discussed for the stoichiometric ’11’ Fe(Te,Se) system as well [40, 41]. This deviation from the single-band WHH theory is typically recognized as an effect of multi-band superconductivity [42].
In samples A and B, the low temperature behavior of exhibits a slight upward curvature which deviates from the WHH prediction, even with the inclusion of a non-zero . Distinct high-field induced superconducting phases at low temperatures in single crystal FeSe samples have been reported [43] and have been attributed to a possible unconventional Fulde-Ferrell-Larkin-Ovchinnikov (FFLO) state, even in the presence of disorder [44]. The FFLO state features spatial modulation of the superconducting order parameter and Cooper pairs of finite total momentum , compared to the conventional zero-momentum pairing . At high fields, Zeeman splitting plays a more significant role in quenching the superconducting phase, so a prerequisite for realization of the FFLO state is a large (greater than one) Maki parameter, indicating a smaller paramagnetically-limited field by the relation. This is indeed a feature in all four samples measured here. However, extremely large field strengths, much higher than 65 T, would be required to sufficiently survey the low temperature regime of higher- samples, such as C and D, for a more complete investigation of this unique state in the FeSe/STO system.
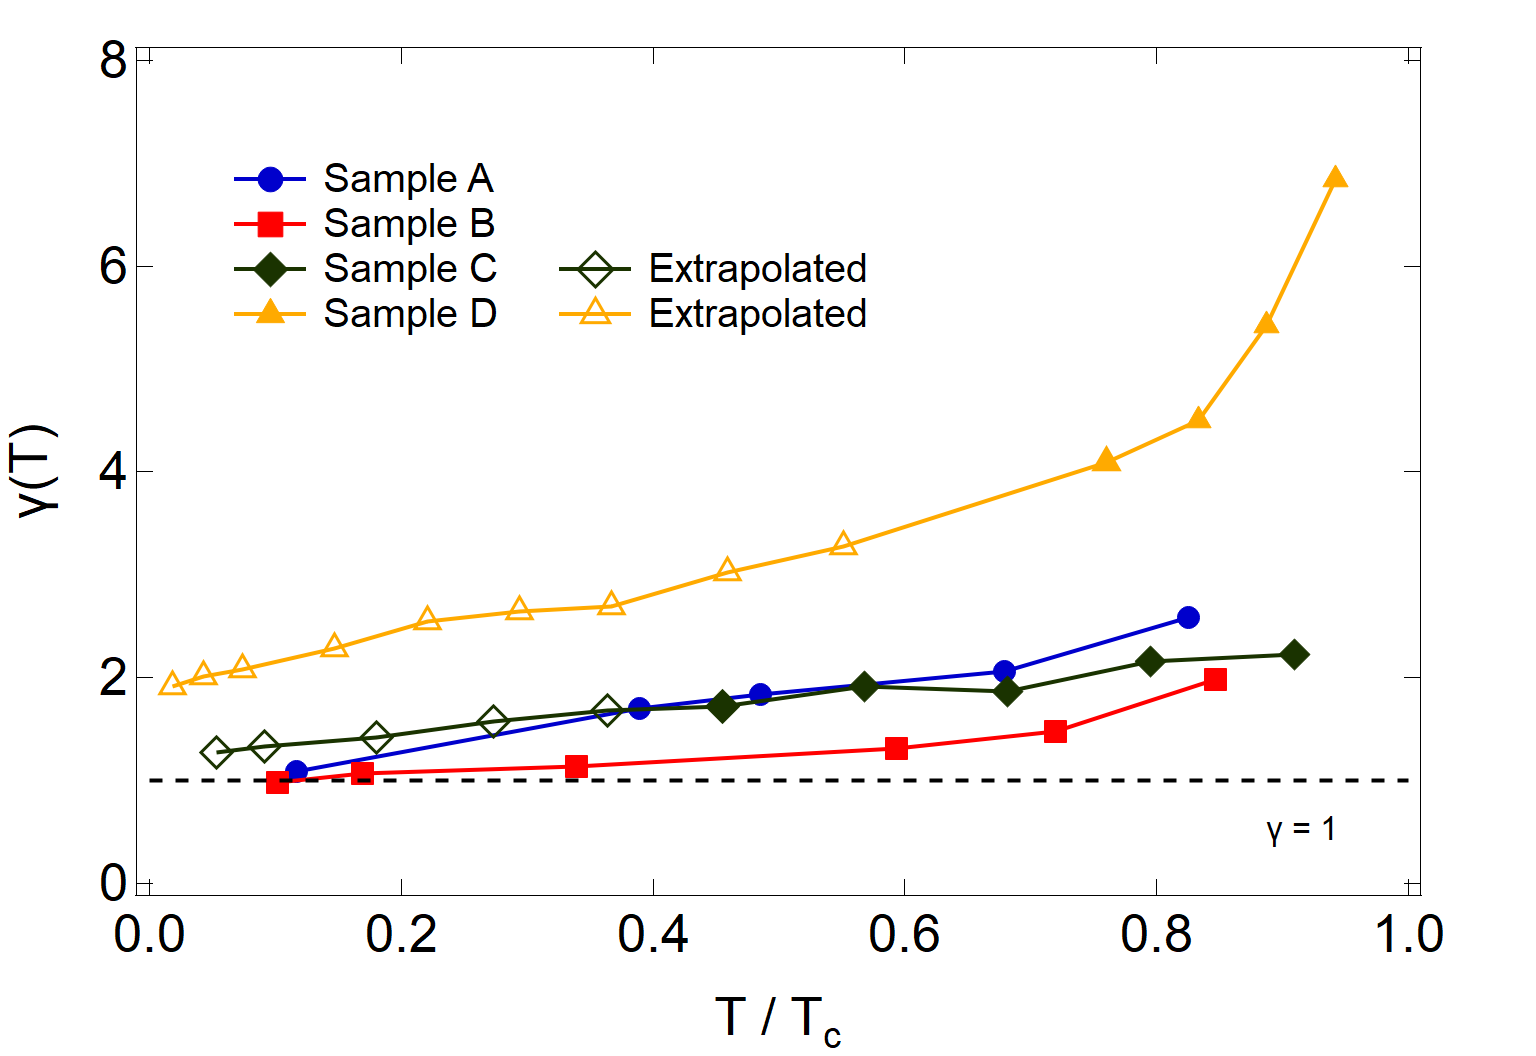
Next, we address the overall temperature dependence of the upper critical field anisotropy, quantified by the anisotropy parameter . This is shown in Fig. 6 and qualitatively agrees with that of other Fe-based superconductors, including single crystal FeSe [15]. In the limit of zero temperature, nearly isotropic superconductivity in other Fe-based superconducting systems, such as the ‘11’ and ‘122’ classes of materials, is commonly observed despite the quasi-2D nature of their electronic structures [45]. In the ultrathin limit, a significant increase in could rightfully be expected as the superconductivity further inherits the anisotropic character of the increasingly two-dimensional Fermi surface, but this behavior only seems to be observed in the neighborhood of the superconducting critical temperature [17]. Our four samples demonstrate varying degrees of enhanced anisotropy closer to their respective values of , ranging from , as well as a monotonic decrease towards in the limit of zero temperature (Fig. 6). Overall, the orbital constraints on superconductivity in FeSe likely describe the larger anisotropy as the temperature approaches : in this regime, the Maki parameter, and therefore the slope of , is larger in the direction. In contrast, the approach to isotropic behavior of at lower temperatures can be attributed to the dominance of the Pauli-paramagnetic limit, so that is not affected by orientation of the field.
Finally, we estimate the value of the zero-temperature coherence length, from the extracted data using the 2D Ginzburg-Landau formula where Wb is the superconducting magnetic flux quantum [46]. Fitting this equation to the data in the vicinity of , we find that 3.2 nm, 3.5 nm, 3.3 nm, and 4.8 nm for samples A, B, C, and D, respectively.
IV Conclusion
In summary, we have studied the superconducting transition of four MBE-grown FeSe/STO thin films of varying disorder by determining their resistive upper critical fields using high magnetic field pulses up to 65 T applied in both parallel () and perpendicular () directions. The experimental behavior of , defined by the criterion, is in close agreement with WHH theory down to when the effects of both orbital and Pauli paramagnetic limits are considered. Although our TEM measurements broadly show a correlation between structural disorder and , the parameters extracted from the WHH fits are surprisingly insensitive to both the level of disorder and . Prior HRTEM studies of the FeSe/STO interfacial structure have indicated that is possibly determined by the reconstruction of the FeSe Fermi surface resulting from excess Ti in a quasi-2D Ti1-xO2 interfacial layer [47]. This has not been carefully examined in our samples and warrants further microscopy studies. Low temperature deviations of the data from the theory are observed in each sample and may result from the effects of multi-band superconductivity. Similar deviations below in the of samples A and B may indicate a separate high-field superconducting phase akin to the FFLO state. This warrants further investigation of higher samples, such as samples C and D, in fields with strengths exceeding 65 T to effectively study their detailed behavior in a low temperature regime. In future work we will further explore the combined role of spin-orbit coupling and disorder in a multiband superconductor such as FeSe.
Acknowledgements.
This work was supported by the Penn State 2DCC-MIP under NSF Grant No. DMR-2039351. Work at the National High Magnetic Field Lab was supported by NSF DMR-1644779, the State of Florida, and the U.S. Department of Energy and the research at Ohio State was supported by NSF Grant No. DMR2138905.References
- Hsu et al. [2008] F.-C. Hsu, J.-Y. Luo, K.-W. Yeh, T.-K. Chen, T.-W. Huang, P. M. Wu, Y.-C. Lee, Y.-L. Huang, Y.-Y. Chu, D.-C. Yan, and M.-K. Wu, PNAS 105, 14262 (2008).
- Mizuguchi et al. [2008] Y. Mizuguchi, F. Tomioka, S. Tsuda, T. Yamaguchi, and Y. Takano, Appl. Phys. Lett. 93, 152505 (2008).
- Wang et al. [2012] Q. Y. Wang, Z. Li, W. H. Zhang, Z. C. Zhang, J. S. Zhang, W. Li, H. Ding, Y. B. Ou, P. Deng, K. Chang, J. Wen, C. L. Song, K. He, J. F. Jia, S. H. Ji, Y. Y. Wang, L. L. Wang, X. Chen, X. C. Ma, and Q. K. Xue, Chin. Phys. Lett. 29, 037402 (2012).
- He et al. [2013] S. He, J. He, W. Zhang, L. Zhao, D. Liu, X. Liu, D. Mou, Y. B. Ou, Q. Y. Wang, Z. Li, L. Wang, Y. Peng, Y. Liu, C. Chen, L. Yu, G. Liu, X. Dong, J. Zhang, C. Chen, Z. Xu, X. Chen, X. Ma, Q. Xue, and X. J. Zhou, Nat. Mater. 12, 605 (2013).
- Zhang et al. [2014a] W. H. Zhang, Y. Sun, J. S. Zhang, F. S. Li, M. H. Guo, Y. F. Zhao, H. M. Zhang, J. P. Peng, Y. Xing, H. C. Wang, T. Fujita, A. Hirata, Z. Li, H. Ding, C. J. Tang, M. Wang, Q. Y. Wang, K. He, S. H. Ji, X. Chen, J. F. Wang, Z. C. Xia, L. Li, Y. Y. Wang, J. Wang, L. L. Wang, M. W. Chen, Q. K. Xue, and X. C. Ma, Chin. Phys. Lett. 31, 017401 (2014a).
- Liu et al. [2012] D. Liu, W. Zhang, D. Mou, J. He, Y. B. Ou, Q. Y. Wang, Z. Li, L. Wang, L. Zhao, S. He, Y. Peng, X. Liu, C. Chen, L. Yu, G. Liu, X. Dong, J. Zhang, C. Chen, Z. Xu, J. Hu, X. Chen, X. Ma, Q. Xue, and X. J. Zhou, Nat. Commun. 3, 931 (2012).
- Lee et al. [2014] J. J. Lee, F. T. Schmitt, R. G. Moore, S. Johnston, Y. T. Cui, W. Li, M. Yi, Z. K. Liu, M. Hashimoto, Y. Zhang, D. H. Lu, T. P. Devereaux, D. H. Lee, and Z. X. Shen, Nature (London) 515, 245 (2014).
- Tan et al. [2013] S. Tan, Y. Zhang, M. Xia, Z. Ye, F. Chen, X. Xie, R. Peng, D. Xu, Q. Fan, H. Xu, J. Jiang, T. Zhang, X. Lai, T. Xiang, J. Hu, B. Xie, and D. Feng, Nat. Mater. 12, 634 (2013).
- Faeth et al. [2021] B. D. Faeth, S.-L. Yang, J. K. Kawasaki, J. N. Nelson, P. Mishra, C. T. Parzyck, C. Li, D. G. Schlom, and K. M. Shen, Phys. Rev. X 11, 021054 (2021).
- Li et al. [2021] Y. Li, Z. Wang, R. Xiao, Q. Li, K. Wang, A. Richardella, J. Wang, and N. Samarth, Phys. Rev. Mater. 5, 034802 (2021).
- Ide et al. [2022] K. Ide, T. Tanaka, A. Pedersen, S. Ichinokura, and T. Hirahara, Phys. Rev. Mater. 6, 124801 (2022).
- Huang and Hoffman [2017] D. Huang and J. E. Hoffman, Annual Review of Condensed Matter Physics 8, 311 (2017).
- Kreisel et al. [2020] A. Kreisel, P. Hirschfeld, and B. Andersen, Symmetry 12, 1402 (2020).
- Lei et al. [2012] H. Lei, D. Graf, R. Hu, H. Ryu, E. S. Choi, S. W. Tozer, and C. Petrovic, Phys. Rev. B 85, 094515 (2012).
- Vedeneev et al. [2013] S. I. Vedeneev, B. A. Piot, D. K. Maude, and A. V. Sadakov, Phys. Rev. B 87, 134512 (2013).
- Kang et al. [2016] J. H. Kang, S. G. Jung, S. Lee, E. Park, J. Y. Lin, D. A. Chareev, A. N. Vasiliev, and T. Park, Superconductor Science and Technology 29 (2016).
- Farrar et al. [2020] L. S. Farrar, M. Bristow, A. A. Haghighirad, A. McCollam, S. J. Bending, and A. I. Coldea, npj Quantum Mater. 5, 29 (2020).
- Zhou et al. [2016] G. Zhou, D. Zhang, C. Liu, C. Tang, X. Wang, Z. Li, C. Song, S. Ji, K. He, L. Wang, X. Ma, and Q. K. Xue, Appl. Phys. Lett. 108, 202603 (2016).
- Zhang et al. [2014b] W. Zhang, Z. Li, F. Li, H. Zhang, J. Peng, C. Tang, Q. Wang, K. He, X. Chen, L. Wang, X. Ma, and Q. K. Xue, Phys. Rev. B 89, 060506(R) (2014b).
- Berlijn et al. [2014] T. Berlijn, H. P. Cheng, P. J. Hirschfeld, and W. Ku, Phys. Rev. B 89, 020501 (2014).
- Böhmer et al. [2016] A. E. Böhmer, V. Taufour, W. E. Straszheim, T. Wolf, and P. C. Canfield, Phys. Rev. B 94, 024526 (2016).
- Ghosal et al. [2001] A. Ghosal, M. Randeria, and N. Trivedi, Phys. Rev. B 65, 014501 (2001).
- Ghosal et al. [1998] A. Ghosal, M. Randeria, and N. Trivedi, Phys. Rev. Lett. 81, 3940 (1998).
- Bouadim et al. [2011] K. Bouadim, Y. L. Loh, M. Randeria, and N. Trivedi, Nature Physics 7, 884 (2011).
- [25] See Supplemental Material at [URL will be inserted by publisher] for additional HRTEM and MR data.
- Helfand and Werthamer [1964] E. Helfand and N. R. Werthamer, Phys. Rev. Lett. 13, 686 (1964).
- Helfand and Werthamer [1966] E. Helfand and N. R. Werthamer, Phys. Rev. 147, 288 (1966).
- Werthamer et al. [1966] N. R. Werthamer, E. Helfand, and P. C. Hohenberg, Phys. Rev. 147, 295 (1966).
- Solenov et al. [2017] D. Solenov, M. Nikolo, J. Singleton, J. Jiang, J. Weiss, and E. Hellstrom (2017) p. 060004.
- Chandrasekhar [1962] B. S. Chandrasekhar, Appl. Phys. Lett. 1, 7 (1962).
- Clogston [1962] A. M. Clogston, Phys. Rev. Lett. 9, 266 (1962).
- Maki [1966] K. Maki, Phys. Rev. 148, 362 (1966).
- Li et al. [2014] B. Li, Z. W. Xing, G. Q. Huang, and D. Y. Xing, J. Appl. Phys. 115, 193907 (2014).
- Ma et al. [2017] M. Ma, P. Bourges, Y. Sidis, Y. Xu, S. Li, B. Hu, J. Li, F. Wang, and Y. Li, Phys. Rev. X 7, 021025 (2017).
- Audouard et al. [2015] A. Audouard, F. Duc, L. Drigo, P. Toulemonde, S. Karlsson, P. Strobel, and A. Sulpice, EPL 109, 27003 (2015).
- Hunte et al. [2008] F. Hunte, J. Jaroszynski, A. Gurevich, D. C. Larbalestier, R. Jin, A. S. Sefat, M. A. McGuire, B. C. Sales, D. K. Christen, and D. Mandrus, Nature (London) 453, 903 (2008).
- Jaroszynski et al. [2008] J. Jaroszynski, F. Hunte, L. Balicas, Y. J. Jo, I. Raičević, A. Gurevich, D. C. Larbalestier, F. F. Balakirev, L. Fang, P. Cheng, Y. Jia, and H. H. Wen, Phys. Rev. B 78, 174523 (2008).
- Baily et al. [2009] S. A. Baily, Y. Kohama, H. Hiramatsu, B. Maiorov, F. F. Balakirev, M. Hirano, and H. Hosono, Phys. Rev. Lett. 102, 117004 (2009).
- Yuan et al. [2009] H. Q. Yuan, J. Singleton, F. F. Balakirev, S. A. Baily, G. F. Chen, J. L. Luo, and N. L. Wang, Nature (London) 457, 565 (2009).
- Fang et al. [2010] M. Fang, J. Yang, F. F. Balakirev, Y. Kohama, J. Singleton, B. Qian, Z. Q. Mao, H. Wang, and H. Q. Yuan, Phys. Rev. B 81, 020509(R) (2010).
- Khim et al. [2010] S. Khim, J. W. Kim, E. S. Choi, Y. Bang, M. Nohara, H. Takagi, and K. H. Kim, Phys. Rev. B 81, 184511 (2010).
- Gurevich [2003] A. Gurevich, Phys. Rev. B 67, 184515 (2003).
- Kasahara et al. [2014] S. Kasahara, T. Watashige, T. Hanaguri, Y. Kohsaka, T. Yamashita, Y. Shimoyama, Y. Mizukami, R. Endo, H. Ikeda, K. Aoyama, T. Terashima, S. Uji, T. Wolf, H. V. Löhneysen, T. Shibauchi, and Y. Matsuda, PNAS 111, 16309 (2014).
- Zhou et al. [2021] N. Zhou, Y. Sun, C. Y. Xi, Z. S. Wang, J. L. Zhang, Y. Zhang, Y. F. Zhang, C. Q. Xu, Y. Q. Pan, J. J. Feng, Y. Meng, X. L. Yi, L. Pi, T. Tamegai, X. Xing, and Z. Shi, Phys. Rev. B 104, L140504 (2021).
- Zhang et al. [2011] J. L. Zhang, L. Jiao, Y. Chen, and H. Q. Yuan, Front. Phys. 6, 463 (2011).
- Saito et al. [2015] Y. Saito, Y. Kasahara, J. Ye, Y. Iwasa, and T. Nojima, Science 350, 409 (2015).
- Sims et al. [2019] H. Sims, D. N. Leonard, A. Y. Birenbaum, Z. Ge, T. Berlijn, L. Li, V. R. Cooper, M. F. Chisholm, and S. T. Pantelides, Phys. Rev. B 100, 144103 (2019).