Temporal features of LS I +61∘303 in hard X-rays from the /BAT survey data
Abstract
We study the long-term spectral and timing behaviour of LS I +61∘303 in hard X-rays (15–150 keV) using 10 years of survey data from the Burst Alert Telescope (BAT) monitor. We focus on the detection of long periodicities known to be present in this source in multiple wavelengths. We clearly detect three periods: the shorter one at 26.48 days is compatible with the orbital period of the system; the second, longer, periodicity at 26.93 days, is detected for the first time in X-rays and its value is consistent with an analogous temporal feature recently detected in the radio and in the gamma-ray waveband, and we associate it with a modulation caused by a precessing jet in this system. Finally, we find also evidence of the long-term periodicity at 1667 d, that results compatible with a beat frequency of the two close, and shorter, periodicities. We discuss our results in the context of the multi-band behaviour of the physical processes of this source.
keywords:
X-rays: binaries – X-rays: individual: LS I +61∘303. Facility: Swift1 Introduction
LS I +61∘303 is an accreting binary system well-known for exhibiting an exceptional broadband spectrum from radio to TeV energies (Albert et al. 2008). The system consists of a main sequence star of type B0 Ve (Hutchings & Crampton 1981), with an estimated mass 10–15 M⊙, and a compact object (it is still debated if a black-hole or a neutron star) orbiting with a period = 26.4960 0.0028 d in a highly eccentric orbit ( = 0.537 0.034), at a distance from us of 2 kpc (Aragona et al. 2009).
The system is characterized by different long periodicities: the shortest one is associated with the above-mentioned orbital period and it is detected in all bands of the electromagnetic spectrum, from radio, where it was first noticed (Taylor & Gregory 1982) up to -rays (Abdo et al. 2009). The longest periodicity, also first noted in the radio band (Gregory et al. 1999), is clearly super-orbital at a period 4.6 years (Pso), and because of the larger time-span required to detect it, it has been only recently detected at higher frequencies (see Li et al. 2014, and reference therein). In the X-ray band, the modulation appears phase shifted of 0.2 with respect to the radio one (Li et al. 2012). In between there is a periodicity very close to the known orbital period at = 26.99 0.08 d, that has been more recently observed only in the radio and in the -ray bands (Massi & Jaron 2013; Jaron & Massi 2014) and, finally, a periodicity that appears as an averaged value between and at = 26.704 0.004, that has been exclusively attributed to the radio outburst recurrence time (Ray et al. 1997; Jaron & Massi 2013).
According to Massi & Torricelli-Ciamponi (2014) is caused by a precession of a conical jet, as also revealed by the periodic change of the associated extended radio structure (Massi et al. 2012), while the is the result of the beat between the two shorter periods, and (Massi & Jaron 2013): namely, its value (within the statistical uncertainties) results compatible with this hypothesis ( = ( – )-1). Other authors suggest instead a possible connection with the time-scales of the Be stellar activity (Ackermann et al. 2013), or the precession of the Be companion star’s decretion disk (Lipunov & Nazin 1994).
In this paper, we exploit the continuous hard X-ray coverage of this source made in the last 10 years by the /BAT monitor, to assess the presence and the spectral characteristics of these periodicities in the hard X-ray band.
2 Data reduction and analysis
We retrieved the survey data for LS I +61∘303 collected with /BAT between 2004 December 09 (MJD 53348) and 2015 March 10 (MJD 56827) from the HEASARC public archive111http://heasarc.gsfc.nasa.gov/docs/archive.html and processed them using a software package dedicated to the analysis of the data from coded mask telescopes (Segreto et al. 2010). The BAT light curve consists of 55,312 entries and the source was in the BAT field-of-view 15 times a day, for 412 s each time on average. The source is detected with high significance ( 25 standard deviations) in the 15–150 keV BAT range. Fig. 1 shows the significance map of the BAT sky region around LS I +61∘303.

Data analysis was performed using the HEASARC/FTOOLS v. 6.16, the RStudio software (RStudio Team 2015) and the specific Lomb-Scargle R package (Ruf 1999) We report errors at one sigma confidence level, unless stated otherwise.
2.1 Temporal analysis: detection of the
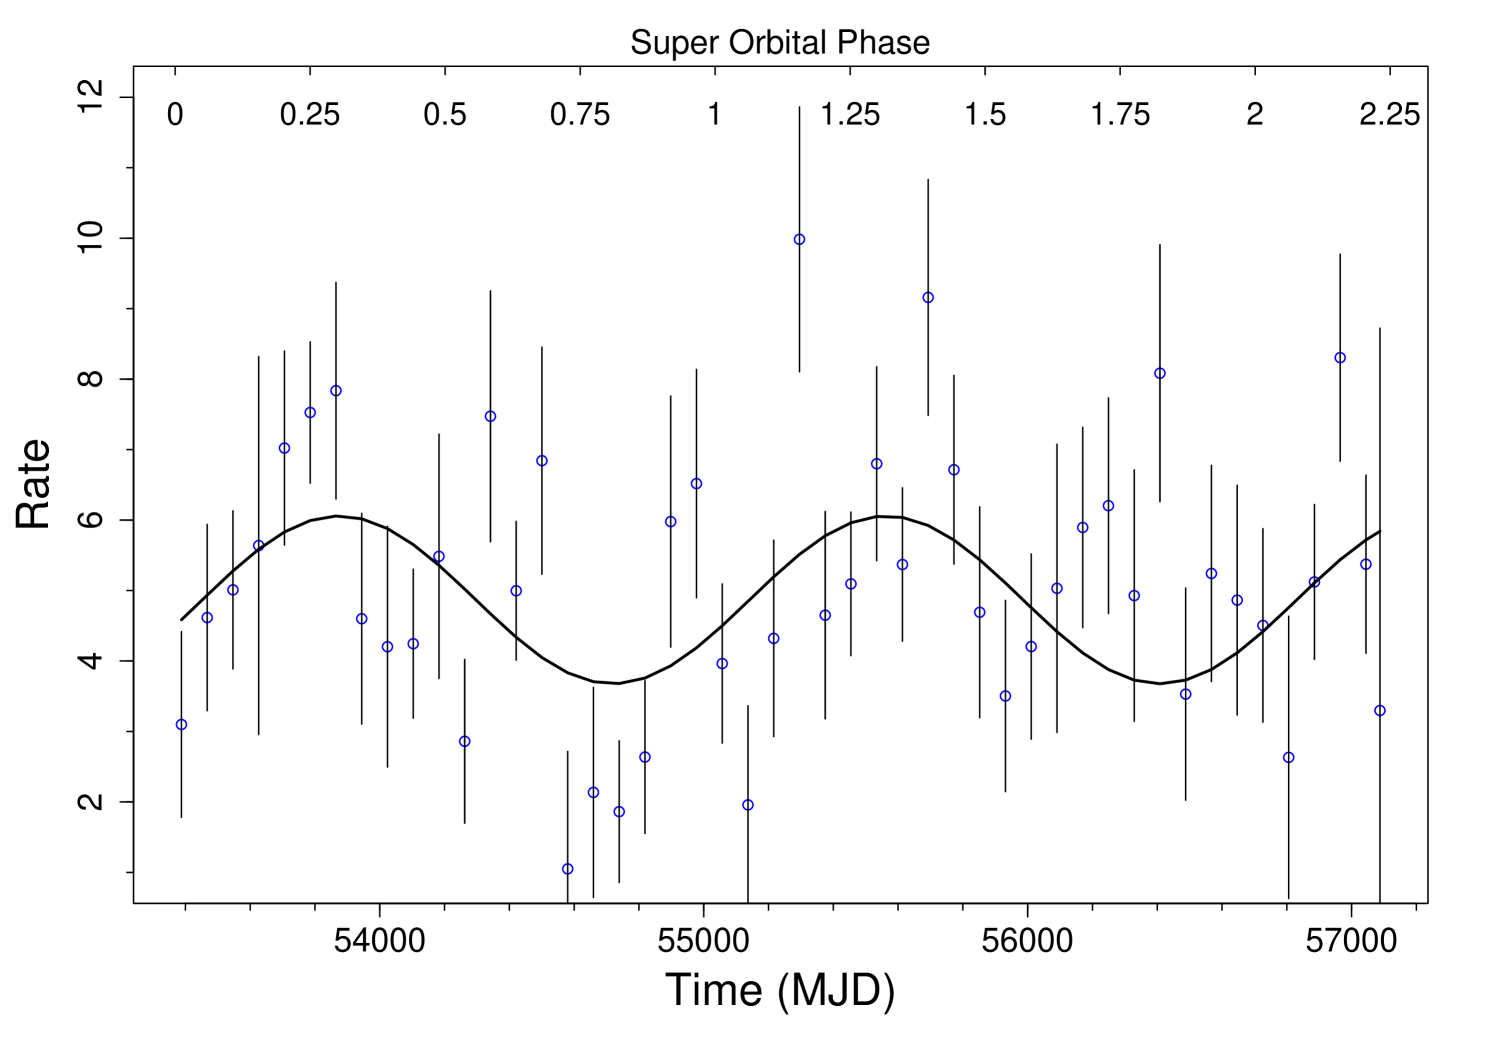
We first studied the long-term light curve of the BAT data, looking for the presence. Because the data cover approximately slightly more than two complete orbits, we tried to directly fit the light curve using as a best-fitting model the sum of a constant emission and a sine function, assuming the shape of the periodicity is sinusoidal. Data were re-binned using a time-bin of 80 days, corresponding to about three complete orbital periods. The values for the constant rate, the sine amplitude, the period and the phase were initially all left as free parameters.
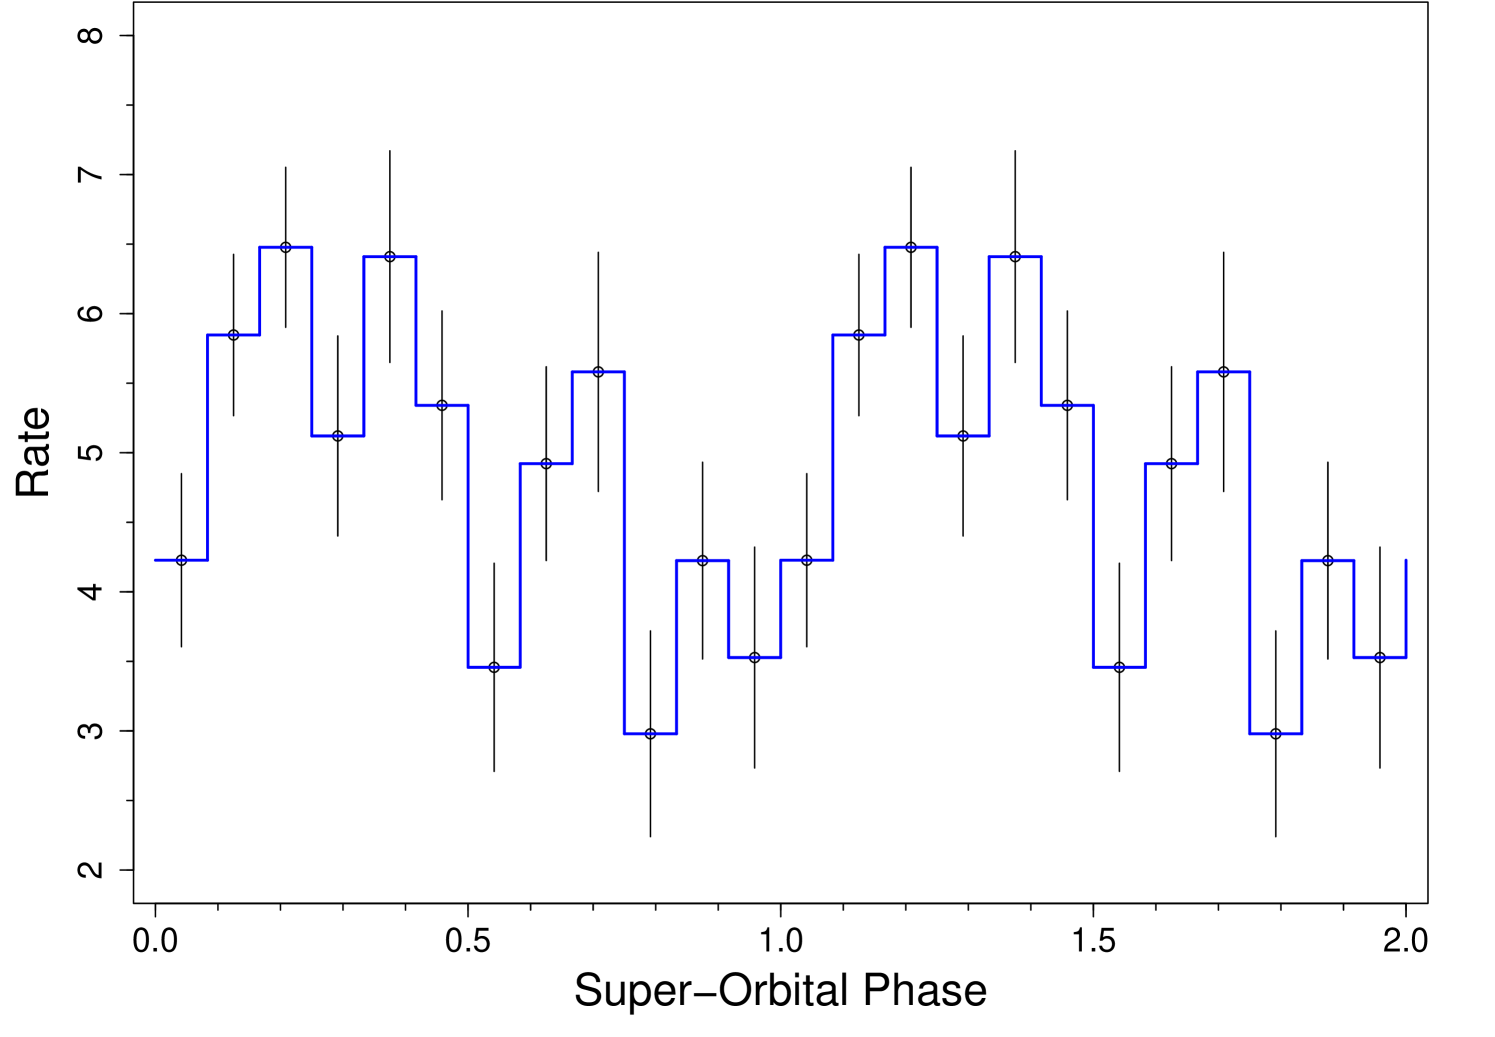
We found an averaged flux of (4.9 0.2) 10-5 counts s-1 pixel-1, a semi-amplitude of (1.2 0.3) 10-5 counts s-1 pixel-1 a super-orbital period Pso = 1689 112 d. We show in the upper and lower panel of Fig.2 the BAT light curve with super-imposed the best-fitting model and the folded profile at , respectively. The F-test that compares this model with the null-hypothesis of no modulation in the data gives 1% probability that the improvement is obtained only by chance. The sinusoid peaks at the super-orbital phase 0.2, compatibly with the phase shift ( = 0.17 0.02) observed in soft X-rays and in hard X-ray with /ISGRI data (Li et al. 2012; Li et al. 2014).
We then extracted two, statistically similar, energy-selected light curves in the 15–35 keV (source significance 20 ) and in the 35–150 keV (significance 16 ) bands to check the amplitude dependence on energy. To this aim, we obtained the values for best-fitting function composed of a constant and a sinusoidal component as previously described. We found that the modulation is statistically detected in the softer band at 3 ( = 1715 140 and amplitude fraction 0.3) while only marginal detection ( 2 ) is obtained for the harder band.
2.2 Temporal analysis: Lomb-Scargle periodograms
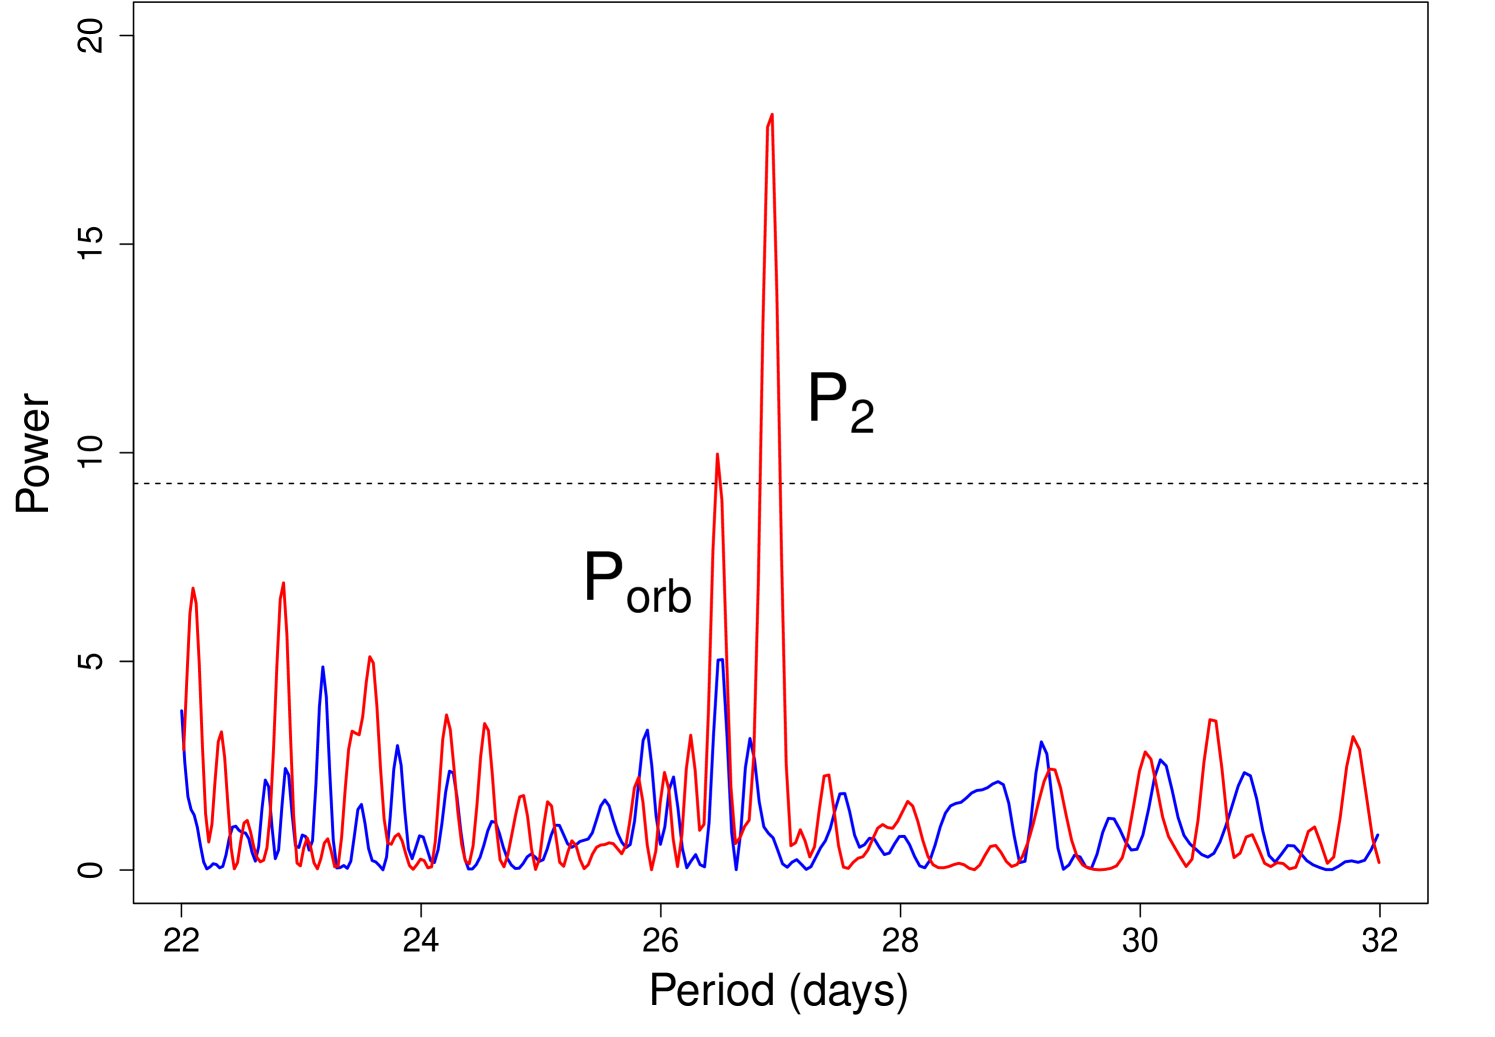
We searched for any periodicity in the 22–32 d period range using the Lomb-Scargle periodogram (LSP) technique (Lomb 1976). We consider that the error on the detected periods is the half-width of the bin period, that is for the BAT data-set and periods of interest 0.10 d. A preliminary search using the whole dataset in the 15-150 keV band did not result in any significant detection. In fact, LSP method is insensitive to the statistical error associated to each measure, while the BAT survey data are characterized by a wide spread of non-Gaussian statistical errors that depend on several factors (mainly the reduction of the coded fraction when the source is observed at large off-axis angles). In this case, a filtering method may help a weak feature to emerge over the noise. We therefore begun to gradually remove data with the largest associated rate uncertainty. We noted that by filtering out from the original dataset the 23% of the data with the largest uncertainty, a periodicity at 26.47 0.10 d starts to be significantly detected, while removing the 35% of the noisiest data, resulted in the detection of a second period of slightly higher value at 26.93 0.10 d, compatible with the period that had been reported in radio and in the gamma band (see Fig. 3).
We repeated the same procedure for the two energy-filtered datasets (15–35 keV and 35–150 keV bands). We noted again that it was necessary to remove part of the noisiest entries to obtain statistically significant detections. As for the entire energy range the orbital period is the first feature to emerge, followed by the detection. In particular, for the softest band periods are detected when 36% of the data are removed, while for the hardest energy band this happens after 24% of the data are removed.
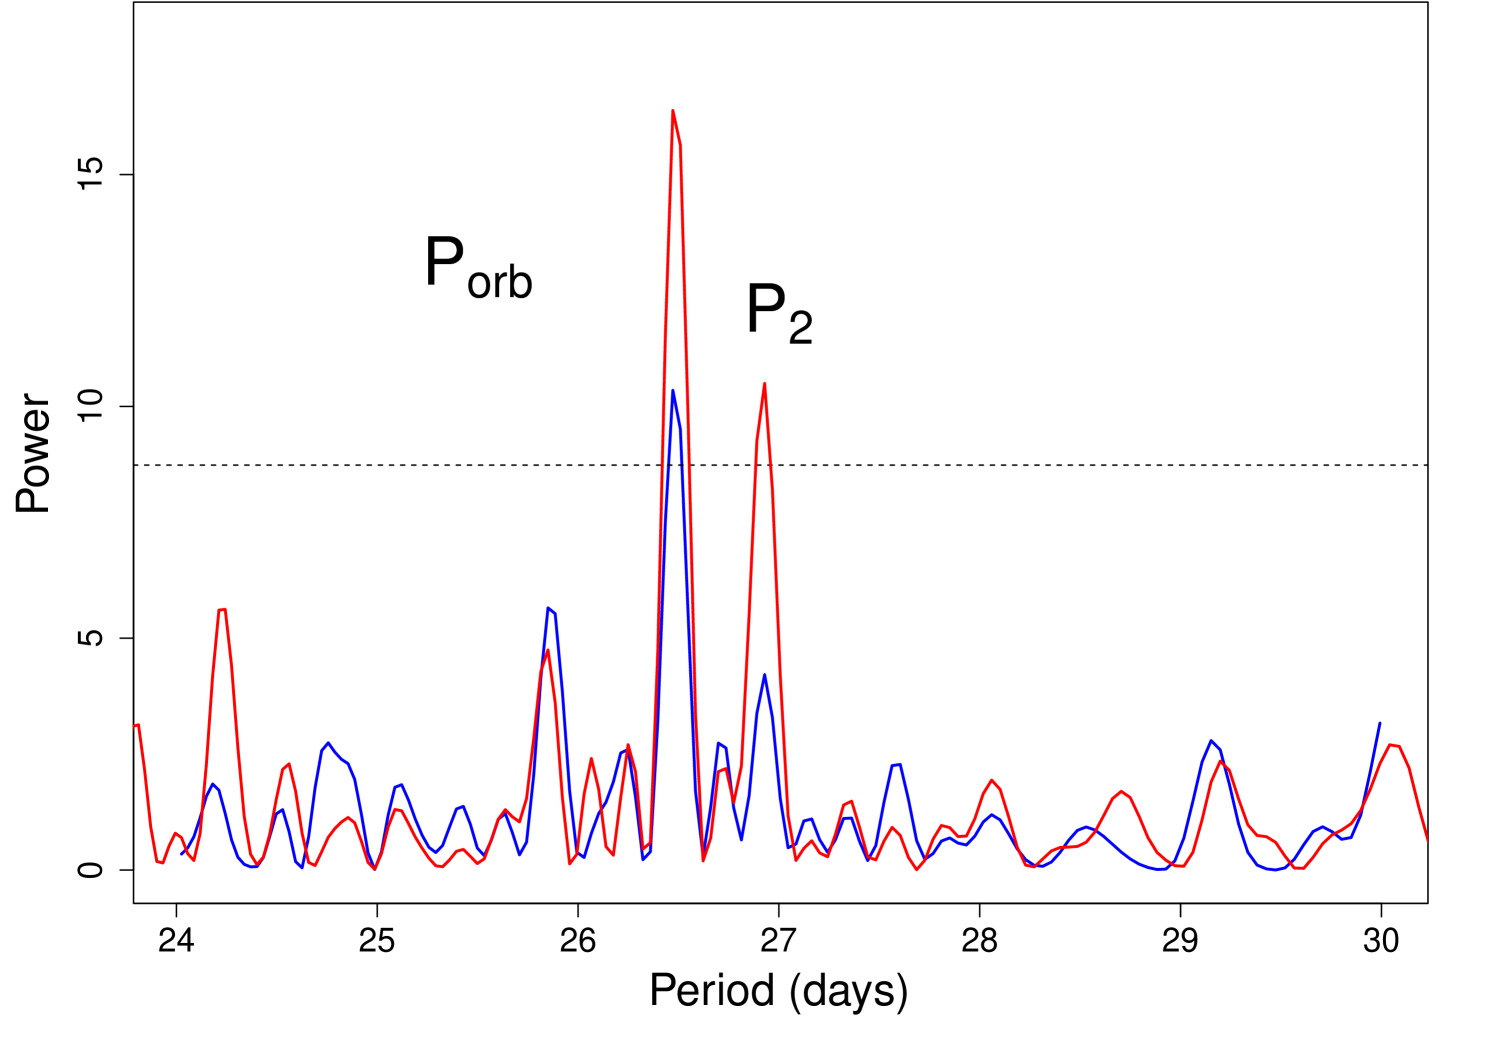
Following Jaron & Massi (2014), we then passed to study the power of the two signals for different orbital phase intervals (where the phase is calculated assuming as time of reference = 43,366.275 MJD and = 26.496 d), using a moving window of constant phase width of 0.5, with no selection on energy, and filtering out the noisiest data when needed. We found that the intensity of both features strongly depends on the orbital phase selection: this is more clearly demonstrated by the two phase intervals around the periastron (0 0.5) and apoastron (0.5 1.0) passages. We show in Fig. 4 the corresponding LSPs: data belonging to phase 0.5 (blue line) do not show evidence of any periodicity (irrespective of other additional filters based on energy and/or rate error), whereas data belonging to phase interval 0.5 (red line) clearly show both and periodicities (when 35% of noisiest data are removed). We note that the power associated to the periodicity becomes sensibly stronger with respect to , in analogy with what observed also in the GeV band (Jaron & Massi 2014).
Finally, we studied the temporal evolution of the signals according to the super-orbital phase. To this aim, we selected 5 phase intervals, choosing the boundaries so to keep the same number of data for each interval (i.e. 0, 0.15, 0.31, 0.54, 0.79, 1). We found that both the and the periods could be well detected in the LSP only for the super-orbital phase interval 0.15–0.31, whereas marginal significant detection is obtained for the other phase-intervals.
3 Orbital modulation of the spectral shape
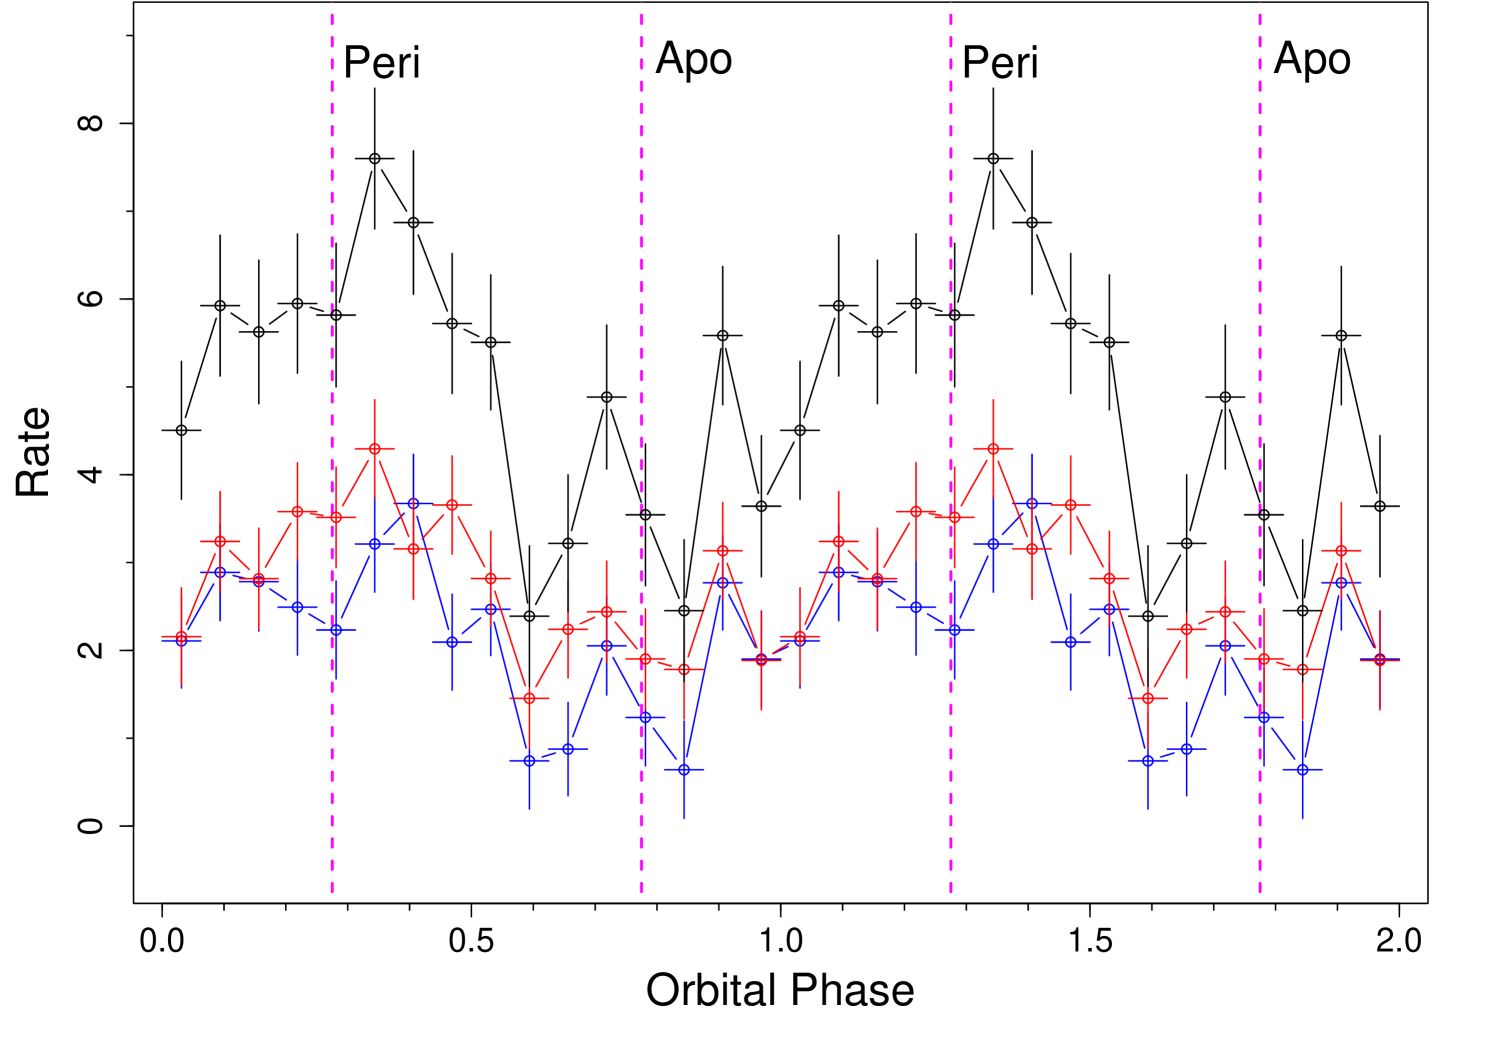
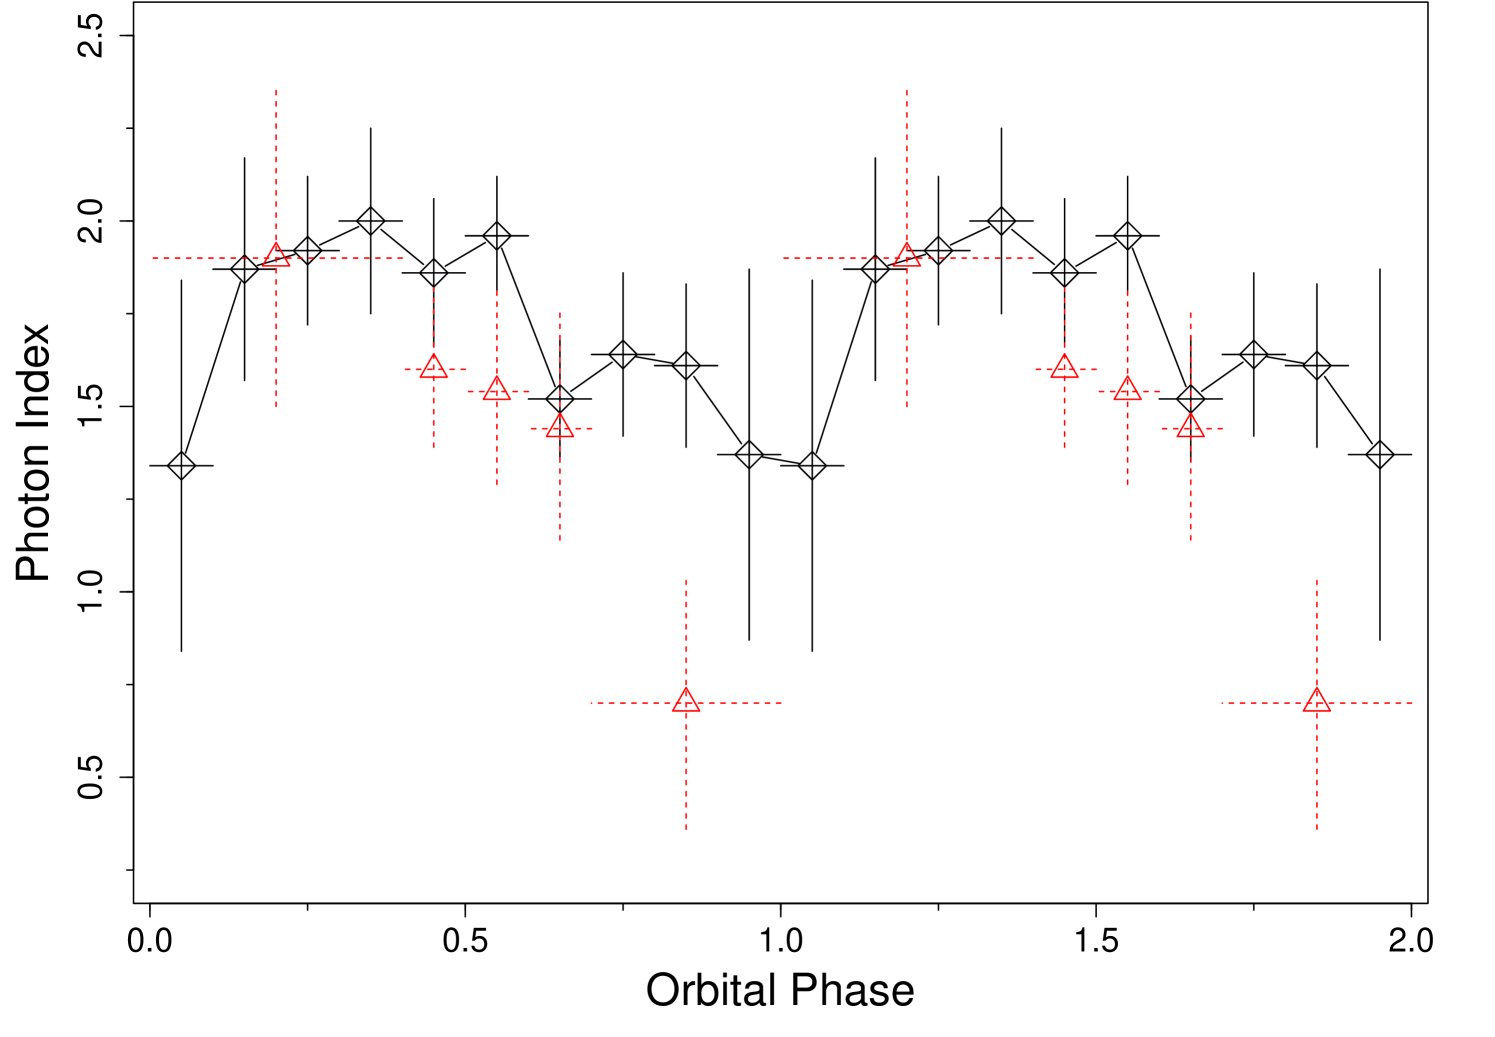
We studied the spectral shape of the hard X-ray emission as a function of the orbital, , and jet precession phase. In the upper panel of Fig. 5 we show the BAT data folded at for three energy bands: 15–35 keV, 35–150 keV, and 15–150 keV. The emission peaks at phase 0.3, while the phase of minimum emission appears more structured around the apoastron passage. The observed maximum flux ratio is 6. The folded profile is similar in the two energy-selected bands, although it is to be noted that the soft emission is enhanced over the hardest band in the first half of the orbital cycle. This is most easily observed through a direct spectral fit of the phase-selected spectra. We choose 10 equally spaced phase selected spectra and fitted them using a simple power-law model. We show in the lower panel of Fig. 5 the dependence of the photon-index as a function of the orbital phase. We observe a clear trend as a function of the phase that gives an account of the overall modulation of the energy-selected folded profiles.
 |
 |
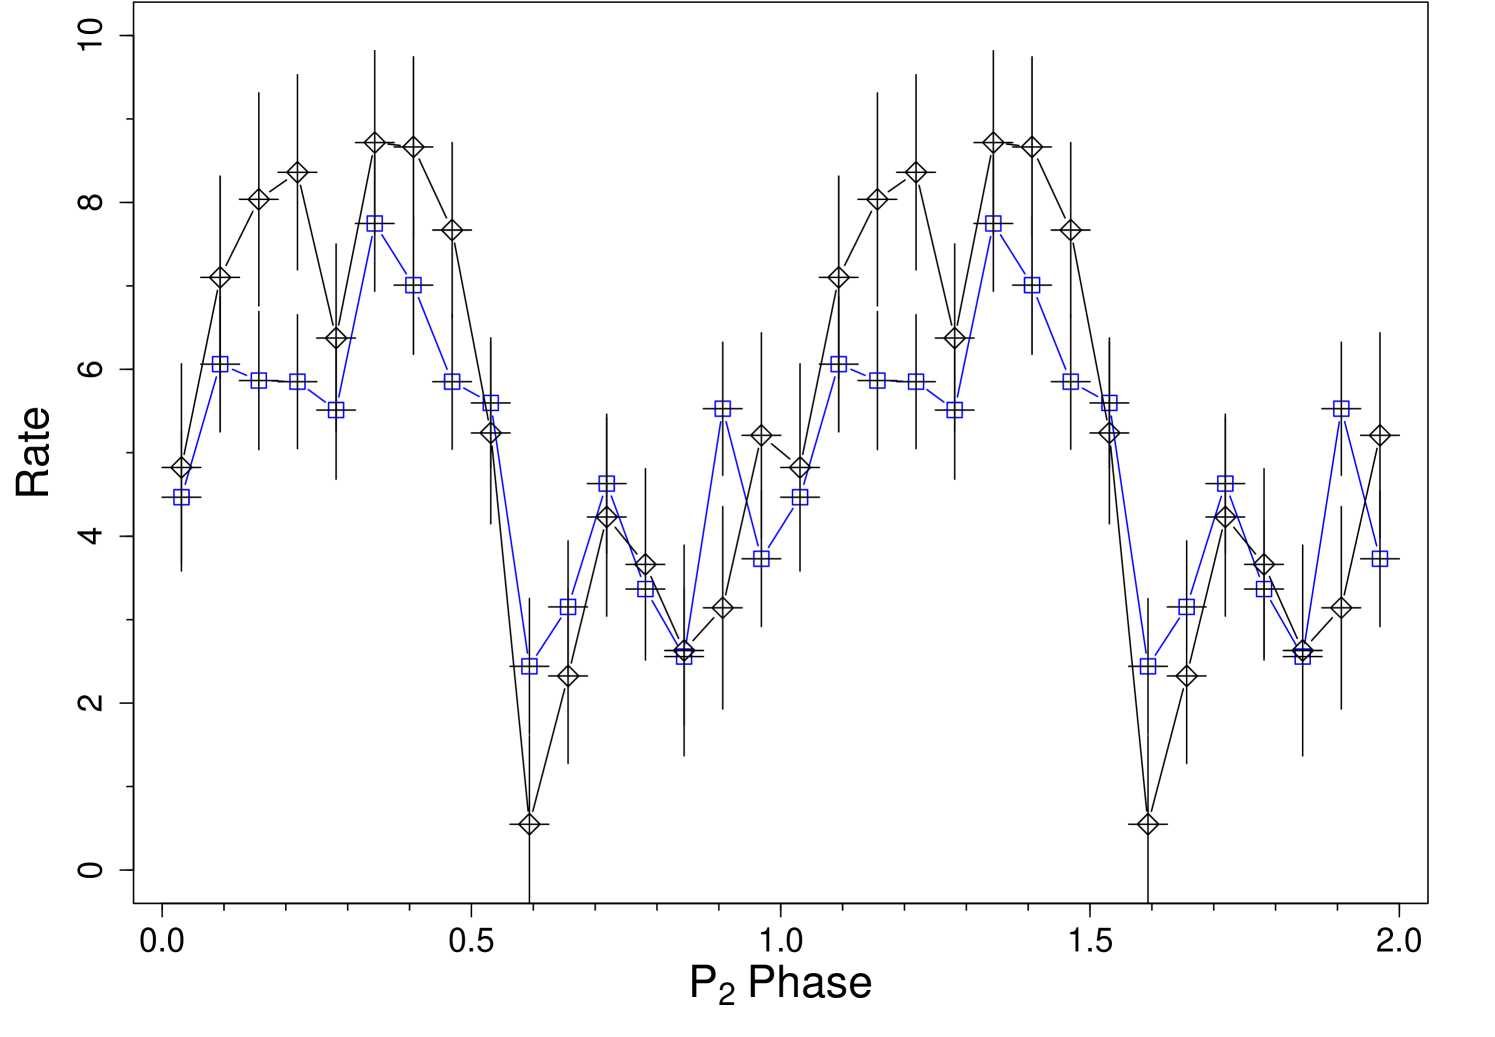
We show in Fig. 6 two folded profiles at using the same epoch of reference of the folded and a period of 26.93 d, that is the our best value according to the LSP of Fig. 4. The profile in blue is averaged over all orbital phases, whereas the profile in black is obtained when the signal becomes enhanced in the orbital phase interval 0–0.5.
4 Discussion
We examined the /BAT light curve of LS I +61∘303 to assess the presence and the spectral characteristics of its long-term periodicities. Li et al. (2014) reported the presence of the long-term modulation in hard X-rays using /ISGRI data. The ISGRI energy band (17–60 keV) almost entirely overlaps with the BAT band, and the temporal window used in that analysis (MJD 52579–56500) covers 84% of the BAT window, so it can be considered an excellent benchmark for our results (but the ISGRI exposure is only 10% of the BAT one). We confirm that the long-term is well detected (at 4 ) in hard X-rays. The BAT folded profile (Fig. 2) is similar to that obtained from ISGRI, although the larger and more uniform distribution of the exposures at all phases allows us to derive a more detailed profile. We confirm a higher X-ray emission during the first half of the super-orbital cycle.
We assessed the presence of the and periodicities in the 15–150 keV band that are also visible in two different energy bands (15–35 keV and 35–150 keV). In particular, the detection of (already revealed only in radio and in the band, Massi et al. 2015)) is reported for the first time in X-rays. We found this feature more prominent in the data selected in the orbital phase 0.5–1.0, and this behaviour matches the GeV analogous feature (Jaron & Massi 2014; Massi et al. 2015); we consider this finding as a strong indication for a common origin for the apastron energy emission mechanism, from radio, X-rays to the GeV wavelength. Massi & Torricelli-Ciamponi (2014) proposed a physical scenario able to relate the presence of these periodicities across such different energy bands. In this picture, the long-term period is a beat period caused by the combination of a precessing jet (at a period ) that receives a modulated fraction of plasma with a slightly different period (the ). The overall emission (synchrotron emission emitted by relativistic electrons in the magnetized jet) is the highest when the jet forms the minimum angle with our line of sight and its emission becomes Doppler boosted. We estimated the expected beat period () of these two periodicities to be 1560 480 d, consistent with our measure of the long-term modulation , although we note the rather large uncertainties on and . We found that the power of the two signals depends on the super-orbital phase, and it is maximum in both cases for the super-orbital phase 0.15–0.31, that corresponds to the peak of the folded profile (lower panel of Fig.2).
We also studied the spectral shape in hard X-rays as a function of the orbital phase () for the whole BAT time-span. The folded, time-averaged over the whole BAT observing window, X-ray profile peaks close to the periastron passage, and it shows two dips, before and after the apostron, that hint for a secondary peak at this phase (Fig. 5, upper panel). Although the ISGRI folded profile and the values of the photon-index appear to be quite similar (see Tab. 1 in Li et al. 2014), BAT data allow a more detailed account of the photon-index variation along the orbit and suggest for the second half of the orbital cycle (Fig. 5, lower panel) softer indices.
Finally, we also reported for the first time the folded X-ray profile at the presumed jet periodicity, that shows a significant amplitude in the flux emission, comparable to that shown in the orbital period, when phase-selected around the apoastron passage.
5 Acknowledgements
This work was supported in Italy by ASI contract I/004/11/1.
References
- Abdo et al. (2009) Abdo A. A., Ackermann M., Ajello M., 2009, ApJL, 701, L123
- Ackermann et al. (2013) Ackermann M., Ajello M., Ballet J., 2013, ApJL, 773, L35
- Albert et al. (2008) Albert J., Aliu E., Anderhub H., Antoranz P., 2008, ApJ, 684, 1351
- Aragona et al. (2009) Aragona C., McSwain M. V., Grundstrom E. D., Marsh A. N., Roettenbacher R. M., Hessler K. M., Boyajian T. S., Ray P. S., 2009, ApJ, 698, 514
- Gregory et al. (1999) Gregory P. C., Peracaula M., Taylor A. R., 1999, ApJ, 520, 376
- Hutchings & Crampton (1981) Hutchings J. B., Crampton D., 1981, PASP, 93, 486
- Jaron & Massi (2013) Jaron F., Massi M., 2013, A&A, 559, A129
- Jaron & Massi (2014) Jaron F., Massi M., 2014, A&A, 572, A105
- Li et al. (2014) Li J., Torres D. F., Zhang S., 2014, ApJL, 785, L19
- Li et al. (2012) Li J., Torres D. F., Zhang S., Hadasch D., Rea N., Caliandro G. A., Chen Y., Wang J., 2012, ApJL, 744, L13
- Lipunov & Nazin (1994) Lipunov V. M., Nazin S. N., 1994, A&A, 289, 822
- Lomb (1976) Lomb N. R., 1976, Ap&SS, 39, 447
- Massi & Jaron (2013) Massi M., Jaron F., 2013, A&A, 554, A105
- Massi et al. (2015) Massi M., Jaron F., Hovatta T., 2015, A&A, 575, L9
- Massi et al. (2012) Massi M., Ros E., Zimmermann L., 2012, A&A, 540, A142
- Massi & Torricelli-Ciamponi (2014) Massi M., Torricelli-Ciamponi G., 2014, A&A, 564, A23
- Ray et al. (1997) Ray P. S., Foster R. S., Waltman E. B., Tavani M., Ghigo F. D., 1997, ApJ, 491, 381
- RStudio Team (2015) RStudio Team 2015, RStudio: Integrated Development Environment for R. RStudio, Inc., Boston, MA
- Ruf (1999) Ruf T., 1999, Biological Rhythm Research, 30, 178
- Segreto et al. (2010) Segreto A., Cusumano G., Ferrigno C., La Parola V., Mangano V., Mineo T., Romano P., 2010, A&A, 510, A47
- Taylor & Gregory (1982) Taylor A. R., Gregory P. C., 1982, ApJ, 255, 210