The DESI Survey Validation: Results from Visual Inspection of Bright Galaxies, Luminous Red Galaxies, and Emission Line Galaxies
Abstract
The Dark Energy Spectroscopic Instrument (DESI) Survey has obtained a set of spectroscopic measurements of galaxies to validate the final survey design and target selections. To assist in these tasks, we visually inspect (VI) DESI spectra of approximately 2,500 bright galaxies, 3,500 luminous red galaxies (LRGs), and 10,000 emission line galaxies (ELGs), to obtain robust redshift identifications. We then utilize the VI redshift information to characterize the performance of the DESI operation. Based on the VI catalogs, our results show that the final survey design yields samples of bright galaxies, LRGs, and ELGs with purity greater than . Moreover, we demonstrate that the precision of the redshift measurements is approximately 10 km/s for bright galaxies and ELGs and approximately 40 km/s for LRGs. The average redshift accuracy is within 10 km/s for the three types of galaxies. The VI process also helps improve the quality of the DESI data by identifying spurious spectral features introduced by the pipeline. Finally, we show examples of unexpected real astronomical objects, such as Ly emitters and strong lensing candidates, identified by VI. These results demonstrate the importance and utility of visually inspecting data from incoming and upcoming surveys, especially during their early operation phases.
1 Introduction
The Dark Energy Spectroscopic Instrument (DESI, Levi et al., 2013) survey is a stage-IV experiment for probing the nature of dark energy. It will obtain tens of millions of spectra of stars, galaxies, and quasars and use the 3D positions of extragalactic sources to detect the signals of baryon acoustic oscillations (e.g., Eisenstein et al., 2005) as a function of redshift. By doing so, DESI will measure the expansion rate of the Universe across cosmic time and constrain the equation of state of dark energy. In addition, DESI will probe the growth of cosmic structure via redshift-space distortion and constrain the summed neutrino masses. All the measurements and constraints will be obtained with unprecedented precision (DESI Collaboration et al., 2016a, b).
To achieve its scientific goals, DESI has been designed to observe four types of extragalactic sources:
-
•
Bright galaxies (bright galaxy survey, BGS) (Hahn et al., 2022; Ruiz-Macias et al., 2020), a galaxy sample whose redshifts can be obtained during the bright time of the observations together with the Milky Way stars (Cooper et al., 2022; Allende Prieto et al., 2020). The BGS consists of two selections, (1) BGS bright — a magnitude limit sample with , which is similar to the depth of the Galaxy And Mass Assembly (GAMA) survey (Driver et al., 2011) and about 2 magnitude deeper than the main galaxy sample from the Sloan Digital Sky Survey (Strauss et al., 2002), and (2) BGS faint — a sample of fainter galaxies with a color-selection to achieve high redshift efficiency. The designed redshift coverage of BGS is from to .
-
•
Luminous red galaxies (LRGs) (Zhou et al., 2022, 2020), a population of massive passive galaxies selected based on their colors and brightness. The DESI LRG sample has a significantly higher target density than that of any previous LRG surveys, including the SDSS LRG survey (Eisenstein et al., 2001), Baryon Oscillation Spectroscopic Survey (BOSS) (Reid et al., 2016) and extended Baryon Oscillation Spectroscopic Survey (eBOSS) (Prakash et al., 2016), and also probes higher redshifts with a designed redshift coverage from to .
-
•
Emission line galaxies (ELGs) (Raichoor et al., 2022, 2020), a color-magnitude selected population of star-forming galaxies that emit [O II] strong lines. The designed redshift coverage of ELGs is from to . This emission-line galaxy population has been revealed by deep spectroscopic surveys across a few square degrees, e.g. DEEP2 survey (Newman et al., 2013) and has been used as a tracer of the large-scale structure, e.g. the WiggleZ Dark Energy Survey (Blake et al., 2011) and eBOSS ELG survey (Raichoor et al., 2021). The DESI ELG survey will offer a sample for cosmological measurements with 10 times higher target density by observing galaxies up to one magnitude fainter than the eBOSS ELG sample (Raichoor et al., 2022).
-
•
Quasars (QSOs) (Chaussidon et al., 2022; Yèche et al., 2020), a quasar population selected by a Random Forests algorithm based on the color and magnitude information of the sources. The DESI QSO sample is designed to cover a wide range of redshifts from the local Universe to . Quasars with will be used primarily as tracers of the matter distribution, while quasars with will be used primarily as background light to probe the matter distribution traced by the Lyman forest in the foreground. DESI aims to obtain approximately three million quasar spectra and quadruple the number of known quasars obtained from previous surveys (e.g. eBOSS, Dawson et al., 2016; Lyke et al., 2020).
Together, these sources will enable DESI to map the matter density distribution of the Universe across 10 billion years of cosmic time from the local Universe to . However, to meet the requirements of the DESI design, the sources are selected from a novel parameter space. For example, DESI is the first large-scale survey to observe a high density of ELGs with . Similarly, our BGS and LRG surveys will cover fainter objects that have not been extensively observed in previous surveys.
In order to maximize the efficiency of obtaining redshifts of extragalactic sources covering the desired redshift ranges, a set of Survey Validation (SV) observations (DESI Collaboration et al., 2023) were designed to cover a wider range of parameter space with longer exposure times than the Main Survey. This SV dataset is used to explore and define the final target selections for the DESI Main Survey.
To support such analyses, one of the key components of the DESI SV is to construct catalogs of the DESI targets with robust redshift identifications. While an automatic data pipeline (Guy et al., 2022; Bailey et al., 2023) has been developed to reduce the raw data and obtain the best-fit redshifts of spectra, it is crucial to have an additional validation of the dataset which enables us to (1) assess the quality of data; (2) assess the precision and accuracy of the redshift measurements from the pipeline; and (3) offer feedback for improving the performance of the data pipeline, especially during the early phase of the survey. To this end, we have visually inspected (VI) more than 15,000 DESI SV spectra and produced VI catalogs of BGS, LRGs, ELGs and QSOs observed in the DESI SV program. Visual inspection of survey datasets has been demonstrated to be essential during the development of a survey (e.g., Newman et al., 2013; Comparat et al., 2016; Pâris et al., 2018).
In this work, we describe the procedure that we adopt for visually inspecting DESI spectra. We make use of the VI catalogs to explore the target selections, and to validate the design of the DESI Main Survey. Given that galaxy and quasar spectra have different properties, in this work we focus on the VI catalogs of galaxies, including BGS, LRGs and ELGs. The QSO VI catalog and results are described in Alexander et al. (2022).
The structure of the paper is as follows. The procedure of VI is described in Section 2. The data and the VI catalogs are described in Section 3. We show our analysis for validating the DESI design in Section 4 and demonstrate how this VI process assists the development of the DESI pipeline in Section 5. In Section 6, we show some spectra of rare galaxy types identified during the VI process and highlight scientific projects that can be done with the incoming DESI datasets. We summarize in Section 7.
2 The procedure of visual inspection
The main goals of visual inspection of DESI spectra are (1) to construct catalogs of different targets with redshift and source-type identifications verified by inspectors and (2) to assess the performance of the data pipeline and the redshift identifications from the Redrock algorithm (Bailey et al., 2023). This VI step enables us to have additional redshift classification information for each spectrum that does not entirely rely on the data pipeline and may be less sensitive to artifacts and systematic features in the data.
The general flow of the VI procedure is as follows:
-
1.
Each spectrum has at least two inspectors.
-
2.
For each spectrum, inspectors report four key features:
-
(a)
Redshift;
-
(b)
Quality of the redshift with 5 discrete values from 0 to 4 with 4 being the highest quality and 0 being the poorest quality;
-
(c)
Type of the source, i.e. star, galaxy, or quasar;
-
(d)
Any artifacts or systematic features in the spectrum;
-
(e)
Plus any extra comments, e.g., there are two objects in the spectrum.
-
(a)
-
3.
The outputs from the inspectors are compared. For each spectrum, the multiple VI reports are automatically merged into the final VI results, if the outputs of all the inspectors satisfy the following conditions:
-
(a)
The difference of the redshifts, from inspectors and , is within (),
(1) -
(b)
the difference of the quality values is within 1, i.e. ;
-
(c)
The VI spectype from all of the inspectors is the same;
The final redshift is the mean of the redshifts, the final quality value is the mean of the quality values, and the final source type (best VI type) is the spectype identified by all of the inspectors.
-
(a)
-
4.
If any of the above conditions is not met, a merger inspects the spectrum again and determines the final VI results. Note that this merger might occasionally be one of the inspectors.
One of the key steps in the VI procedure is to assess the quality of the VI redshift. The criteria for the quality are:
-
•
Quality 4: confident classification with two or more secure features, e.g., spectra with multiple emission lines and absorption lines;
-
•
Quality 3: probable classification with at least one secure spectral feature and continuum or many weak spectral features, e.g., spectra with a strong emission line feature and weak Balmer series absorption lines;
-
•
Quality 2: possible classification with one strong spectral feature but unsure what it is;
-
•
Quality 1: unlikely classification with some signal but features are unidentified;
-
•
Quality 0: nothing there, no signal.
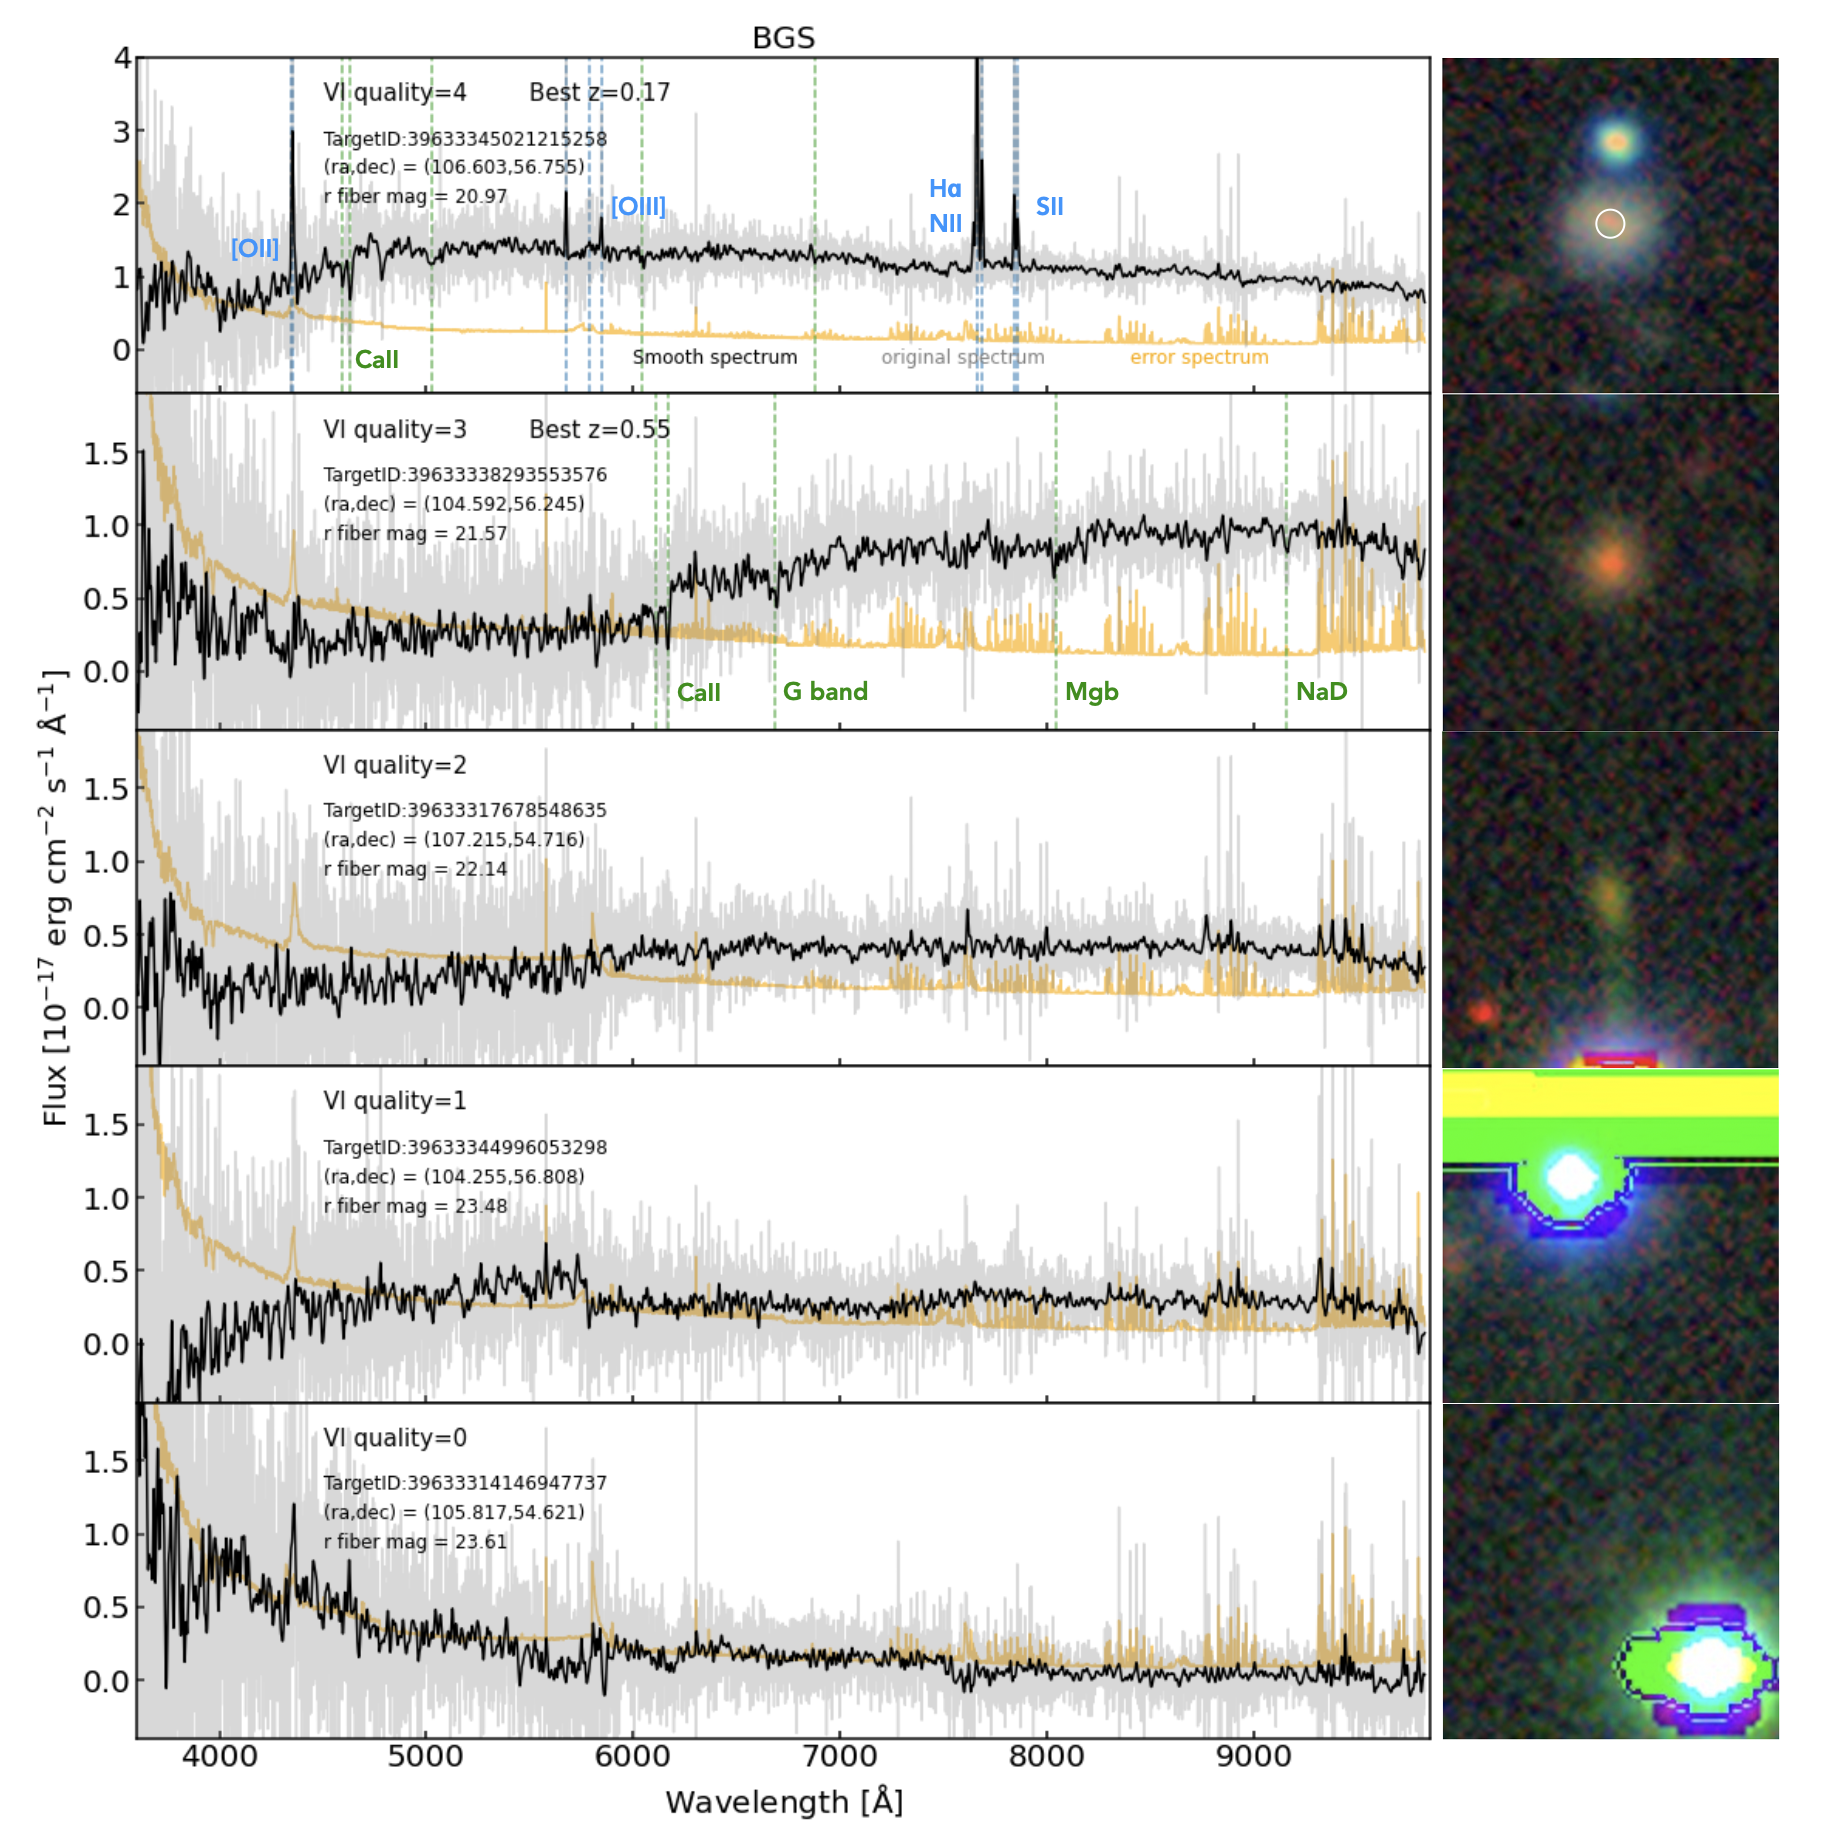
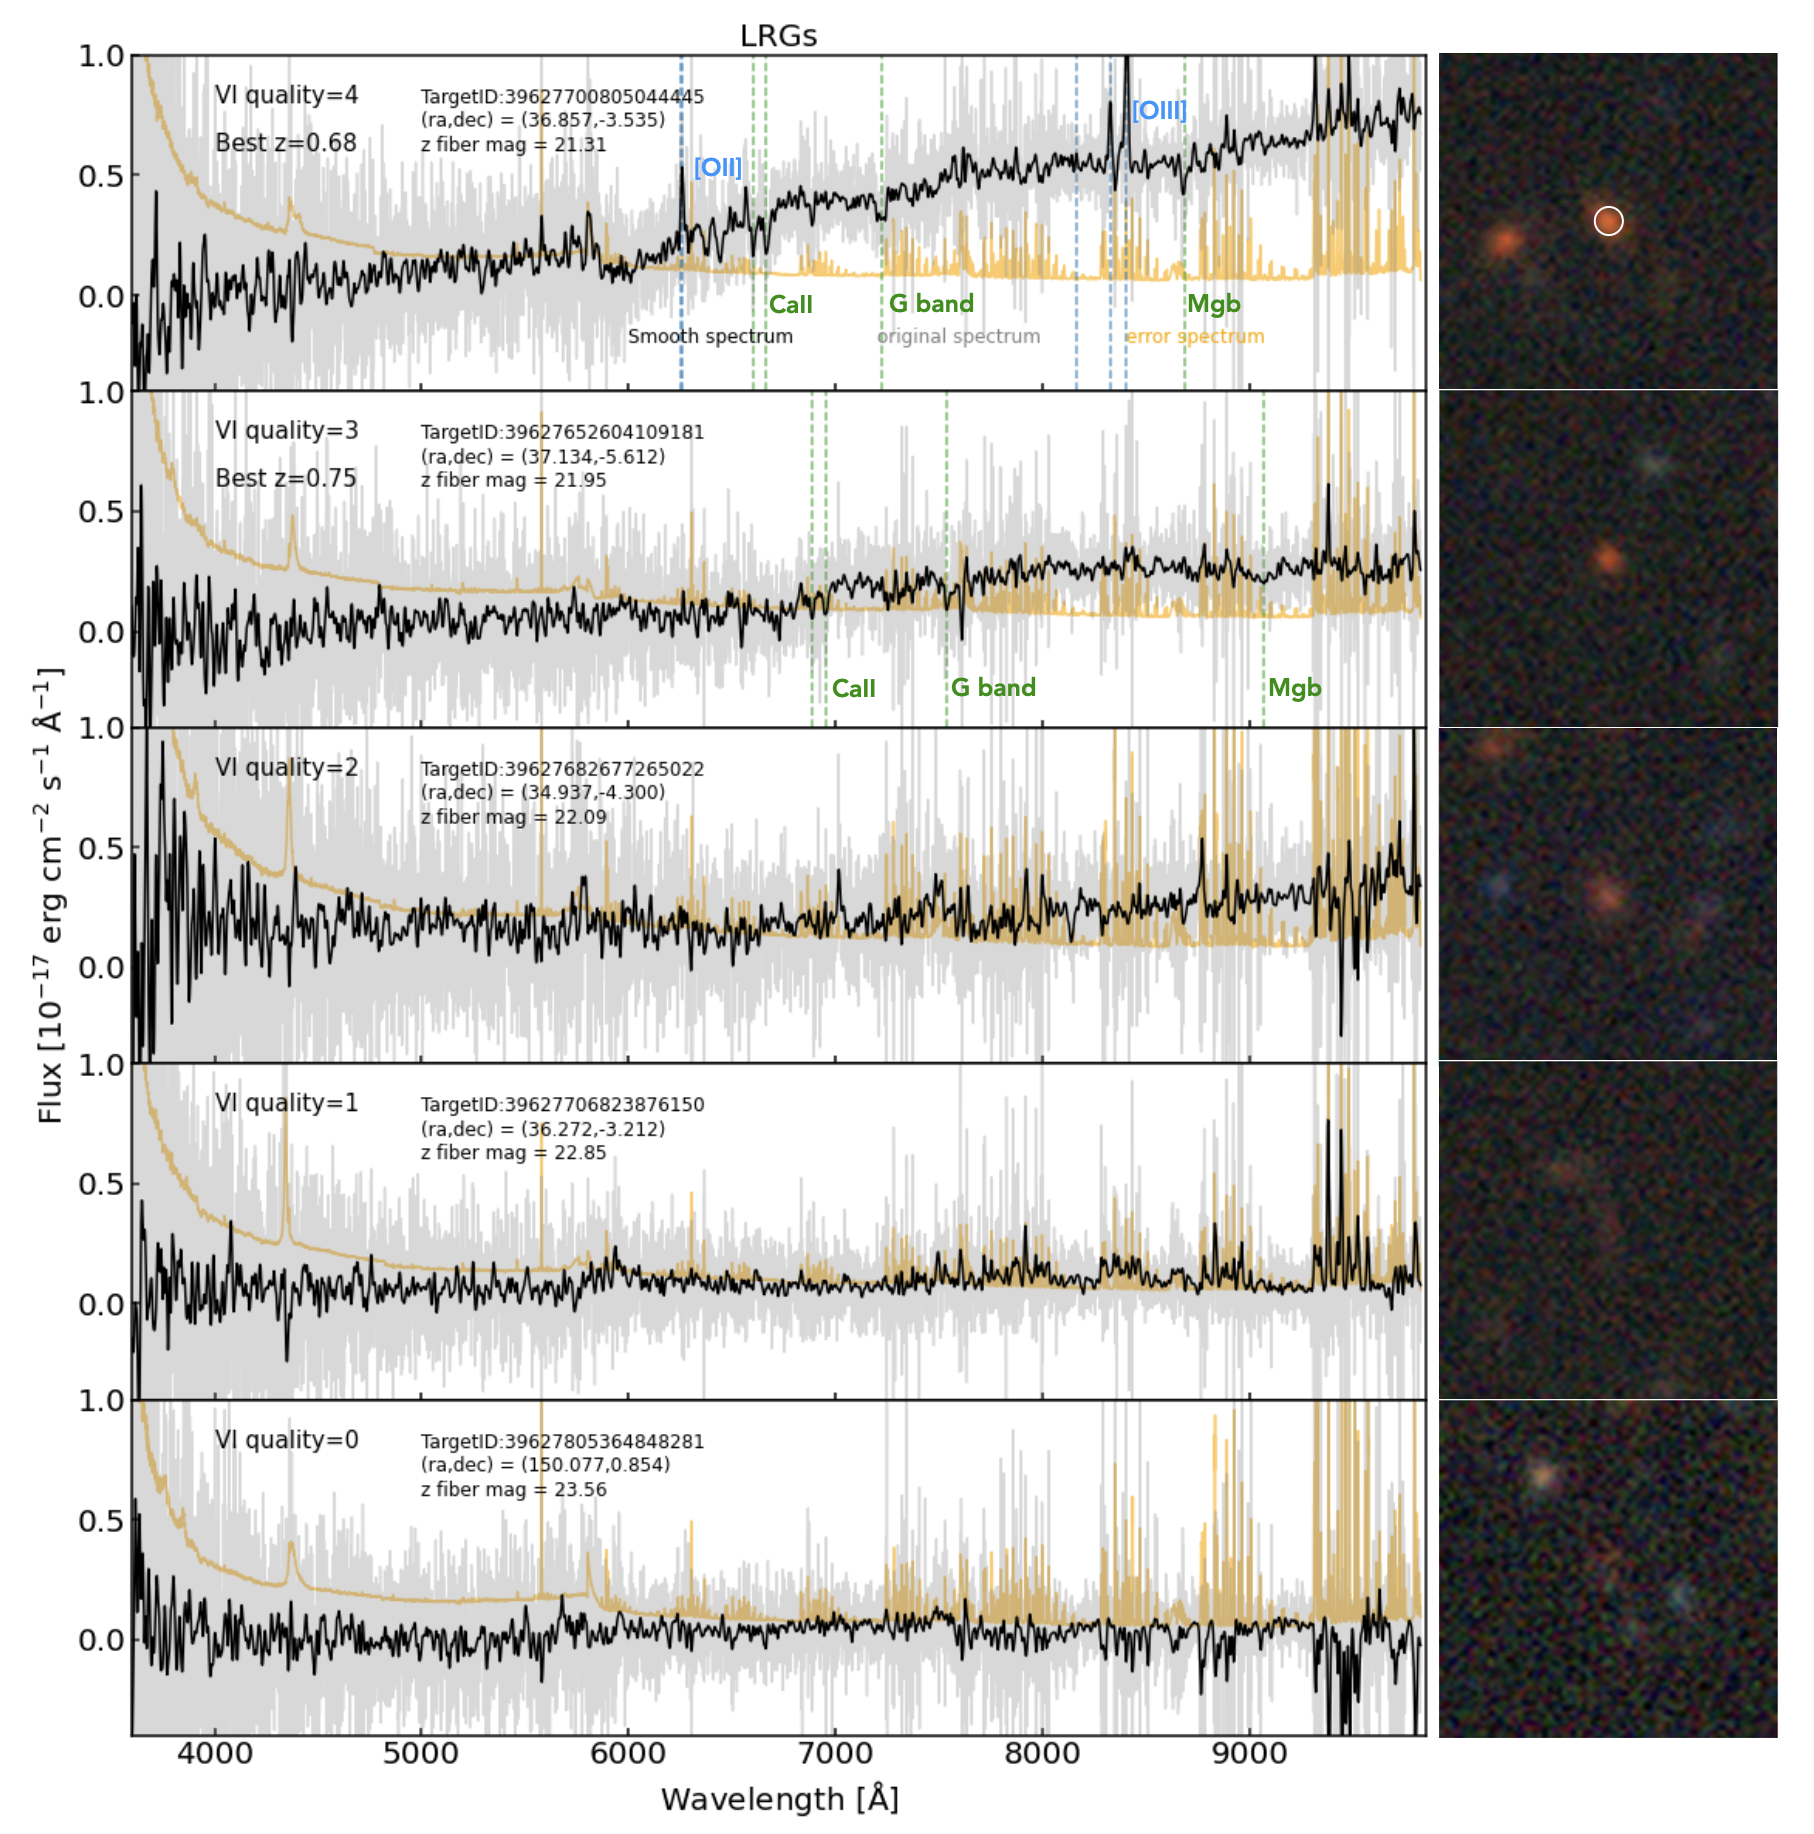
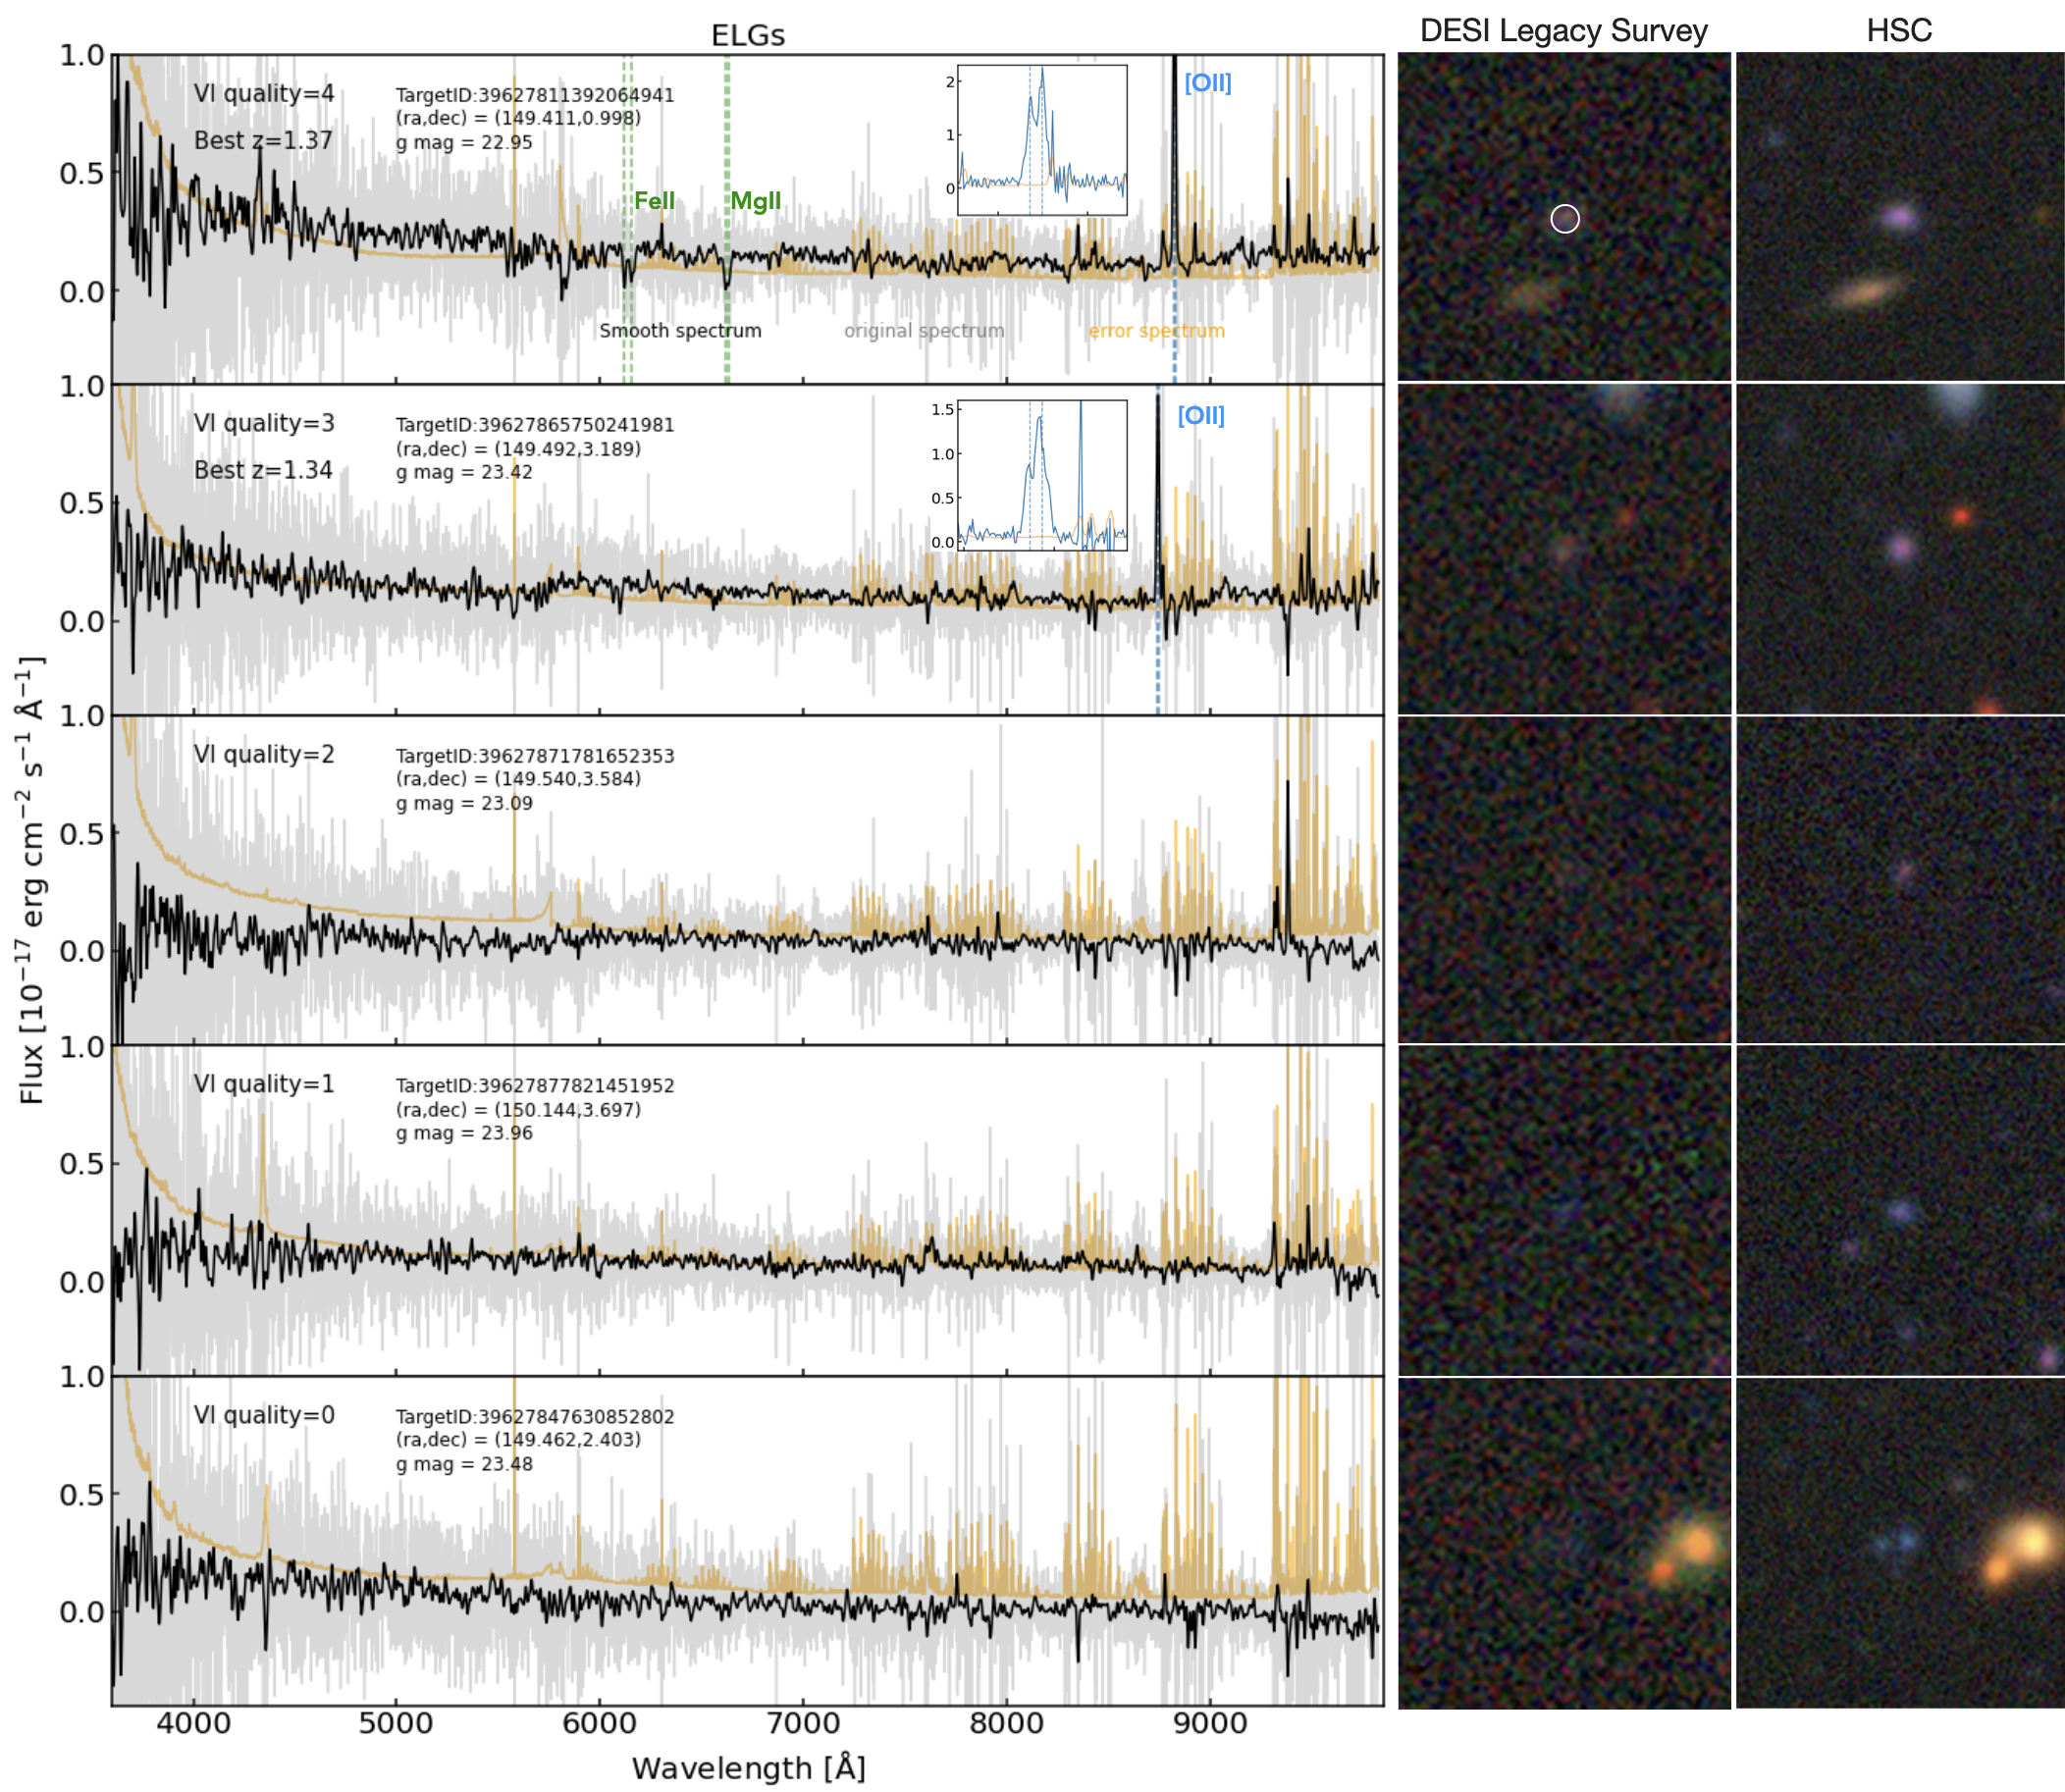
Figures 1, 2, and 3 show example BGS, LRGs, and ELGs spectra respectively, of each of these different qualities.
Given the above definitions, we consider the final VI redshift with an overall VI quality as a robust VI redshift. Sources with an overall VI quality typically indicate that the corresponding spectra are too shallow to detect spectral features or the sources are at redshift regions with spectral features beyond the wavelength coverage of the DESI spectrograph, e.g. galaxies at where the [O II] doublet is beyond the wavelength coverage of the instrument.
Finally, we summarize our dedicated tool, Prospect, for performing the VI and our efforts of recruiting and training visual inspectors in the Appendix.
3 Data and the catalogs
The data used in this work was obtained by the DESI instrumentation with a 3.2 degree diameter field of view and 5020 robotic fiber positioners installed on the 4-meter Mayall Telescope at Kitt Peak National Observatory (Abareshi et al., 2022; Silber et al., 2023; Miller et al., 2022). The DESI spectrograph covers the optical wavelength region from 3600 to 9800 with a spectral resolution ranging from in the shortest wavelength channel to in the longest wavelength channel. In addition, the DESI targets are selected based on the photometric properties from the DESI Legacy Imaging Surveys (Schlegel et al., 2023; Zou et al., 2017; Dey et al., 2019). The target selection procedure is summarized in Myers et al. (2022). The pipelines used to automatically assign fibers to targets and used to plan and optimize the observational procedure are summarized in Raichoor et al. (2023) and Schlafly et al. (2023).
During the DESI SV observations, several fields were selected to have approximately times longer exposure time than the designed nominal exposure time of the DESI Main Survey (DESI Collaboration et al., 2023). This is for detecting spectral features that might not be detected with the normal exposure time and for validating the exposure time of the DESI Main Survey. Because the observational conditions, such as airmass and galactic extinction of the field, vary, the exposure time for each observation was calibrated into the effective exposure time, , that corresponds to the exposure time with airmass 1, zero galactic extinction, seeing (full width half maximum), and zenith dark sky (DESI Collaboration et al., 2023). In addition, to explore the target selection schemes that maximize the efficiency of the survey, galaxy targets were selected from a wider magnitude and color space during the SV observations than the range planned for the Main Survey.
To support these analyses, we have conducted two visual inspection campaigns. During the first one, we visually inspected deep co-added spectra, which were based on an early version of the data reduction pipeline111Software release 20.12, including desispec 0.36.0 and redrock 0.14.4, from SV observations, including BGS, LRG, and ELG targets. Through the visual inspection, we identified some spectral features due to instrument effects, calibration issues, or sky residuals which will be discussed in Section 5. These features prevented the inspectors from recovering the true redshifts of the sources. Therefore, in the second campaign, we performed the visual inspection for sources with low VI quality values identified during the first one but with the spectra reduced by the latest version222Software release 22.2, including desispec 0.51.13 and redrock 0.15.4 of the data reduction pipeline. The sources included in the second campaign are
-
1.
all SV BGS galaxies with VI quality,
-
2.
all SV LRG galaxies with VI quality, and
-
3.
all ELGs in the Main Survey selection with VI quality.
Note that we only included ELGs that are in the Main Survey selection because the main goal of the analysis is to use the VI results to test the Main Survey target selection and performance. With this second campaign, we recovered a few percent of redshifts that were identified with low quality previously. In the final VI catalogs, we adopted the second campaign VI results for sources included in the second campaign and the first campaign VI results for the rest. The basic information of the VI fields and the statistics are summarized in Table 1 and 2. In the following, we describe the VI properties of each target type.
Targets TILEID Field name Position Effective exposure timea [s] Number of sources (ra,dec) [deg] (SV extended selection) BGS 80613 Lynx (106.740, 56.100) 3000 2718 LRGs 80605 XMM-LSS (36.448, -4.601) 6900 1772 80609 COSMOS (150.120, 2.206) 7800 1789 ELGs 80606 XMM-LSS (36.448, -4.501) 6700 3441 80608 Lynx (106.740, 56.200) 15200 3430 80610 COSMOS (150.120, 2.306) 9500 3444
| Targets | Selection | Number of sources | Number of robust VI redshift | Fraction | Density [] |
|---|---|---|---|---|---|
| BGS | SV | 2718 | 2640 | 97.1% | 2500 |
| Main bright | 1037 | 1033 | 99.6% | 870 | |
| Main faint | 509 | 509 | 100% | 540 | |
| LRG | SV | 3561 | 3513 | 98.7% | 2120 |
| Main | 933 | 928 | 99.5% | 610 | |
| ELG | SV | 10315 | 7856a | 76.2% | 6500 |
| Main LOP | 2897 | 2474 | 85.4% | 1950 | |
| Main VLO | 668 | 664 | 99.4% | 450 |
3.1 Bright galaxy survey (BGS)
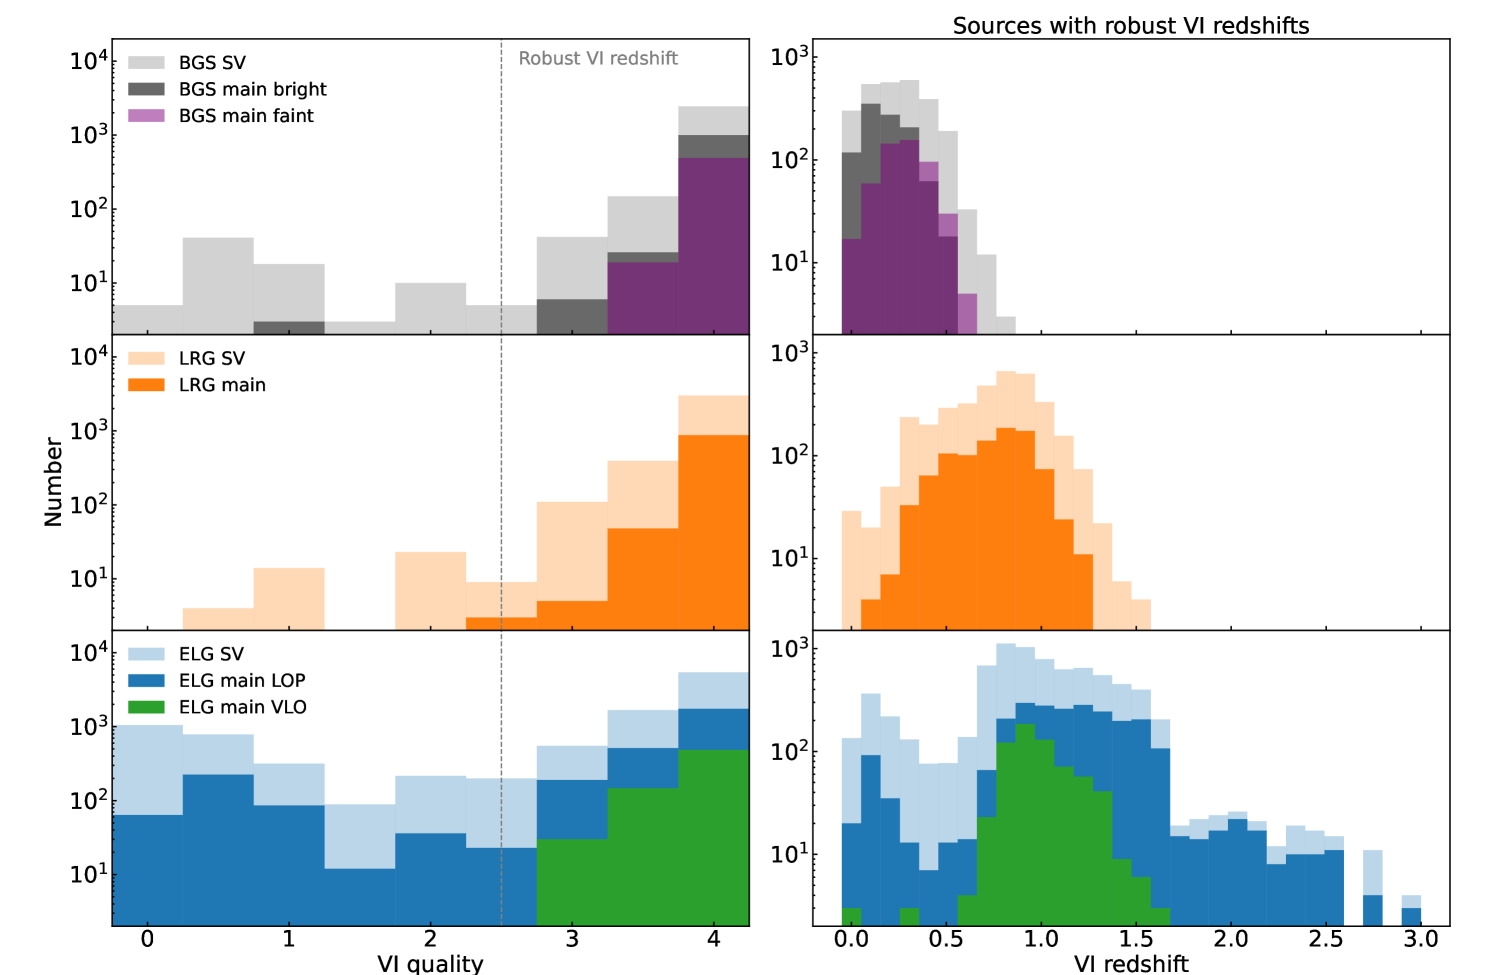
For the bright galaxy survey, we visually inspect spectra of 2718 BGS targets in one deep tile from the SV observations; the position of this field is listed in Table 1. The cumulative effective exposure time of the spectra is about 3,000 s, which is 10-15 times longer than the designed nominal exposure time, 150-200s, for bright galaxies. The top left panel of Figure 4 shows the VI quality distribution of SV BGS targets in grey. Approximately 97% of the BGS targets have VI quality greater than 2.5, i.e. their spectral features can be identified. The rest of the sources are mostly faint galaxies of approximately 23 magnitude in -band and image artifacts due to bright stars (see the bottom panel of Figure 1 as an example).
In the Main Survey, two samples, BGS bright and BGS faint, are selected (Hahn et al., 2022). The VI quality distributions for the BGS bright and faint targets satisfying the Main Survey selection are shown in black and purple respectively. The fraction of BGS bright and faint sources having VI quality is found to be 99.7%. We note that the BGS bright sample yields a lower fraction of VI robust redshifts (i.e. VI quality ) than the BGS faint sample. This is expected given that the BGS bright sample is selected based on a minimum set of simple selection criteria for cosmological analysis. On the other hand, the BGS faint sample is designed to use special color-magnitude selection criteria to maximize the redshift success rate of the sample (Hahn et al., 2022).
The top right panel of Figure 4 shows the redshift distributions of the BGS targets in the SV and Main Survey selections with robust VI redshifts. The median redshifts of the SV and Main Survey selections are 0.24 and 0.22, respectively. Both redshift distributions extend to .
3.2 Luminous red galaxies (LRGs)
For LRGs, we visually inspect 3561 spectra from two tiles. The cumulative effective exposure time is s for both tiles, about 7 times longer than the designed nominal exposure time of s. The middle two panels of Figure 4 show the VI qualities and redshifts of the LRGs in both SV (faint orange) and Main Survey (orange) selections. With the SV selection, of LRG spectra have VI quality . The remaining of the sources are mostly faint galaxies (22 magnitude in z-band) with no obvious spectral features detected. Similar to the BGS survey, a brightness cut has been adopted for the LRG selection in the Main Survey. With the Main Survey selection, of LRG spectra have VI quality. The median redshifts of the SV and Main Survey selections for LRGs in the VI catalog are 0.78 and 0.82, respectively. The redshift distributions both extend to .


3.3 Emission line galaxies (ELGs)
The DESI survey will target ELGs which have not been extensively studied up to this point, particularly at . Therefore, an extended selection of ELG targets is applied in the SV observations. Figure 5 shows the selection with and colors for the SV ELG targets. We visually inspect 10315 spectra of SV ELG targets spanning a wide range of this color-color space from three tiles with cumulative exposure times ranging from to s. Among all the visually inspected ELG spectra, of them have VI quality . The remaining are mostly featureless spectra which are likely from galaxies at or galaxies with weak spectral features which are beyond the detection limit. The VI quality and redshift distributions of ELGs are as shown in the lower panels of Figure 4.
The fraction of ELGs with VI quality depends on the observed colors of the targets as shown in the top panel of Figure 5. The colors in the figure indicate the fraction of sources with VI quality in each bin. As can be seen, galaxies with redder g-r and r-z colors in the top right corner have a larger fraction of visually-identified redshifts; these are lower-redshift galaxies with multiple emission lines in the spectral coverage of the DESI spectrograph.
The dashed lines in the figure are the boundaries in the color-color space for the Main Survey ELG selection. The ELG Main Survey consists of two selections, LOP and VLO (Raichoor et al., 2022), which are the names for targeting bits (Myers et al., 2022), indicating their fiber assignment priorities (’LOw Priority‘ and ‘Very-LOw priority’) in the DESI survey.
The LOP selection, indicated by the blue shaded region in Figure 5, is designed to select ELGs at (the bottom right panel of Figure 4) with a target density of approximately 1950 . The motivation of this selection is to maximize the number of ELG spectra with recoverable redshifts at , a redshift range that is mostly probed by ELGs via [O II] emission lines, with the designed Main Survey exposure time (Raichoor et al., 2022). This LOP ELG is the main ELG sample designed for cosmological measurements. On the other hand, the VLO selection (the green shaded region in Figure 5) includes galaxy targets with redder colors than the LOP targets. Therefore, the VLO selection includes ELGs at slightly lower redshifts , with a higher redshift recovery rate than the LOP selection. Moreover, the VLO ELG sample has a lower observation priority than the LOP ELG sample in the main DESI survey. We note that while galaxies with have high density and high VI recoverable redshift rate, they are at redshifts lower than the main redshift range of interest probed by the DESI ELG samples.
The bottom panel of Figure 5 shows the redshifts of galaxies with VI quality at the 75th percentile in each color bin. As can be seen, the two ELG Main Survey selections encompass the parameter space which yields recoverable redshifts within the desired range and at relatively high target density. This is also reflected in the bottom right panel of Figure 4, which shows that this main selection includes ELGs mostly at with about of sources being low-z galaxies and quasars () . In the LOP and VLO Main Survey selections, and of ELG targets have VI quality respectively (see Table 2 for details).
4 Validating the DESI survey design with VI catalogs
We use the VI galaxy catalogs obtained from DESI spectra with long exposure times to validate the performance of the algorithm, Redrock (Bailey et al., 2023), that DESI adopts for recovering the redshifts of galaxies at the designed nominal exposure times, i.e. effective exposure time s for ELGs (Raichoor et al., 2022) and LRGs (Zhou et al., 2022) and s for bright galaxies (Hahn et al., 2022). For those galaxies with deep co-added spectra, we use all the data from individual exposures to produce several spectra with similar exposure times to the designed exposure time of the Main Survey. For ELGs and LRGs, we use spectra with and for BGS, we use spectra with . In this way, one galaxy target has multiple redshift measurements from the Redrock algorithm, and we can then compare the redshift measurements from the pipeline with the VI redshift to assess the performance of the DESI observation and data pipeline.
There are two key quantities from Redrock used in this data assessment:
-
•
Redrock redshift: the best-fit redshift of the spectrum from Redrock,
-
•
: the difference between the value of the 2nd best-fit model and the value of the 1st best-fit model, . A larger means that the 1st best-fit model better describes the data than the 2nd best-fit model. The parameter is an important parameter for identifying robust redshifts as described below.
4.1 Redshift recovery rate
We first estimate the redshift recovery rate, i.e. the fraction of robust VI redshifts (VI quality ) that are recovered by Redrock from spectra with Main Survey exposure times:
| (2) |
where the redshift difference () between the VI redshifts and Redrock redshifts is defined as
| (3) |
In this calculation, we exclude sources identified as stars by the Redrock pipeline.
The redshift recovery rates for the Main Survey selections are
-
•
BGS bright: 98.10.3%,
-
•
BGS faint: 99.40.3%,
-
•
LRG main: 98.90.2%,
-
•
ELG LOP: 93.80.2%,
-
•
ELG VLO: 97.50.3%.
These high redshift recovery rates indicate that the Main Survey exposure times are sufficient for obtaining spectra with spectral features that can be automatically detected and identified by Redrock.
We note that there are two main reasons for sources with : (1) some of the spectra are not deep enough to robustly detect spectral features and therefore Redrock can not identify the true redshifts, and (2) some of the spectra are affected by artifacts introduced during the calibration process. Those spectral artifacts drive the best-fit models and the corresponding redshifts. In Section 5, we will show some examples of spectra with artifacts that were found during this analysis and VI process.
4.2 selections
Most spectra obtained from the DESI Main Survey will not have VI validated redshifts. Therefore, one of the key tasks during the SV phase is to use the VI catalogs to identify the combination of Redrock values and other parameters from DESI spectra that we can use as a selection criterion in order to (1) include most of objects with redshifts successfully identified by Redrock and (2) exclude most objects with incorrect redshifts. To this end, we define the following quantities:
| (4) | |||
and
| (5) | |||
The good redshift inclusion fraction indicates the fraction of Redrock recovered redshifts that would be included in the sample if we apply a selection criterion, e.g. . A higher value means higher efficiency of obtaining sources with correct redshifts from the automatic Redrock redshifting algorithm.
| Targets | Selection | Good redshift | Good redshift | Redshift | Redshift | Redshift |
|---|---|---|---|---|---|---|
| inclusion fraction | purity | efficiency | precision | accuracy | ||
| BGS | bright | 97.20.4% | 100% | 87.00.8% () | 9.20.5 km/s | 6.51.7 km/s |
| faint | 94.80.8% | 99.90.1% | 87.71.1% () | 8.50.7 km/s | ||
| LRG | main | 99.20.1% | 99.60.1% | 86.40.5% () | 36.70.6 km/s | -3.03.3 km/s |
| ELG | LOP | 94.30.3% | 99.60.1% | 67.00.5% () | 6.80.1 km/s | -1.00.4 km/s |
| 35.50.5% () | ||||||
| ELG | VLO | 97.90.3% | 99.90.1% | 93.40.5% () | 8.40.2 km/s | |
| 20.40.8% () |
On the other hand, the good redshift purity indicates the fraction of objects with validated Redrock redshifts that pass the selection criterion, e.g., , compared to all Redrock redshifts passing the selection criterion. A higher value means that the selected sample has a higher fraction of sources with correct redshifts. We emphasize that the value is the key quantity that helps us assess the reliability of redshifts for most of the spectra obtained by the DESI survey. Therefore, it is crucial to estimate the good redshift purity to ensure the success of redshift determinations.
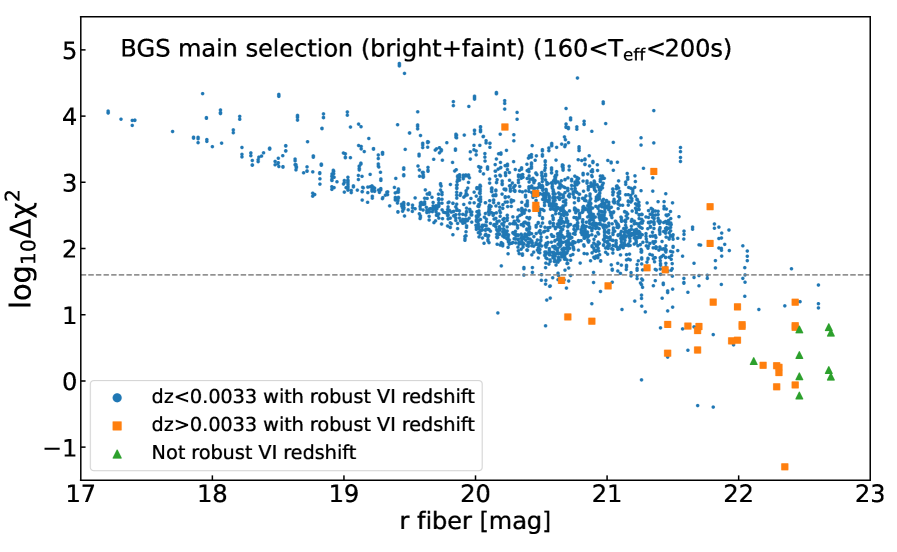
To assist the interpretation of these two quantities, we show the values as a function of observed magnitudes of BGS in the top panel of Figure 6. The blue data points show objects with and VI quality (good Redrock redshifts), and the orange squares and green diamonds indicate objects with and VI quality, and VI quality (not robust VI redshift) respectively. As can be seen, most systems with confirmed Redrock redshifts tend to have high values and most systems with incorrect redshifts tend to have low values. In the following, we describe the current adopted selection for each target. The corresponding inclusion fraction and purity values are summarized in Table 3. Sources identified as stars by the Redrock pipeline are excluded in the calculation.
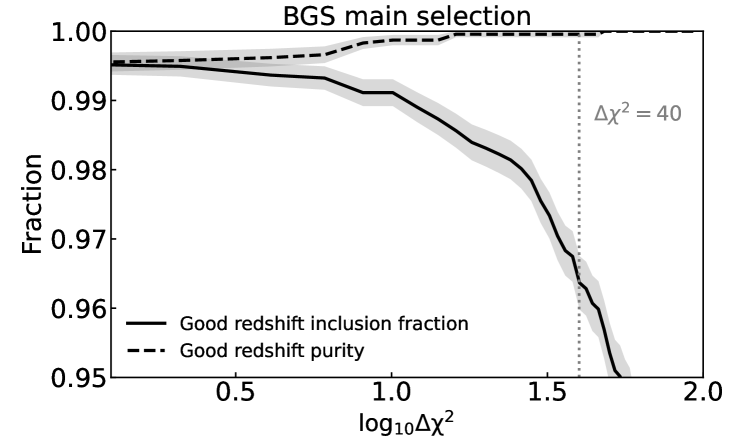
Results for BGS — To estimate the redshift purity and inclusion fraction, we include redshift measurements from in the selection criteria (see also Hahn et al., 2022): . The top panel of Figure 7 shows the good redshift inclusion fraction and good redshift purity for BGS as a function of . As expected, the good redshift inclusion fraction decreases with increasing . Similarly, the redshift purity increases with since most of the inconsistent redshifts are excluded in the samples with a high threshold. We note that the redshift purity of the BGS sample is always and the good redshift inclusion fraction is also very high ().
As can be seen, adopting different thresholds for BGS will yield samples with different purity and inclusion fraction values as well as the number of sources in the sample. Currently, the DESI survey adopts the threshold for BGS as indicated by the vertical grey dashed line in Figure 7. This threshold will yield high redshift purity samples for both BGS bright and faint galaxies (nearly ).
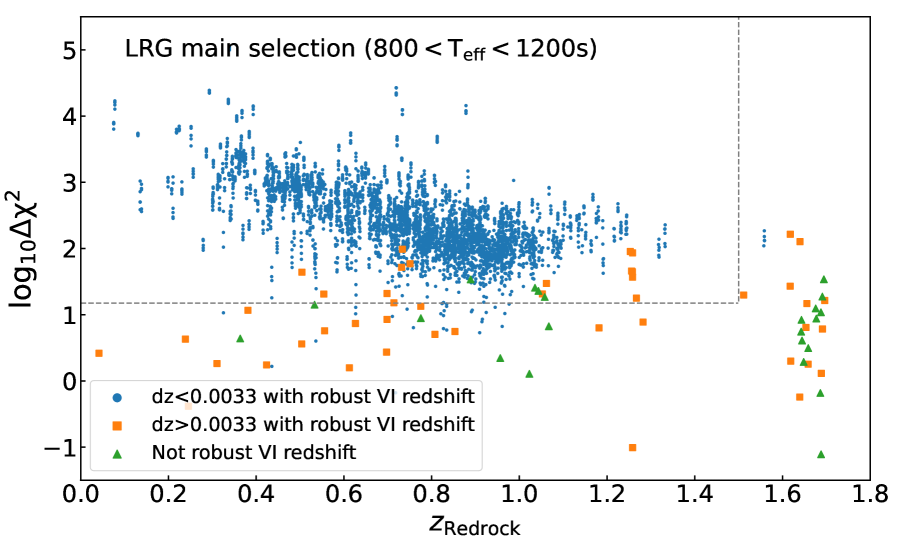
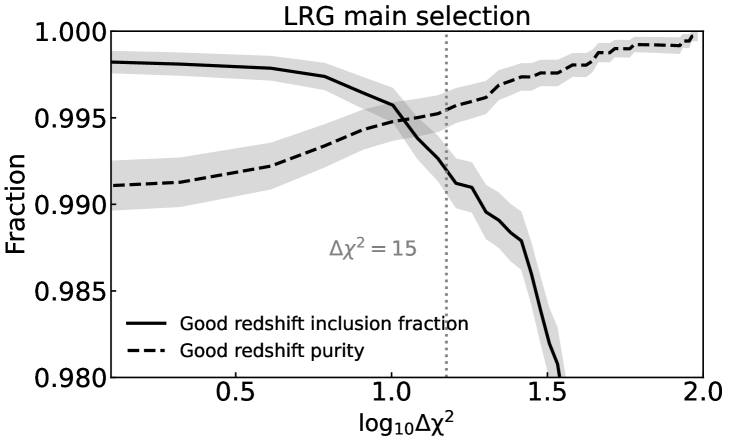
Results for LRGs — Similarly to BGS, for LRGs, we include the redshift measurements from in the selection criteria (see also Zhou et al., 2022): . The middle panel of Figure 7 shows the good redshift inclusion fraction and good redshift purity of LRGs as a function of and the vertical dashed line shows the current adopted value . This adopted selection is shown by the dashed line in the middle panel of Figure 6, yielding a sample of LRGs with the inclusion fraction and purity values .
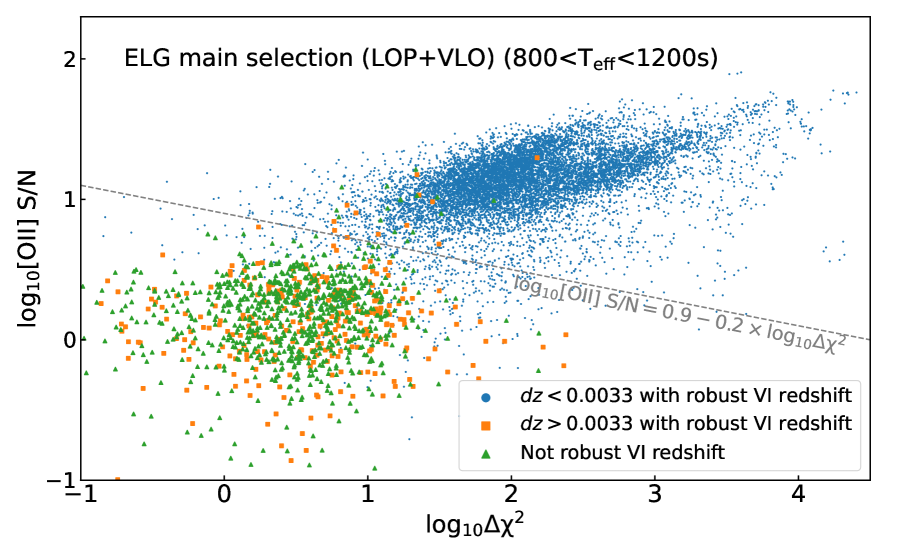
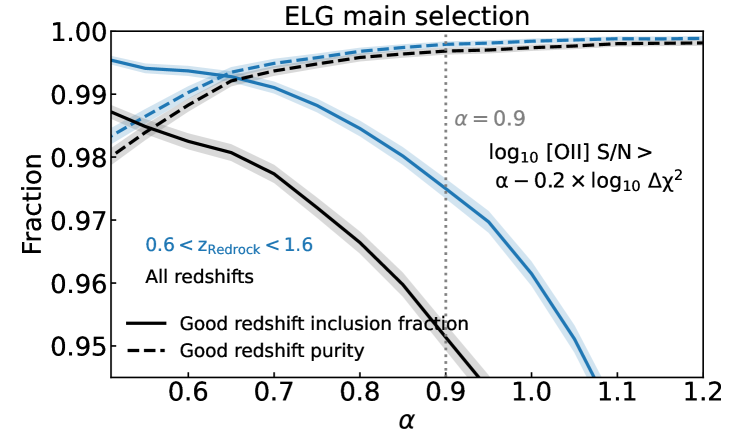
Results for ELGs — For ELGs, we find that a joint constraint of the signal to noise ratio of [O II] emission line doublet ([OII] S/N) and is more efficient for selecting high inclusion fraction and redshift purity sample than a single constraint from (Raichoor et al., 2022). This is because a fraction of the ELG spectra only have [O II] emission lines without any detectable continuum flux. These spectra yield low but with [O II] emission lines that can be robustly detected. The emission line properties are obtained via a line-fitting algorithm used in the DESI pipeline (Section 6.3 Raichoor et al., 2022). The bottom panel of Figure 6 shows that the successful Redrock recovered redshifts (blue data points) and the inconsistent redshifts of ELGs (green diamonds and orange squares) can be separated by a function,
| (6) |
To illustrate how the good redshift inclusion fraction and the redshift purity values depend on the parameters, in the bottom panel pf Figure 7, the black lines show the values of ELGs at all redshifts as a function of with a fixed and the blue lines show the results of the main survey ELG sample with Redrock redshifts between 0.6 and 1.6. We note that the difference between the good redshift inclusion fraction values of ELGs at all redshifts and ELGs with is due to the fact that most ELGs with have strong [O II] emission lines which allow them to pass the selection criterion. Currently, we adopt the following selection for ELGs (Raichoor et al., 2022):
-
•
ELGs: .
For ELGs at all redshifts, this selection yields an ELG LOP sample with redshift purity and good redshift inclusion fraction and an ELG VLO sample with redshift purity and good redshift inclusion fraction . For ELGs with , this selection yields an ELG LOP sample with redshift purity and good redshift inclusion fraction and an ELG VLO sample with redshift purity and good redshift inclusion fraction .
4.3 Redshift efficiency
Previously, we have used the redshift inclusion fraction and the redshift purity to quantify the properties of the DESI data with given selection criteria, demonstrating that we can obtain samples of BGS, LRGs, and ELGs with high purity values ().
We now define a quantity which allows us to address the following question: for all the galaxy targets that were observed by DESI with nominal exposure times, what is the fraction of sources that
-
1.
pass the selection criteria,
-
2.
have their true redshifts recovered by Redrock ( and VI quality ), and
-
3.
have redshifts within the desired ranges for cosmological measurements .
We define the redshift efficiency,
| (7) |
where is the number of spectra that satisfy the three conditions listed above, and is the total number of observed spectra of a given target type.
The values of the redshift efficiency for BGS, LRGs, and ELGs are summarized in Table 3. We find that for BGS with and LRGs with , the redshift efficiency is higher than . For ELG LOP and VLO samples with , the redshift efficiency values are and , respectively. Together with the target density and the fiber assignment rate, these redshift efficiency values are used to estimate the final galaxy densities with redshifts. The final estimations of galaxy densities are described in DESI Collaboration et al. (2023) and the target selection papers of each tracer, Hahn et al. (2022), Raichoor et al. (2022), and Zhou et al. (2022).
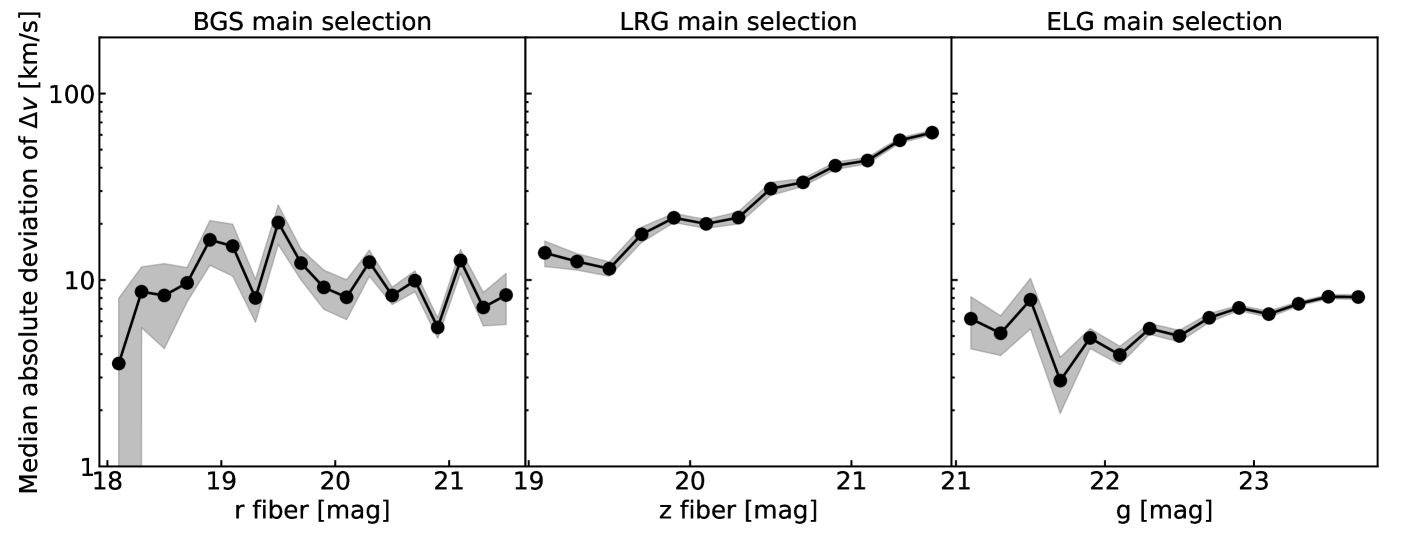
4.4 Redshift precision
We now estimate the random error (1) of the Redrock redshift measurements of galaxies selected in the Main Survey. To do so, we make use of the redshift measurements of the multiple individual spectra of the same target from the SV observation listed in Table 1. Each spectrum has an effective exposure time similar to the effective exposure time of the Main Survey and the corresponding redshift passes the selection criteria described in Sec 4.2. We compare the redshift differences between all the pairs of Redrock redshift measurements, e.g. and then use the median absolute deviation (MAD), an estimator which is less sensitive to outliers, to estimate the dispersion of the distribution. Note that the MAD value is scaled to the standard deviation to reflect the 1 error. Finally, we divide the MAD value by because the dispersion of includes the errors of two redshift measurements:
| (8) |
Figure 8 shows the final MAD values of BGS, LRGs and ELGs as a function of galaxy brightness. As shown in the figure, the random errors of redshift measurements of BGS, ELGs, and LRGs are about , , and km/s respectively.
4.5 Redshift accuracy
In addition to the random error of redshift measurements, we investigate the Redrock redshift systematic inaccuracy of galaxies. While it is impossible to obtain the true redshifts of DESI galaxies and to assess the intrinsic redshift systematic uncertainty, we can compare the redshift measurements of DESI with the measurements from other surveys with similar spectral resolution and independent pipelines and obtain relative redshift systematic uncertainty between two instruments.
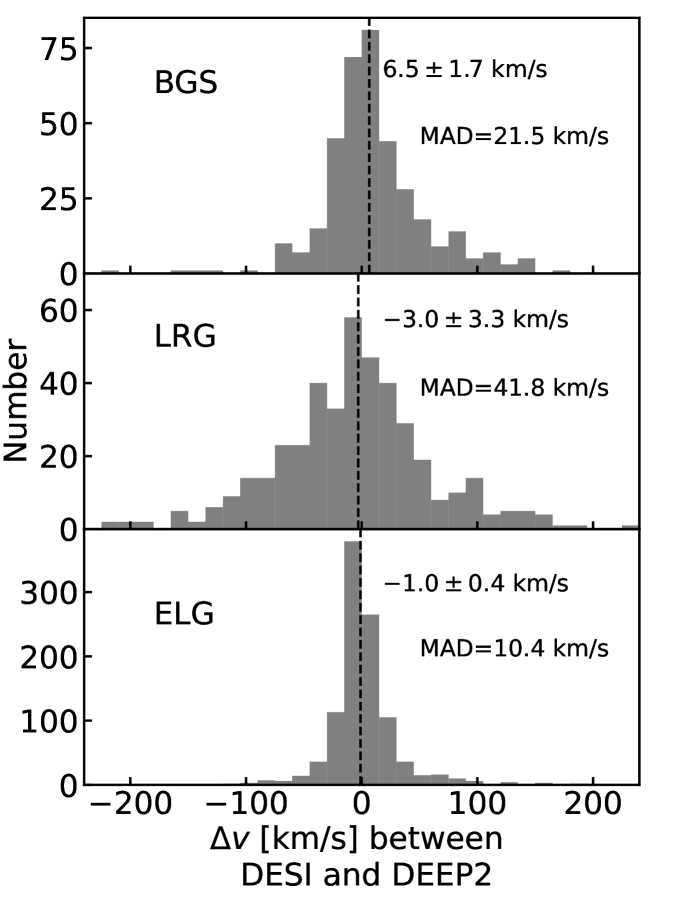
To do so, we use the DEEP2 redshift measurements (Newman et al., 2013) with redshift quality and cross-match DEEP2 galaxies with galaxies observed by DESI. Here we use the galaxy data from DESI One-Percent Survey (DESI Collaboration et al., 2023) to increase the number of redshift pairs. We only use the redshift measurements that pass the selection criteria for BGS, LRGs and ELGs. In total, there are approximately 1800 DEEP2-DESI redshift pairs, including about 400 BGS, 400 LRGs and 1000 ELGs. Figure 9 shows the distributions of redshift differences between DEEP2 and DESI for BGS, LRGs, and ELGs. The vertical dashed lines show the median values of the redshift differences: 6.5 km/s, -3.0 km/s, and -1.0 km/s for BGS, LRGs, and ELGs respectively. The median absolute deviation of the redshift differences includes the redshift uncertainties of DESI and DEEP2 measurements. The MAD values are larger than the random error of the DESI redshift measurements as shown in Figure 8 due to the contribution from the DEEP2 redshift uncertainties (Newman et al., 2013).
This result indicates that the relative redshift systematic uncertainty between DESI and DEEP2 is within 10 km/s. Given that DEEP2 and DESI use two independent instruments and pipelines, the redshift consistency between the two suggests that the measured redshifts from the two surveys are close to the true redshifts with systematic redshift uncertainty km/s.
5 Assisting the development of the DESI pipeline
Visually inspecting the DESI spectra is a crucial step in identifying unforeseen problems in the dataset and to further help the development and improvement of the data pipeline. To demonstrate the importance of VI, here we list two major issues which were identified by VI:
-
•
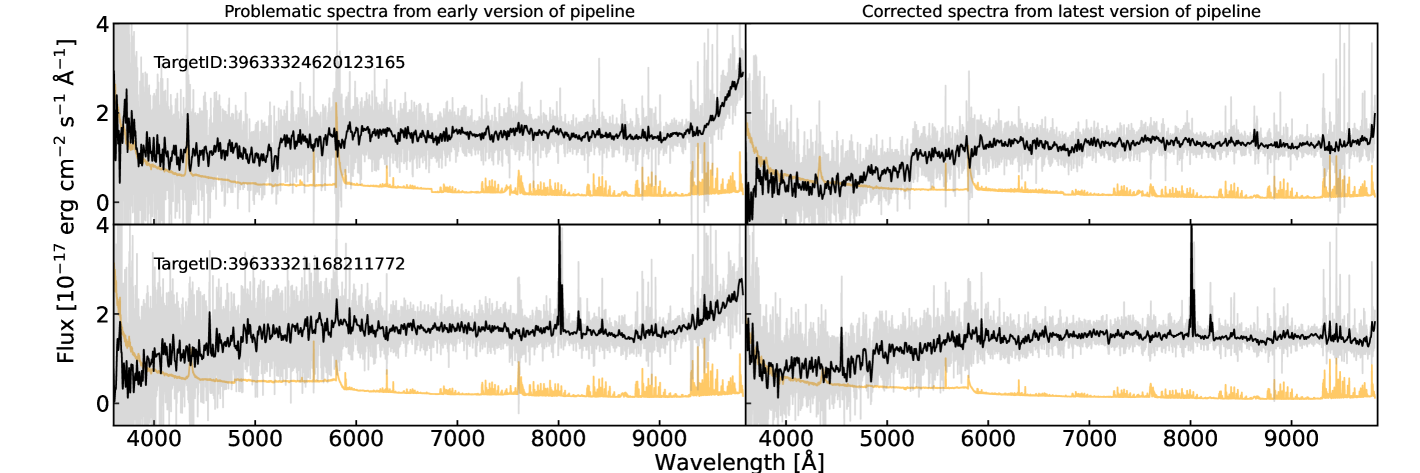
Artificial excess of flux in z-band: While visually inspecting spectra processed by an early version of the pipeline, we identified that 1-2% of BGS spectra showed a non-physical increase in flux in the z-band, as shown in the left panel of Figure 10. This non-physical feature led to erroneous estimates of the redshift using the Redrock algorithm as it simulates a strong break. After investigation, we identified that this feature is due to the contamination of flux from adjacent fibers targeting bright stars. The data pipeline was updated to properly model this effect (Guy et al., 2022). The right panel of Figure 10 shows the spectra of the same targets as shown in the left panel but processed by the latest version of the pipeline. This pipeline improvement reduces the catastrophic failure rate of BGS redshifts by a factor of three.
-
•
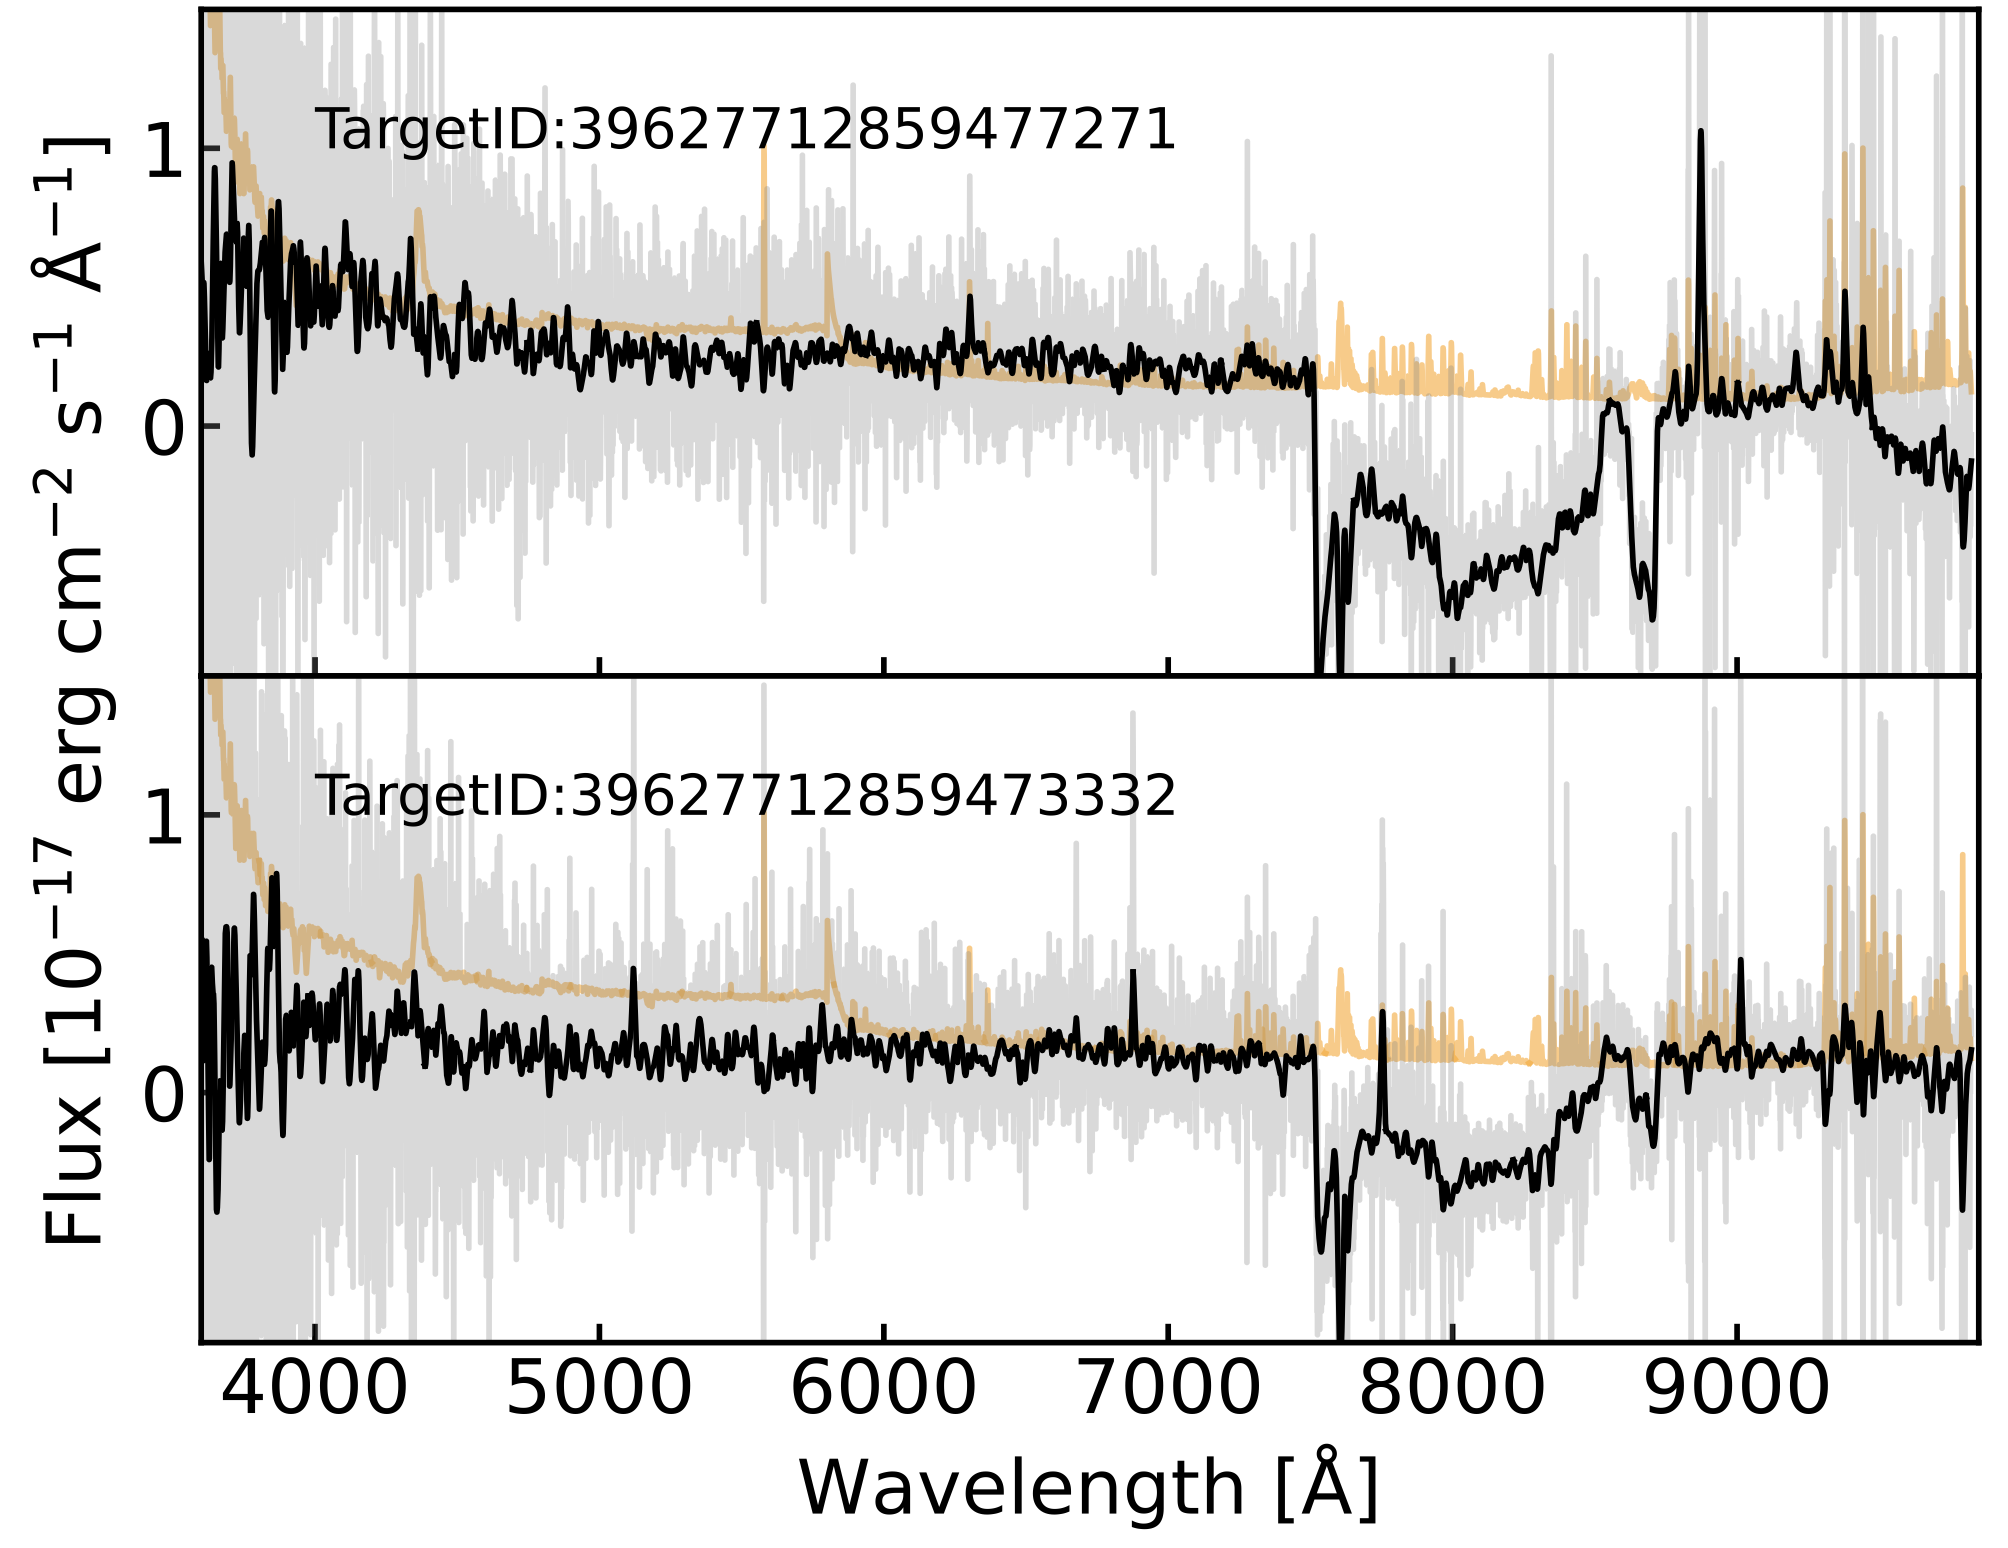
Spectra affected by a CCD issue: During the VI process, we identified spectra with unexpected spectral features around as shown in Figure 11, causing Redrock to fit incorrect redshifts. About 0.5% of spectra reduced by an early version of the DESI pipeline have such features. We find that these problematic spectra tend to be obtained from a certain set of fibers and are due to a region of CCD with issues, which were not identified and properly masked. The spectra affected by this problem are now masked by the data pipeline and will not be used in the redshift catalogs (Guy et al., 2022).
These results demonstrate that the visual inspection process is crucial for identifying unexpected problematic features which can affect the quality of the data product. Without VI in the early development of the project, it would be difficult to find such problems in the dataset.
6 Rare objects identified by VI
In addition to revealing nonphysical spectra, the visual inspection process also helped us identify unexpected sources that live in the same parameter spaces as the DESI targets. Here we show two types of rare sources that were identified during the VI process:
-
•
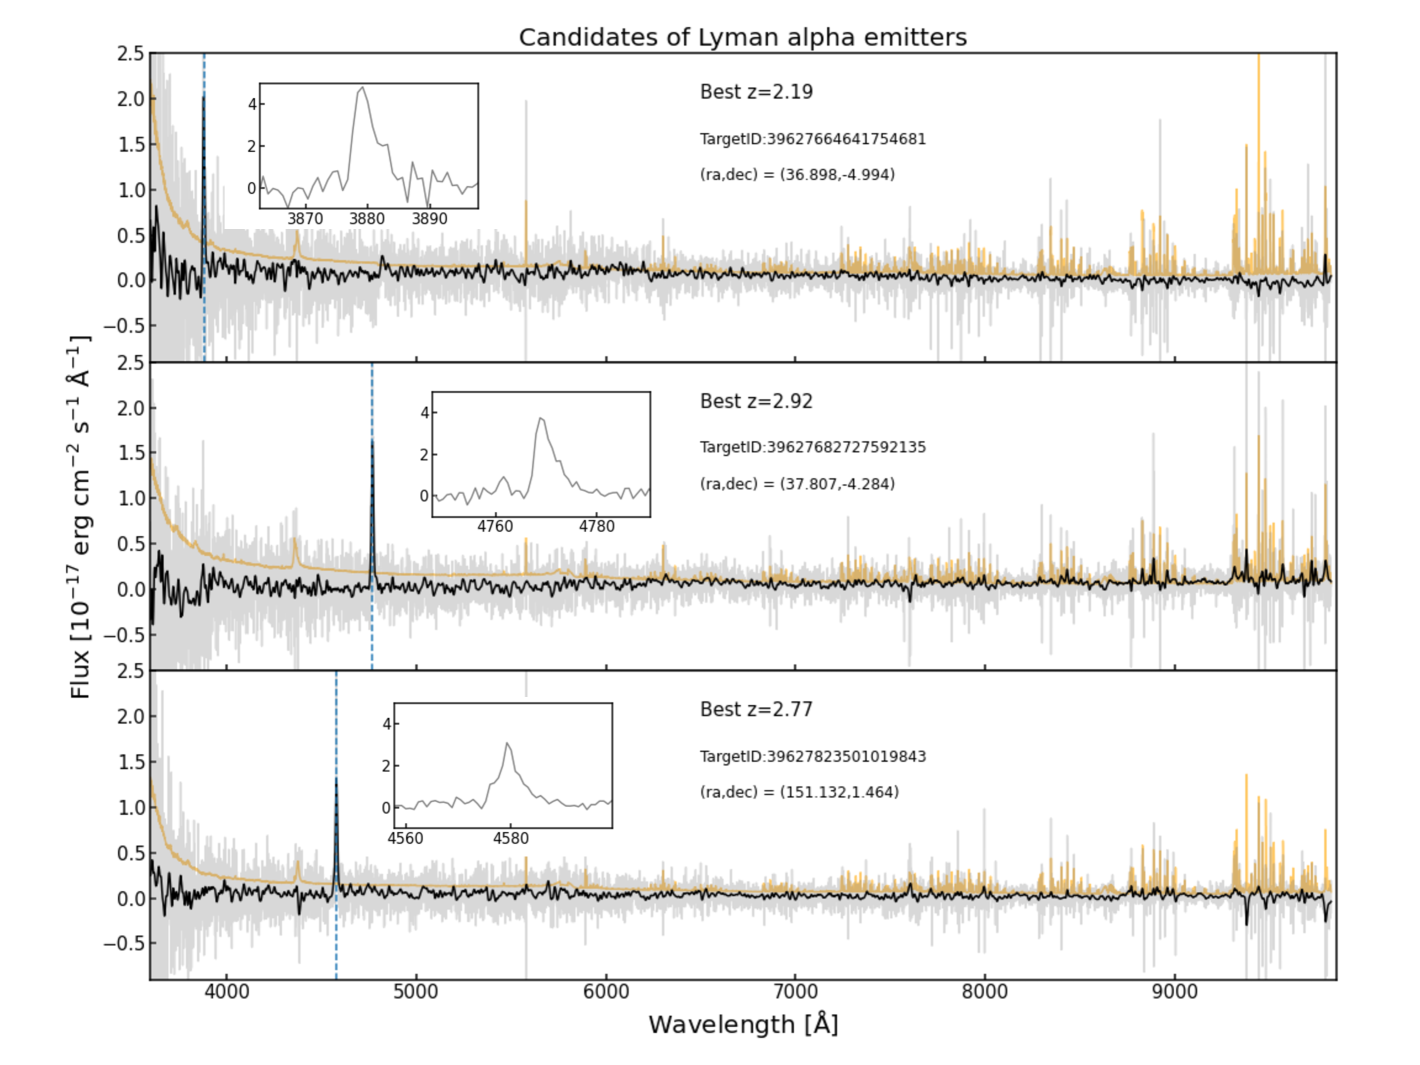
Candidates of Lyman emitters: We find about 60 spectra that show one strong, asymmetric emission line feature at about 4000-5000 in observed wavelengths. These spectra are consistent with the spectra of Lyman emitters, a star-forming galaxy population that produces a strong Lyman emission line (e.g., Leclercq et al., 2017; Ouchi et al., 2020). Figure 12 shows examples of these spectra. This detection demonstrates that it is possible to use DESI to detect Lyman emitters and potentially use them as mass tracers at for probing structure formation (e.g., Hill et al., 2008).
-
•
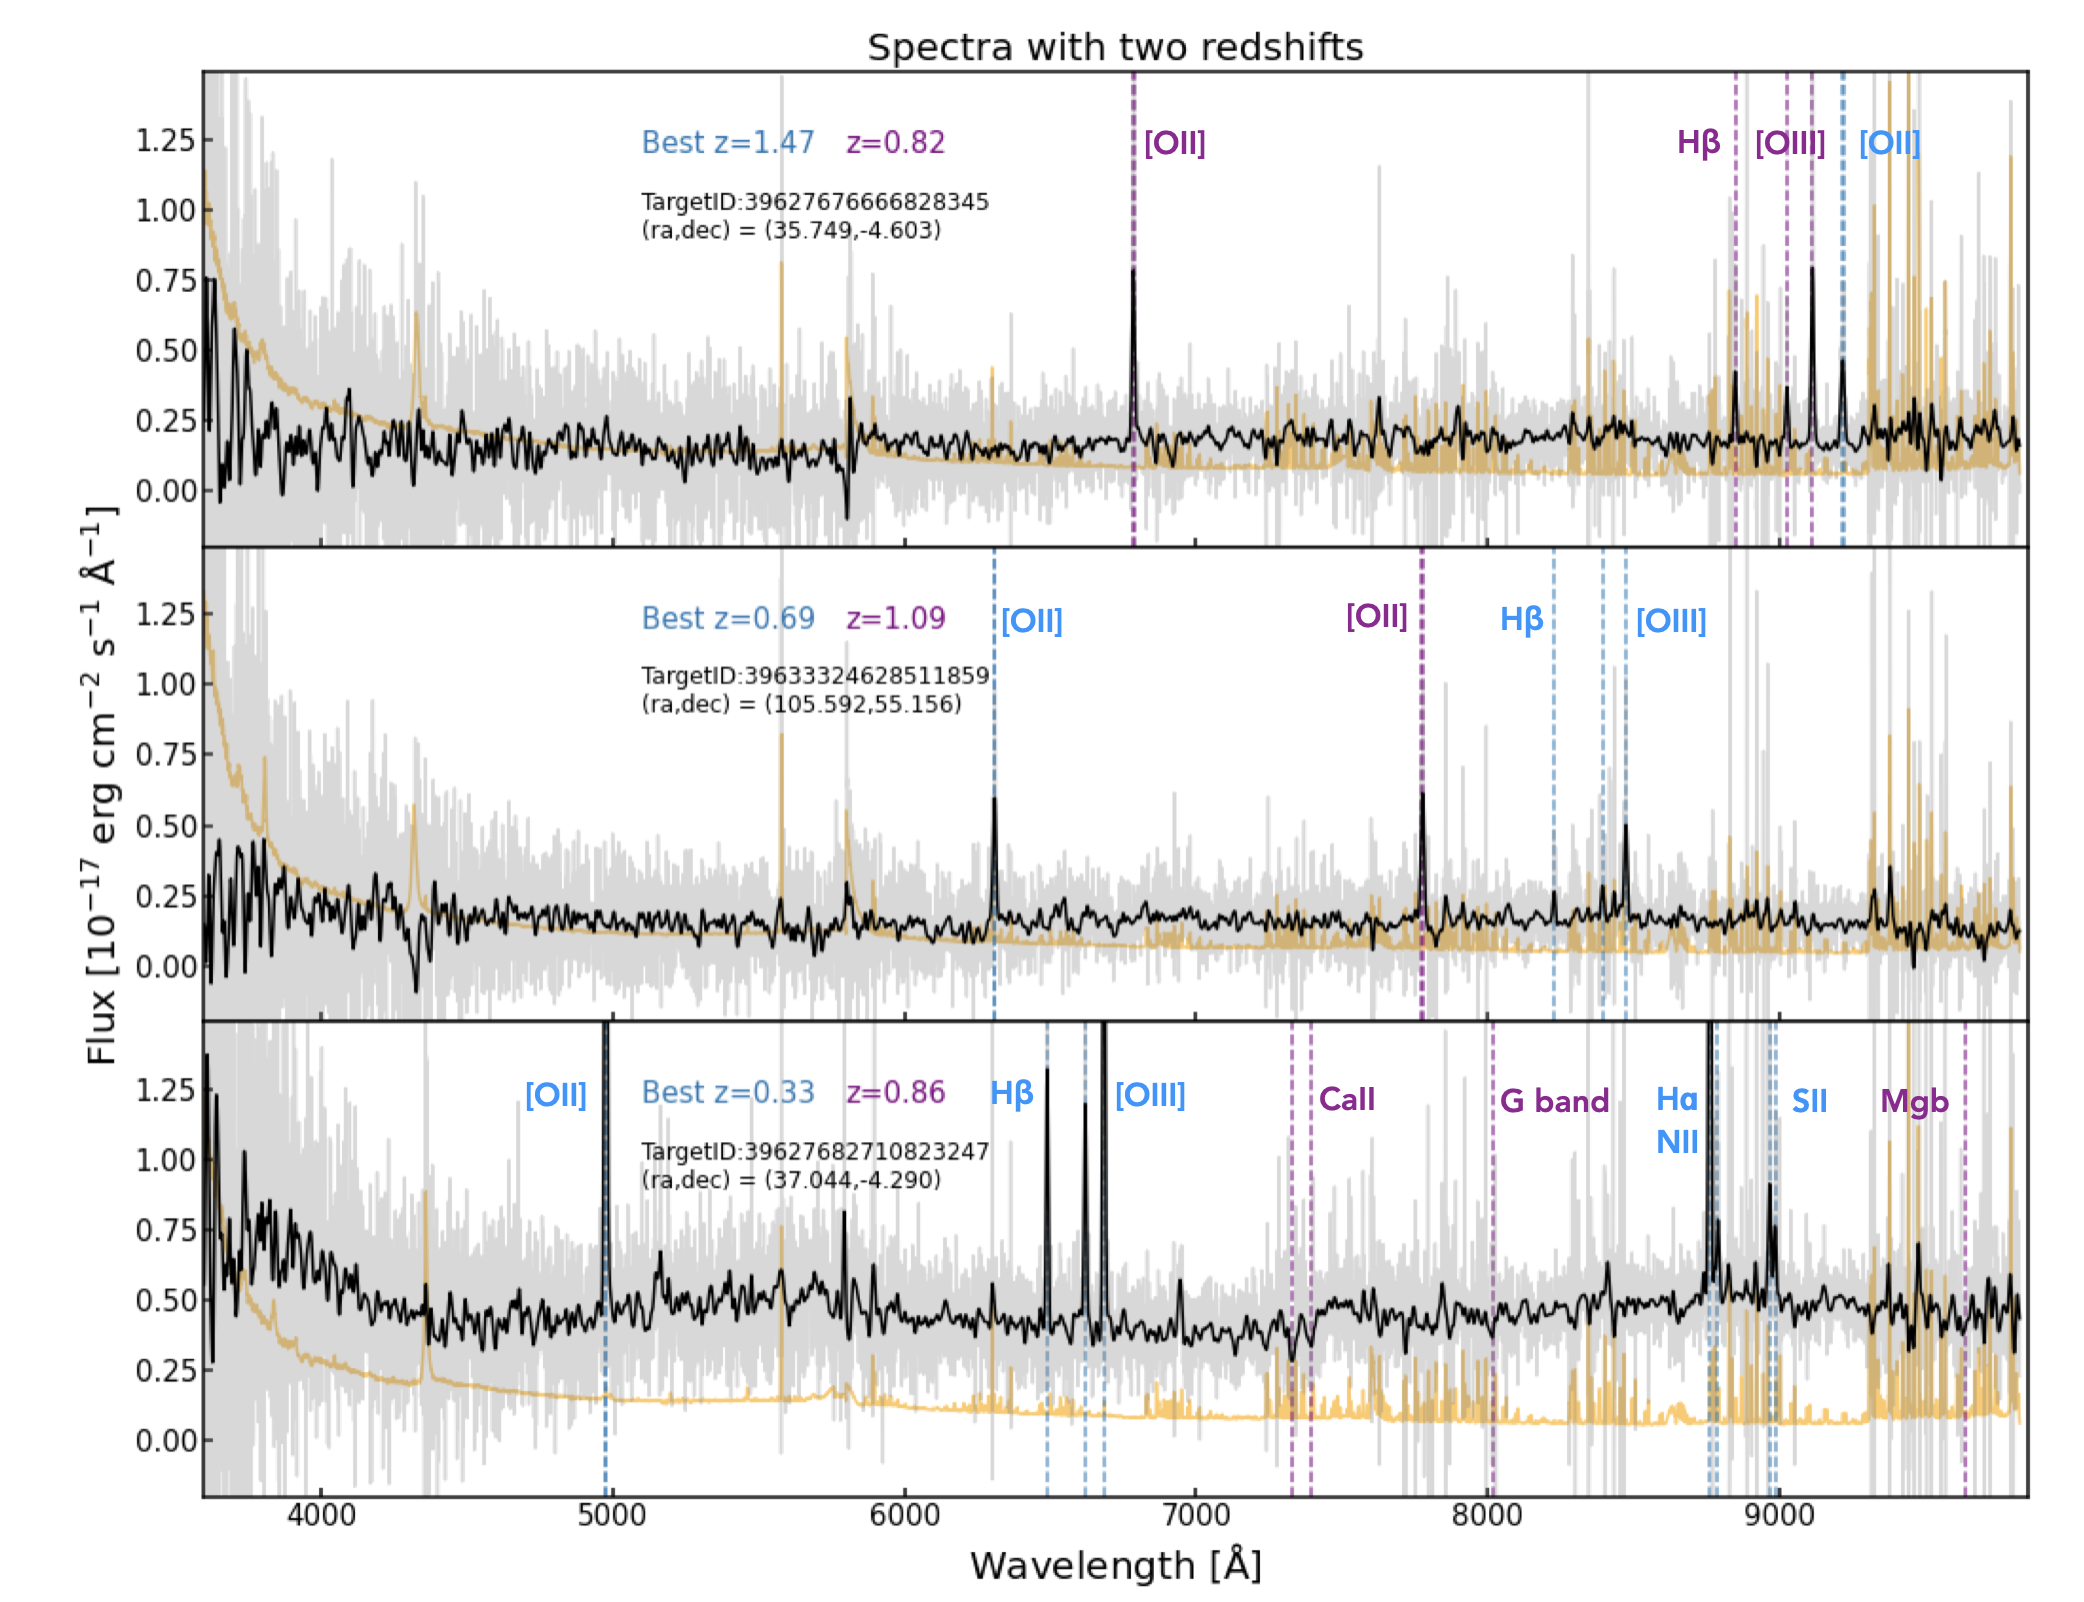
Spectra with two redshifts: We also identify about 200 spectra comprised of two objects at two distinct redshifts, examples of which are shown in Figure 13. The purple dashed lines correspond to the spectral features of one galaxy and the blue dashed lines correspond to the features of another galaxy. These sources are lensing system candidates (e.g., Bolton et al., 2008; Brownstein et al., 2012; Talbot et al., 2018). If confirmed, these sources can be used to probe the stellar mass and dark matter mass around foreground galaxies, especially for the halos of star-forming galaxies at which are rarely explored via strong lensing.
We note that for most of the Lyman emission spectra, Redrock fails to obtain the correct redshifts due to the fact that this unusual spectral feature is not included in the templates. We plan to add these VI identified spectra of potential Lyman emitters into the Redrock templates. By doing so, future versions of Redrock may automatically identify similar spectra. For the spectra with two redshifts identified by VI, Redrock reports one of the redshifts that has dominated spectral features.
7 Conclusions
During the Survey Validation of the DESI survey, we visually inspected approximately 17,000 DESI spectra of galaxy targets and thereby compiled VI redshift catalogs. These catalogs enable us to perform various statistical measurements for characterizing the performance of the DESI observational system. Here we summarize our main results:
-
•
We show that the redshifts of of BGS, of LRGs and of ELGs with long-exposure spectra observed in the SV observations can be identified from the VI process. These VI redshift catalogs are used to help define the selections for the Main Survey. In the Main Survey selections, the redshifts of of BGS and LRGs can be visually identified and the redshifts of of LOP ELGs and of VLO ELGs can be visually identified.
-
•
We use the VI redshift catalogs to characterize the performance of the DESI Main Survey design and the Redrock algorithm. The results show that with the current selected criteria combining and other parameter values, the DESI survey can obtain samples of BGS, LRGs, and ELGs with purity .
-
•
Utilizing the spectra of the same targets obtained from multiple independent exposures, we quantify the precision of the redshift measurements from the Redrock algorithm. The results show that the precision of the redshift measurements of BGS and ELGs is about 10 km/s and that of LRGs is about 40 km/s.
-
•
We empirically test the accuracy of the redshift measurements from the Redrock algorithm by comparing the Redrock redshifts to the redshift measurements of the DEEP2 survey, using galaxies observed in both surveys. The results show that the systematic redshift differences from the two surveys are less than 10 km/s for BGS, LRGs, and ELGs.
-
•
Via the VI process, we identify spectra with non-physical features. These identifications help us reveal and fix issues in both the software and hardware of the early DESI data pipeline that were not anticipated. In addition, we find spectra of rare astronomical objects, including candidates of Lyman emitters and spectra with two redshifts as potentially strong lensing candidates. These spectra illustrate the scientific potential offered by the DESI dataset.
These results illustrate the utility and necessity of performing systematic visual inspections of astronomical datasets, especially during the early phase of sky surveys. As demonstrated in this work, the VI redshift information is essential for testing the redshift measurements from the pipeline and for identifying both spurious features in the reduced spectra and unexpected astronomical phenomena.
These VI catalogs will have a lasting impact. They will be used to perform the same statistical measurements every time the DESI pipeline is upgraded throughout the whole DESI operation. By doing so, we can confirm the stability of the DESI pipeline and assess the improvement quantitatively. The catalogs can also be used to train novel machine learning models of detecting and identifying spectral features. Finally, with this experience of visually inspecting DESI spectra, we recommend that upcoming spectroscopic surveys, such as PFS (Takada et al., 2014), SDSS-V (Kollmeier et al., 2017), 4MOST (de Jong et al., 2016) and MOONS (Cirasuolo & MOONS Consortium, 2016), deploy similar VI efforts during the survey operations.
Data Availability
All data points shown in the figures are available at Zenodo https://doi.org/10.5281/zenodo.6618765.
TWL is supported by the Ministry of Science and Technology (MOST 111-2112-M-002-015-MY3), the Ministry of Education, Taiwan (MOE Yushan Young Scholar grant NTU-110VV007 and NTU-110VV007-2), National Taiwan University research grants (NTU-CC-111L894806, NTU-111L7318, and NTU-112L7302), and NSF grant AST-1911140. DMA acknowledges the Science Technology and Facilities Council (STFC) for support through grant code ST/T000244/1.
This research is supported by the Director, Office of Science, Office of High Energy Physics of the U.S. Department of Energy under Contract No. DE–AC02–05CH11231, and by the National Energy Research Scientific Computing Center, a DOE Office of Science User Facility under the same contract; additional support for DESI is provided by the U.S. National Science Foundation, Division of Astronomical Sciences under Contract No. AST-0950945 to the NSF’s National Optical-Infrared Astronomy Research Laboratory; the Science and Technologies Facilities Council of the United Kingdom; the Gordon and Betty Moore Foundation; the Heising-Simons Foundation; the French Alternative Energies and Atomic Energy Commission (CEA); the National Council of Science and Technology of Mexico (CONACYT); the Ministry of Science and Innovation of Spain (MICINN), and by the DESI Member Institutions: https://www.desi.lbl.gov/collaborating-institutions.
The authors are honored to be permitted to conduct scientific research on Iolkam Du’ag (Kitt Peak), a mountain with particular significance to the Tohono O’odham Nation.
The visual inspection is a collaborative effort contributed by DESI members. Here we summarize the key tasks for performing and coordinating the VI effort.
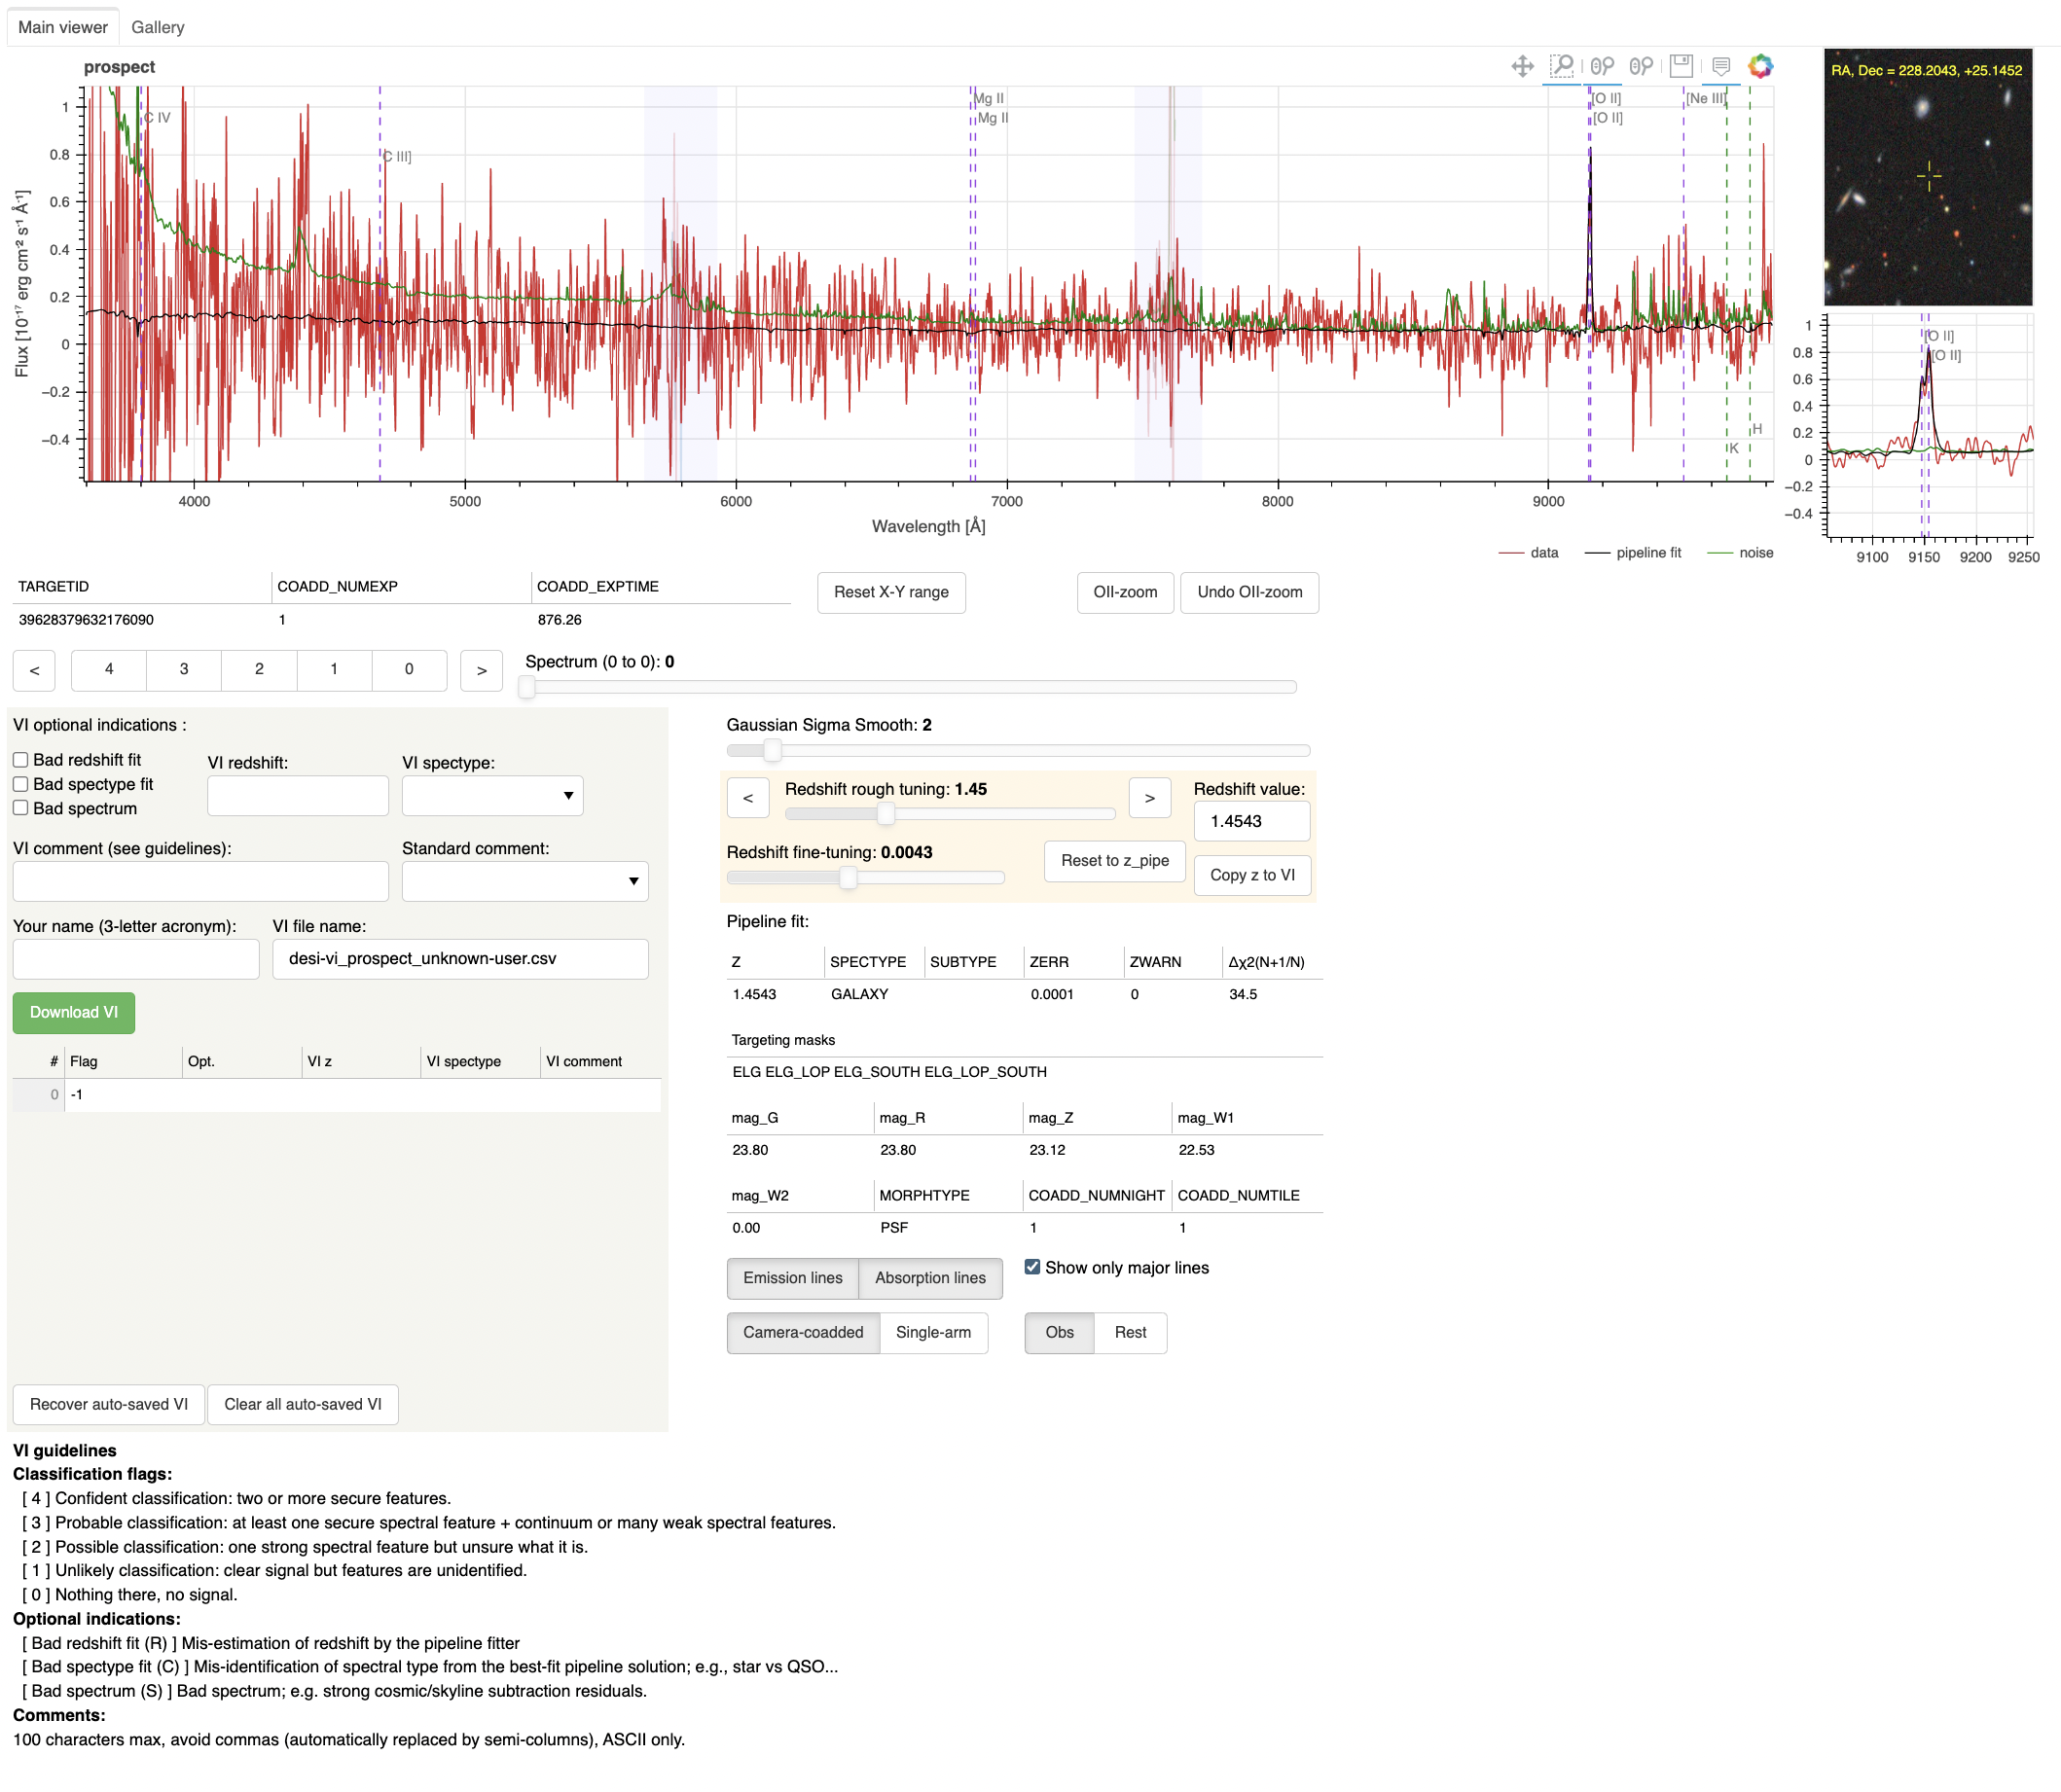
VI tool — A dedicated tool, Prospect333https://github.com/desihub/prospect, was developed to produce HTML pages containing the spectra and Redrock products to be inspected. Individual HTML pages typically include 50 spectra and are directly accessible by collaboration members from any web browser. Figure 14 shows an example of the HTML page. The main panel displays an individual spectrum, which can be smoothed by the inspector with a variable width Gaussian kernel. The associated noise at each wavelength, as derived from the processing pipeline, can be overlaid, as well as models matching the best fits from Redrock, and sets of emission and/or absorption lines. The associated imaging from the Legacy Survey (Dey et al., 2019) is displayed next to the spectrum. Inspectors can view relevant information from Redrock catalogs, including the ZWARN flag444https://github.com/desihub/redrock/blob/master/py/redrock/zwarning.py, which indicates whether or not the spectrum has issues found by the pipeline, and the best fit value with respect to second best fit. They can dynamically adjust the redshift for the displayed model and lines. The bottom left panel of the VI pages allows the inspectors to report relevant information, which is saved into an ASCII file for each set of 50 spectra.
Recruiting and training — To perform the VI, we recruited volunteers from the DESI collaboration. More than 50 DESI members had contributed to the visual inspection of galaxy spectra. In order to obtain consistent results from each inspector, we prepared materials for training the inspectors, including text documents with instructions and videos of experts performing VI and explaining the decision for each spectrum. Meetings were organized for the training as well. All inspectors were required to go through the materials before conducting the VI. After finishing the materials, they were asked to inspect 100 spectra for a given target type of their interest. Their results were then compared to the results from VI experts. If the inconsistent rates between the two results are lower than for BGS, and for ELGs and LRGs, the volunteers can start to perform VI after they reviewed the inconsistent results and agreed with the results. If the inconsistent rates were not lower than the thresholds, before starting the VI, the inspectors were asked to go through the training materials again and they would need to make sure that they understood the inconsistency. Each spectrum was at least inspected by two DESI members and one of the inspectors was an experienced astronomer who had worked on the specific target type. The results from the two inspectors were merged by the VI coordinators into the final VI results and the spectra with inconsistent results were resolved by the merger as described in the main text.
References
- Abareshi et al. (2022) Abareshi, B., Aguilar, J., Ahlen, S., et al. 2022, AJ, 164, 207. doi:10.3847/1538-3881/ac882b
- Aihara et al. (2019) Aihara, H., AlSayyad, Y., Ando, M., et al. 2019, PASJ, 71, 114. doi:10.1093/pasj/psz103
- Alexander et al. (2022) Alexander, D. M., Davis, T. M., Chaussidon, E., et al. 2022, arXiv:2208.08517
- Allende Prieto et al. (2020) Allende Prieto, C., Cooper, A. P., Dey, A., et al. 2020, Research Notes of the American Astronomical Society, 4, 188. doi:10.3847/2515-5172/abc1dc
- Bailey et al. (2023) Bailey et al. in prep 2023
- Blake et al. (2011) Blake, C., Davis, T., Poole, G. B., et al. 2011, MNRAS, 415, 2892. doi:10.1111/j.1365-2966.2011.19077.x
- Bolton et al. (2008) Bolton, A. S., Burles, S., Koopmans, L. V. E., et al. 2008, ApJ, 682, 964. doi:10.1086/589327
- Brownstein et al. (2012) Brownstein, J. R., Bolton, A. S., Schlegel, D. J., et al. 2012, ApJ, 744, 41. doi:10.1088/0004-637X/744/1/41
- Chaussidon et al. (2022) Chaussidon, E., Yèche, C., Palanque-Delabrouille, N., et al. 2022, arXiv:2208.08511
- Cirasuolo & MOONS Consortium (2016) Cirasuolo, M., & MOONS Consortium 2016, Multi-Object Spectroscopy in the Next Decade: Big Questions, Large Surveys, and Wide Fields, 507, 109
- Cooper et al. (2022) Cooper, A. P., Koposov, S. E., Allende Prieto, C., et al. 2022, arXiv:2208.08514
- Comparat et al. (2016) Comparat, J., Delubac, T., Jouvel, S., et al. 2016, A&A, 592, A121. doi:10.1051/0004-6361/201527377
- Dawson et al. (2016) Dawson, K. S., Kneib, J.-P., Percival, W. J., et al. 2016, AJ, 151, 44. doi:10.3847/0004-6256/151/2/44
- DESI Collaboration et al. (2023) DESI Collaboration et al. in prep. 2023
- de Jong et al. (2016) de Jong, R. S., Barden, S. C., Bellido-Tirado, O., et al. 2016, Proc. SPIE, 9908, 99081O
- Dawson et al. (2016) Dawson, K. S., Kneib, J.-P., Percival, W. J., et al. 2016, AJ, 151, 44. doi:10.3847/0004-6256/151/2/44
- DESI Collaboration et al. (2016a) DESI Collaboration, Aghamousa, A., Aguilar, J., et al. 2016, arXiv:1611.00036
- DESI Collaboration et al. (2016b) DESI Collaboration, Aghamousa, A., Aguilar, J., et al. 2016, arXiv:1611.00037
- Dey et al. (2019) Dey, A., Schlegel, D. J., Lang, D., et al. 2019, AJ, 157, 168. doi:10.3847/1538-3881/ab089d
- Driver et al. (2011) Driver, S. P., Hill, D. T., Kelvin, L. S., et al. 2011, MNRAS, 413, 971. doi:10.1111/j.1365-2966.2010.18188.x
- Eisenstein et al. (2001) Eisenstein, D. J., Annis, J., Gunn, J. E., et al. 2001, AJ, 122, 2267. doi:10.1086/323717
- Eisenstein et al. (2005) Eisenstein, D. J., Zehavi, I., Hogg, D. W., et al. 2005, ApJ, 633, 560. doi:10.1086/466512
- Guy et al. (2022) Guy, J., Bailey, S., Kremin, A., et al. 2022, arXiv:2209.14482
- Hahn et al. (2022) Hahn, C., Wilson, M. J., Ruiz-Macias, O., et al. 2022, arXiv:2208.08512
- Hill et al. (2008) Hill, G. J., Gebhardt, K., Komatsu, E., et al. 2008, Panoramic Views of Galaxy Formation and Evolution, 399, 115
- Kollmeier et al. (2017) Kollmeier, J. A., Zasowski, G., Rix, H.-W., et al. 2017, arXiv:1711.03234
- Leclercq et al. (2017) Leclercq, F., Bacon, R., Wisotzki, L., et al. 2017, A&A, 608, A8. doi:10.1051/0004-6361/201731480
- Levi et al. (2013) Levi, M., Bebek, C., Beers, T., et al. 2013, arXiv:1308.0847
- Lyke et al. (2020) Lyke, B. W., Higley, A. N., McLane, J. N., et al. 2020, ApJS, 250, 8. doi:10.3847/1538-4365/aba623
- Miller et al. (2022) Miller et al. in prep 2022
- Myers et al. (2022) Myers, A. D., Moustakas, J., Bailey, S., et al. 2022, arXiv:2208.08518
- Newman et al. (2013) Newman, J. A., Cooper, M. C., Davis, M., et al. 2013, ApJS, 208, 5. doi:10.1088/0067-0049/208/1/5
- Pâris et al. (2018) Pâris, I., Petitjean, P., Aubourg, É., et al. 2018, A&A, 613, A51. doi:10.1051/0004-6361/201732445
- Prakash et al. (2016) Prakash, A., Licquia, T. C., Newman, J. A., et al. 2016, ApJS, 224, 34. doi:10.3847/0067-0049/224/2/34
- Raichoor et al. (2021) Raichoor, A., de Mattia, A., Ross, A. J., et al. 2021, MNRAS, 500, 3254. doi:10.1093/mnras/staa3336
- Raichoor et al. (2022) Raichoor, A., Moustakas, J., Newman, J. A., et al. 2022, arXiv:2208.08513
- Raichoor et al. (2023) Raichoor et al. in prep 2023
- Reid et al. (2016) Reid, B., Ho, S., Padmanabhan, N., et al. 2016, MNRAS, 455, 1553. doi:10.1093/mnras/stv2382
- Raichoor et al. (2020) Raichoor, A., Eisenstein, D. J., Karim, T., et al. 2020, Research Notes of the American Astronomical Society, 4, 180. doi:10.3847/2515-5172/abc078
- Ruiz-Macias et al. (2020) Ruiz-Macias, O., Zarrouk, P., Cole, S., et al. 2020, Research Notes of the American Astronomical Society, 4, 187. doi:10.3847/2515-5172/abc25a
- Schlegel et al. (2023) Schlegel et al. in prep 2023
- Schlafly et al. (2023) Schlafly et al. in prep 2023
- Silber et al. (2023) Silber, J. H., Fagrelius, P., Fanning, K., et al. 2023, AJ, 165, 9. doi:10.3847/1538-3881/ac9ab1
- Strauss et al. (2002) Strauss, M. A., Weinberg, D. H., Lupton, R. H., et al. 2002, AJ, 124, 1810. doi:10.1086/342343
- Takada et al. (2014) Takada, M., Ellis, R. S., Chiba, M., et al. 2014, PASJ, 66, R1. doi:10.1093/pasj/pst019
- Talbot et al. (2018) Talbot, M. S., Brownstein, J. R., Bolton, A. S., et al. 2018, MNRAS, 477, 195. doi:10.1093/mnras/sty653
- Ouchi et al. (2020) Ouchi, M., Ono, Y., & Shibuya, T. 2020, ARA&A, 58, 617. doi:10.1146/annurev-astro-032620-021859
- Yèche et al. (2020) Yèche, C., Palanque-Delabrouille, N., Claveau, C.-A., et al. 2020, Research Notes of the American Astronomical Society, 4, 179. doi:10.3847/2515-5172/abc01a
- Zhou et al. (2022) Zhou, R., Dey, B., Newman, J. A., et al. 2022, arXiv:2208.08515
- Zhou et al. (2020) Zhou, R., Newman, J. A., Dawson, K. S., et al. 2020, Research Notes of the American Astronomical Society, 4, 181. doi:10.3847/2515-5172/abc0f4
- Zou et al. (2017) Zou, H., Zhou, X., Fan, X., et al. 2017, PASP, 129, 064101. doi:10.1088/1538-3873/aa65ba