The effect of shear stress reduction on endothelial cells: a microfluidic study of the actin cytoskeleton
Abstract
Reduced blood flow, as occurring in ischemia or resulting from exposure to microgravity such as encountered in space flights, induces a decrease in the level of shear stress sensed by the endothelial cells forming the inner part of blood vessels. In the present study, we use a microvasculature-on-a-chip device in order to investigate in vitro the effect of such a reduction in shear stress on shear-adapted endothelial cells. We find that, within one hour of exposition to reduced wall shear stress, human umbilical vein endothelial cells undergo a reorganization of their actin skeleton, with a decrease in the number of stress fibers and actin being recruited into the cells’ peripheral band, indicating a fairly fast change in cells’ phenotype due to altered flow.
I Introduction
The vascular endothelium is the monolayer of specialized cells that lines the inner surface of blood vessels. It is essential to maintaining blood and vascular homeostasis through its functions in biochemical signaling, in vasomotion, and as a selective barrier controlling transport across and interactions with the vessel walls Chiu and Chien (2011); Davies (2008). Being in direct contact with blood flow, Endothelial Cells (EC) have been shown to adapt to the hemodynamic forces to which they are exposed Chiu and Chien (2011); Chien (2007); Davies (2008).
Over the past forty years, a breadth of studies have investigated the influence of fluid shear stress on the behavior and function of endothelial cells, and demonstrated the importance of the level and pattern of shear stress on e.g. EC morphology Resnick et al. (2003); Malek and Izumo (1996), proliferation Levesque, Nerem, and Sprague (1990); Lin et al. (2000), gene expression Malek and Izumo (1995), or the development of vascular pathologies Chiu and Chien (2011).
One of the first observations of EC adaptation to shear forces produced by blood stream is their elongation and preferred orientation along the flow direction Levesque and Nerem (1985). The establishment of this so-called atheroprotective phenotype Traub and Berk (1998) involves multiple players. The glycocalyx, or endothelial surface layer (ESL), is the primary structure exposed to blood flow Reitsma et al. (2007); Florian et al. (2003); Thi et al. (2004); Zeng and Tarbell (2014). This polymer-rich hydrated layer attached to the apical surface of EC acts, along with others Davies (1995); Tzima et al. (2005); Rizzo et al. (2003), as a sensor that transmits, through transmembrane proteins, the mechanical stimulus to the actin cytoskeleton of the cells Tarbell and Pahakis (2006); Thi et al. (2004). This triggers a reorganization of the actin network, associated with a remodeling of intercellular junctions and focal adhesions at the basal side of EC Noria et al. (1999); Thi et al. (2004); Davies (2008); Noria et al. (2004). A salient feature of the cytoskeleton of shear-adapted EC is the presence of so-called stress fibers composed of body-spanning elongated bundles of filamentous actin, aligned in the flow direction and contributing to the overall shape and stability of the atheroprotective phenotype Franke et al. (1984); Galbraith, Skalak, and Chien (1998); Noria et al. (2004).
While pioneer in- or ex vivo studies Wong, Pollard, and Herman (1983); Nehls and Drenckhahn (1991); Langille et al. (1991); Kim, Gotlieb, and Langille (1989); Walpola, Gotlieb, and Langille (1993) have set the basis of the above picture regarding the shear-dependent organization of the actin network, most of the current knowledge in the field comes from in vitro experiments performed using e.g. parallel plate flow chambers in which 2-dimensional (i.e. not laterally confined) confluent cultured cells are submitted to well-controlled hydrodynamic forces Chiu and Chien (2011). Recently, microfluidic tools have been combined with EC culture in order to investigate the cellular response to flow in microvessel-mimicking devices van der Meer et al. (2010); Zheng et al. (2017); Tovar-Lopez et al. (2019). Such studies have been performed over a range of endothelial cell types (from Human Umbilical Vein Blackman, Garcı a Carden a, and Gimbrone Jr. (2002), Human Pulmonary Artery Ting et al. (2012), Bovine Pulmonary artery Birukov et al. (2002), Porcine Aorta Noria et al. (2004), Bovine Aorta Girard and Nerem (1995); Malek and Izumo (1996), Rat fat pad capillaries Thi et al. (2004)), thus covering the response of cells coming from various part of the vascular tree. In vitro investigations have thus put forward the impact on actin organization of parameters such as the level of steady shear stress applied to EC Levesque and Nerem (1985); Malek, Alper, and Izumo (1999), the magnitude of stress gradients Sakamoto et al. (2010), the duration of the applied shear stimulus Girard and Nerem (1995); Noria et al. (2004, 1999); Birukov et al. (2002); Galbraith, Skalak, and Chien (1998), the pulsatility of the flow Blackman, Garcı a Carden a, and Gimbrone Jr. (2002); Mohammed et al. (2019), or flow perturbations such as recirculation or stagnation Chiu et al. (1998); Ting et al. (2012); Tovar-Lopez et al. (2019).
However, it is interesting to note that in all these in vitro studies, EC are either (i) cultured under “no flow” conditions until confluence, and then placed under hydrodynamic shear, or (ii) cultured under flow from the moment they are plated into the flow device, but experiencing the same level (high or low) or pattern (laminar, recirculating, graded or pulsating) of shear stress from the start of the culture. Most studies therefore investigated the response of EC when flow is “switched on”, or of EC submitted to specific shear conditions applied steadily from “time zero”. Strikingly enough, only a very limited number of works have addressed the question of the response of already shear-adapted EC to a loss of shear stress stimulation Fisher et al. (2001); Manevich et al. (2001); Leemreis et al. (2006); Milovanova et al. (2008); Walpola, Gotlieb, and Langille (1993); Kim, Gotlieb, and Langille (1989), as would occur for instance in occlusive microvascular events, or as a result of altered hemodynamics such as encountered in space flights Zhang (2001); Hughson, Helm, and Durante (2018) or in ground simulations of microgravity conditions Delp et al. (2000). Therefore, the question of how endothelial cells that experienced a physiological shear stress for a long period of time react to a reduction of the applied shear remains largely open.
This issue fostered the present work, in which we study the impact of a 5-fold decrease of shear stress on the actin network organization of EC that were previously shear-adapted. We do so by using a microvasculature-on-a-chip where endothelial cells are grown to confluence under flow in a network of microchannels Tsvirkun et al. (2017). We observe that, when cultured during 96h under physiologically relevant shear stress (0.4 Pa), endothelial cells elongate in the flow direction and form long and thick stress fibers. Starting from such a well-known atheroprotective phenotype, a decrease in shear stress results, within one hour, in a disorganization of the stress fibers, combined with an increase in peripheral actin and a thickening of cellular body. We also observe that a specific degradation of the glycocalyx, targeted to sialic acid residues, results in no change in the amount and orientation of stress fibers of shear-adapted EC.
II Materials and methods
II.1 Microfluidics
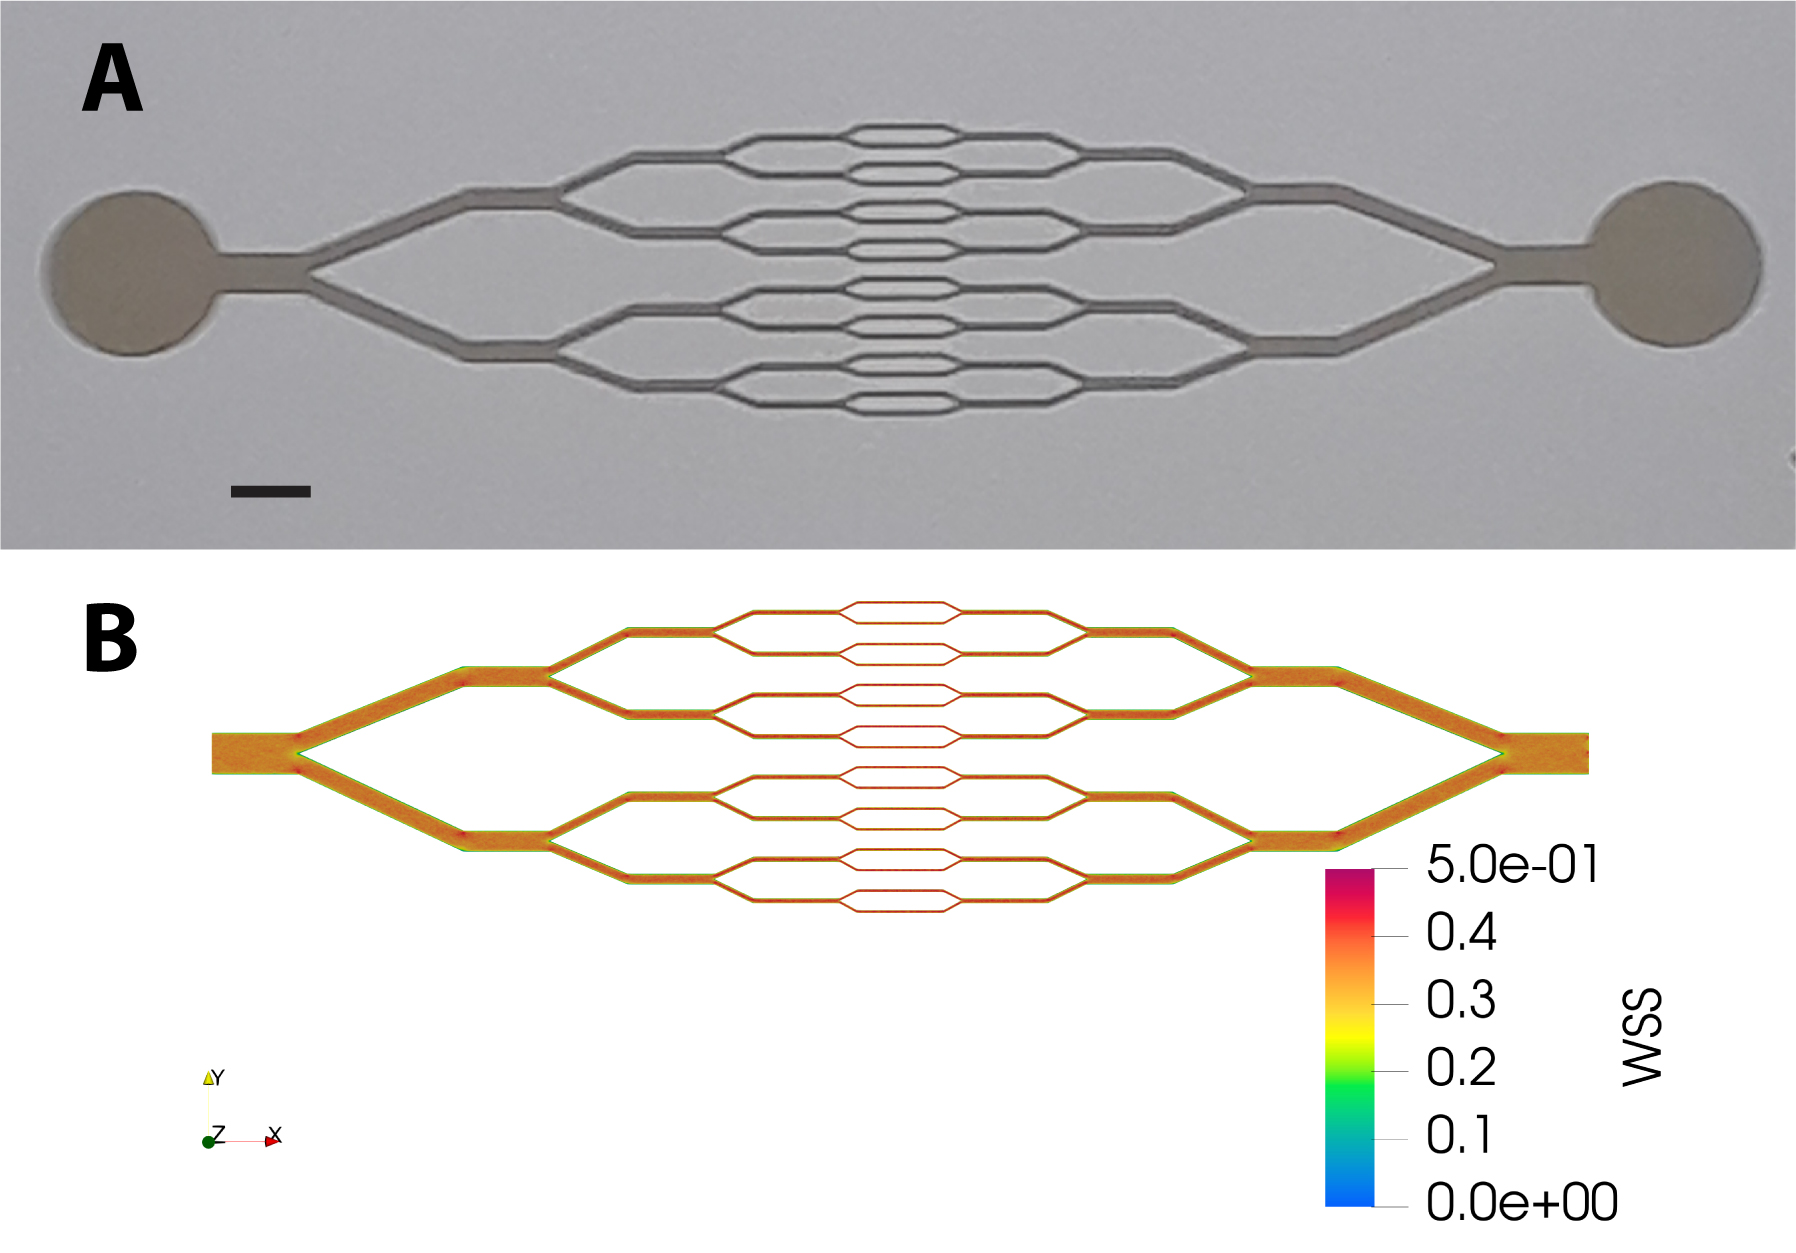
Microchannel networks displaying diverging/converging geometry (see Fig. 1A) were fabricated using a standard soft lithography technique. A master mold of the network was obtained from a positive photoresist (SU8, Gerseltec) cast onto a silicon wafer and exposed to UV light through a quartz-chromium photomask. PDMS (Sylgard 184, Dow Corning) was cast onto the mold and cured for 2 hours at 65∘C. A glass coverslip (0, thickness 100 m) was used as the bottom part of the microchip and was permanently sealed to the PDMS upper part after exposure of the surfaces of both elements to oxygen plasma (PDC-32G-2, Harrick). The thickness of the photoresist on the master mold was set such that the series of 16 parallel microchannels in the central part of the network had a square cross-section of 3030 m2. The circuit was connected with silicone tubing to a fluid reservoir at the inlet, and at the outlet to a 1 mL syringe installed on a high precision syringe pump (Legato 110, KD Scientific) used in withdraw mode at imposed flow rate.
The design of our circuit, in which the height of the channels is uniform (m) while their width is divided (resp. multiplied) by 2 at each branching (resp. converging) point, is such that for a given flow rate the fluid shear stress exerted at the bottom and top walls is expected to be homogeneous, irrespective of the channel size. In order to confirm this, we have performed tridimensional numerical modeling of a laminar flow within our network geometry, using Computer Fluid Dynamics (Simscale GmbH). As shown in Fig. 1B, numerical simulations indicate that wall shear stress is indeed fairly uniform across the circuit: at an imposed flow rate of L.min-1, we compute a wall shear stress of Pa at the bottom or top surfaces.
II.2 Cell culture and staining
Single donor Human Umbilical Vein Endothelial Cells (HUVEC) were obtained from Promocell GmbH (Germany) and cultured in endothelial cells growth medium supplemented by growth factors (Supplement Mix, Promocell GmbH, Germany).
Before cell seeding, microchannels were activated by exposure to oxygen plasma and coated with human fibronectin (50 g/mL, Corning) for 30 min at 37 ∘C. Endothelial cells were suspended in culture medium at a concentration of 107 cells/mL and filtered through a nylon cell strainer with pore diameter of 40 m. The cell suspension was injected into the microchannel network with a pressure controller (OB-1 MK2, Elveflow, France). Consecutive steps of injection of a few seconds and sedimentation periods of several minutes were performed until about 50 % of the network surface was covered by cells.
Cells were then cultured at 37 ∘C and 5% CO2 under a constant flow of supplemented medium for one night at 0.6 L/min and then maintained at 1L/min for four days in order for cells to form a confluent layer and adapt to shear. As mentioned in the previous section, a flow rate of 1L/min corresponds to a wall shear stress of 0.4 Pa, representative of physiological conditions in e.g. post-capillary venules Sheikh et al. (2003).
After four days of culture under 0.4 Pa, the shear-adapted cells were exposed to a reduced flow rate of 0.2 L/min, corresponding to a reduced wall shear stress of 0.08 Pa. Reduced flow was applied for a duration of 1 or 6 hours, after which cells were fixed by perfusing the channels with a solution of 4% paraformaldehyde in PBS for 30 min at 37 ∘C, and stained for observation.
As controls, HUVEC were also cultured under (i) static conditions into fibronectin-coated glass-bottom Petri dishes until reaching confluence, and (ii) reduced flow conditions (wall shear stress 0.08 Pa) applied from the start of the experiment, during four days of culture after seeding in the channels.
All experiments were performed in duplicates.
For confocal microscopy we used the following dyes: (i) Hoechst 33342 (Molecular Probes) for nuclei staining, (ii) Phalloidin TRITC (Sigma-Aldrich) for F-Actin staining and (iii) Wheat Germ Agglutinin (WGA) Alexa Fluor 488 Conjugate (5 g/ml, Molecular Probes) for staining the glycocalyx. The dyes were used in accordance with manufacturer’s specification.
For glycocalyx modification, cells were exposed to Neuraminidase from Clostridium perfringens (1U/ml, Sigma-Aldrich) in a CO2 incubator. Neuraminidase was used at 150 mUI/mL and perfused at /min for 3 hours in non-supplemented endothelial cells culture medium. Glycocalyx was stained by WGA-Alexa 488 after enzymatic modification and fluorescence intensity was estimated with and without Neuraminidase action.
II.3 Image acquisition and processing
Confocal fluorescence microscopy was performed on an inverted microscope. XYZ image stacks were obtained in raster mode using a Zeiss LSM710 module and a 40/NA1.3 oil-immersion objective, with a lateral size of 1024200 pixels, a lateral resolution of 0.225 m/pixel, and a Z-slice spacing of 0.46 m.
The acquired image stacks were processed and analyzed using the ImageJ open-source platform and its built-in plugins. 3-dimensional XYZ image stacks were treated as follows. A point spread function (PSF) of the microscope was generated numerically with ImageJ, using the “Diffraction PSF 3D” plugin fed with the experimental characteristics of our imaging system (i.e. refraction index of immersion liquid, objective numerical aperture, lateral magnification and z slice spacing of the stack). We have further checked for the consistency of such a generated PSF by using it to deconvolve images of fluorescent latex beads of known diameter (500 nm) and ensuring that the bead size measured from the deconvolved images agreed with the expected one. PSF deconvolution was then performed on image stacks of the stained cells using the “Iterative deconvolve 3D” plugin. Z-projections of deconvolved image stacks were then made, summing the intensity of each of the slices spanning the EC monolayer adhered on the bottom surface of the channels.
II.4 Quantification of filamentous actin structures
From Z-projected images obtained as described above, F-Actin structures were characterized with the ImageJ plugin “OrientationJ” Rezakhaniha et al. (2011), using the “Gaussian gradient” built-in method with a window size of 2 pixels.
The OrientationJ plugin computes the structure tensor from the intensity gradient of an image, and attributes to each pixel in the image a pair of values, between 0 and 1, corresponding to the local values of the (normalized) energy, E, and coherency, C, of the structure tensor. Low values of E correspond to regions in the image where intensity is uniform, while large values indicate regions having one or multiple orientations. C is a measure of the local degree of anisotropy, with values closer to 1 corresponding to regions of stronger anisotropy.
For each experimental conditions, we compute E and C maps of the F-actin images obtained (such as illustrated in Fig. 2A-C), and build a final map where each pixel contains the value of . From such maps we determine the distribution of by building histograms over 50 bins of spanning the range , where we compute, for each bin, a frequency corresponding to the number of pixels displaying a given value of divided by the total number of pixels in the image. Plotting the distribution of allows us assessing, for a given cell culture condition, the fraction of image pixels involved in non-uniform and strongly elongated F-actin structures.
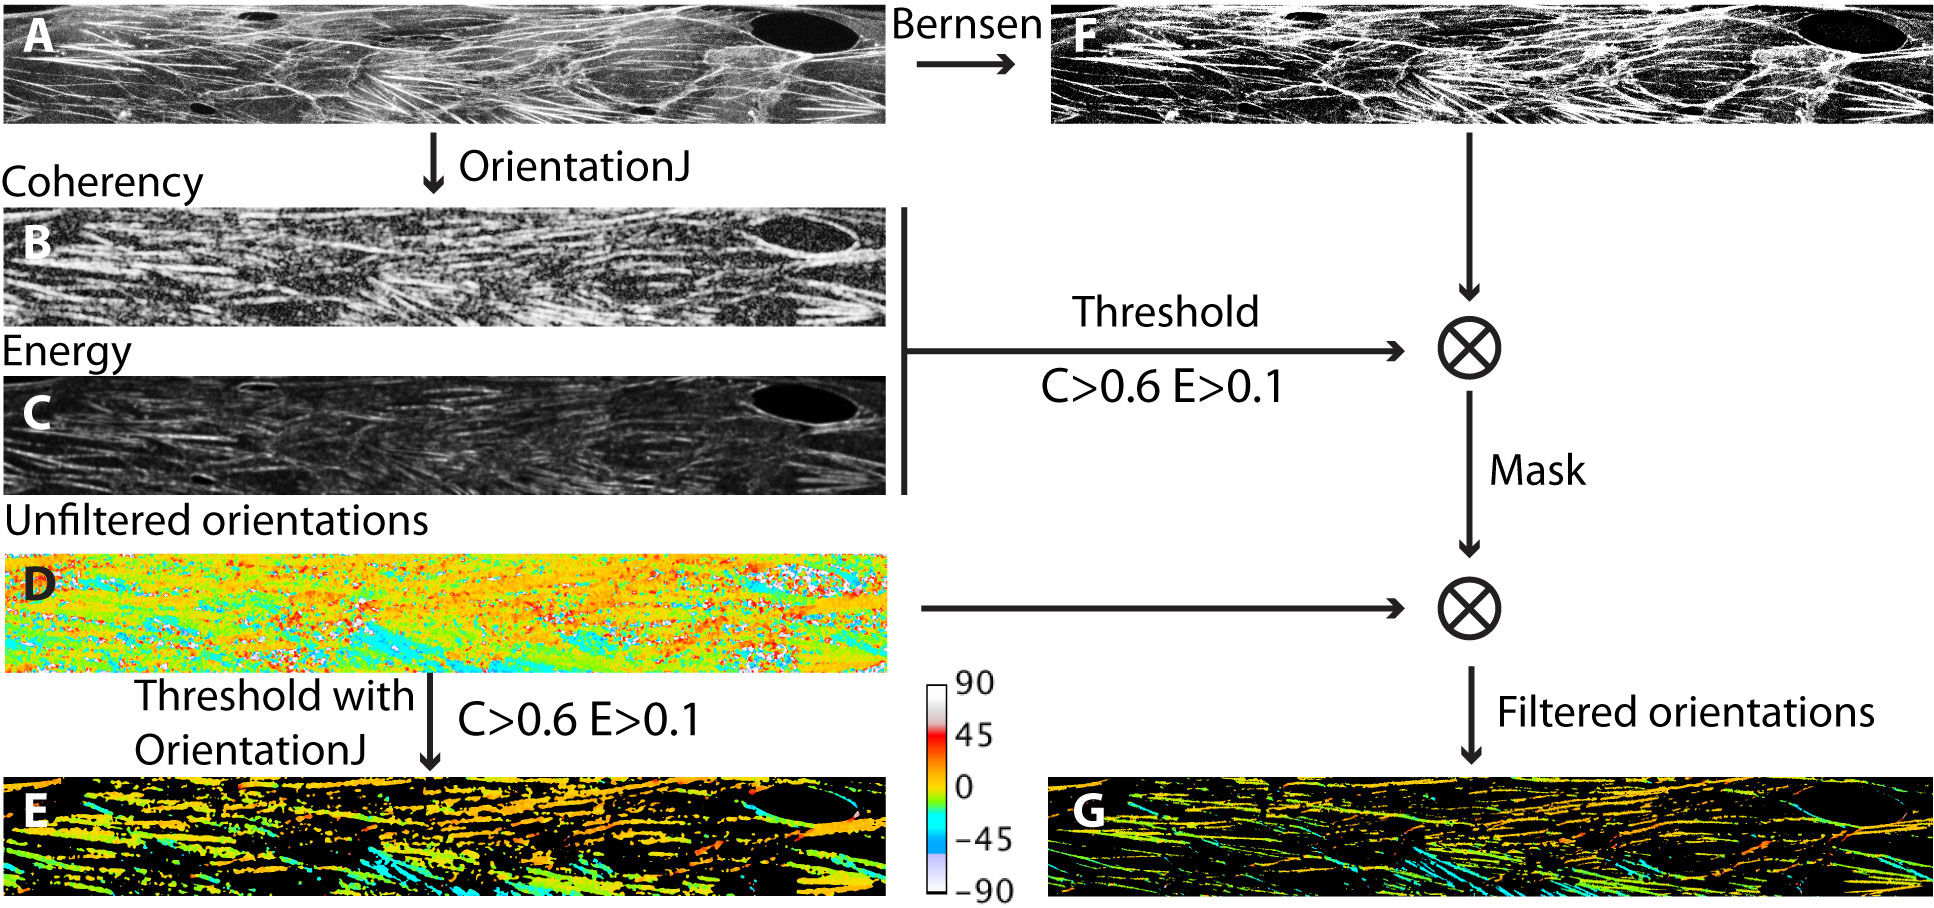
From the computation of the structure tensor, OrientationJ also provides a map of the local orientation. The plugin associates an orientation to each pixel in the image, including in regions of low E and C where this quantity is not meaningful. Such an orientation map can then be filtered by thresholding on E and C values in order to retain only the orientation values of pixels that are actually part of anisotropic structures. Doing so using the built-in thresholding feature of OrientationJ, we observe that, with our type of images, the filtered orientation maps display a spatial resolution that is clearly lower than the initial image, with blurred features and inclusion of pixels that are actually outside of the fibers (see Fig. 2). We could not find a set of OrientationJ parameters that would allow us to increase further the resolution of the orientation map without losing part of the elongated structures that are visible in the original image. As an alternative to the built-in thresholding feature of the plugin, we find that the following procedure performs better in terms of final resolution: starting from the input image, we run orientationJ to obtain E, C and unfiltered orientation maps. We then threshold the E and C images (at the same levels used in the built-in function of the plugin, namely and in the present work) and binarize them. In parallel, we binarize the input image using the local threshold Bernsen method implemented in ImageJ. We then multiply the binarized E, C and Bernsen image in order to create a binary mask that we use to filter the orientation map. A comparison of the built-in and custom-made thresholding is provided in Fig. 2.
The orientation maps thus produced are then used to compute angular distributions. In the following, angular distributions are computed over 30 bins of width 3∘, spanning the range between 0∘ and +90∘, with 0∘ being the flow direction, and where we count in the same bin the pixels displaying an angle of or . Frequencies in each bin correspond to the ratio of the number of pixels within an angular bin to the total number of pixels involved in oriented F-actin structures.
Distributions of and angles were computed from images taken in the central part of the networks, i.e. in the channels having a cross-section of m2.
II.5 Statistical analysis
The number of analyzed images was (389 cells) for culture under flow at 0.4 Pa, (311 cells) for flow reduced at 0.08 Pa for 1h, (235 cells) for flow reduced at 0.08 Pa for 6h, (151 cells) for glycocalyx degradation, (141 cells) for culture under 0.08 Pa for 4 days, and (132 cells) for static condition.
For every experimental condition, and angular distributions were computed on each of the images taken. In what follows, we present such distributions as mean frequency s.e.m. (standard error of the mean), computed bin-by-bin over the images analyzed. When comparing the results for various experimental conditions, we take as statistically significant any difference between distributions larger than 4 s.e.m. (i.e. when the 95% confidence intervals of the distributions do not overlap).
Other quantifications (fluorescence intensity or length measurements on images) were analyzed using t-tests at the 0.05 threshold, performed using Origin software. In what follows, we indicate by (*) datasets whose means are statistically different (), and by (**) those that are not ().
III Results
We label as follows the various conditions under which HUVEC were imaged:
Condition (i): after 4 days of culture under 0.4 Pa of wall shear stress,
Condition (ii): after 4 days of culture under 0.4 Pa of wall shear stress, followed by 1h under 0.08 Pa,
Condition (iii): after 4 days of culture under 0.4 Pa of wall shear stress, followed by 6h under 0.08 Pa,
Condition (v): after 4 days of culture under 0.08 Pa of wall shear stress,
Condition (iv): after 4 days of culture under 0.4 Pa of wall shear stress, followed by exposition to neuraminidase for 3h under 0.4 Pa,
Condition (vi): after 4 days of culture under static condition, in the absence of flow.
III.1 Comparison of conditions (i) and (vi) : 0.4 Pa vs static culture
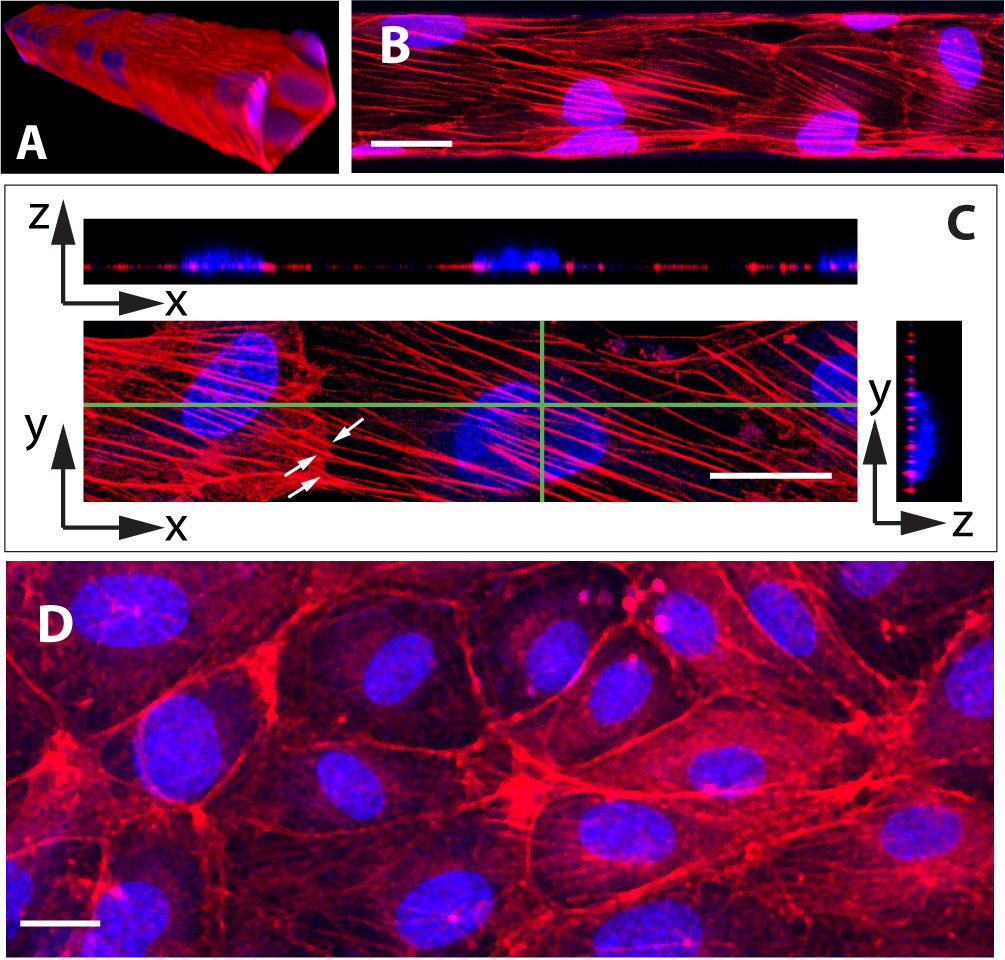
As illustrated on Fig. 3A, HUVEC cultured under 0.4 Pa of fluid shear stress for four days yield a confluent monolayer of cells covering the four walls of the microchannels. Under such conditions, we observe that cells exhibit many oriented actin stress fibers that cross the cell from side to side underneath the nucleus and seem to be attached to cell-cell junction as they continue end to end into the neighboring cell (see Fig. 3B and C). In contrast to this, HUVEC cultured under static conditions rather display a marked deep peripheral actin band, with no or few randomly oriented stress fibers (Fig. 3D).
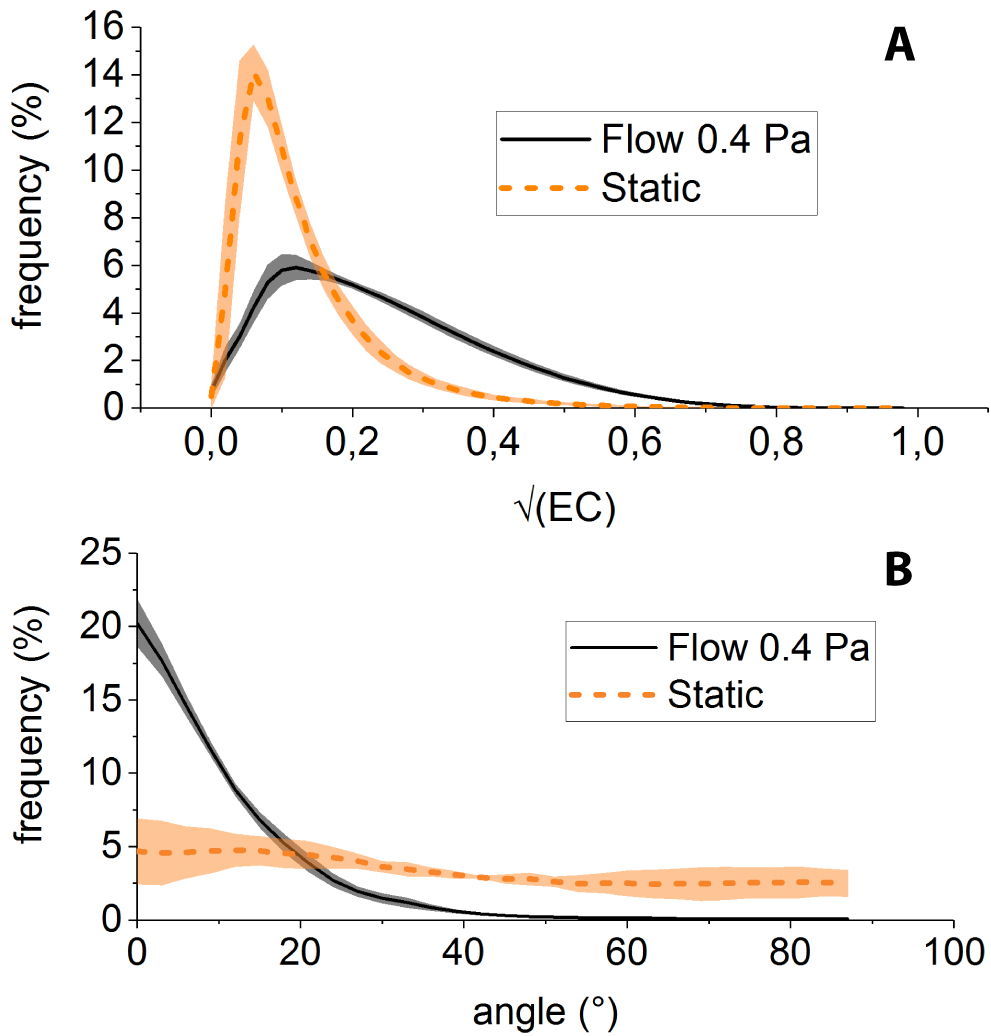
Applying the above-described procedure to F-actin images obtained under static and 0.4 Pa shear flow conditions, we observe that: (i) the distribution of is more populated towards large values () for shear-adapted cells than for static condition (Fig. 4A), consistent with more anisotropic structures (i.e. stress fibers) being present in cells cultured under fllow, and (ii) the angular distribution of such structures is sharply peaked about (i.e. along the flow direction) for shear-adapted cells (Fig. 4B), indicating streamwise alignment of stress fibers, whereas the angular distribution of actin in static cultures is much flatter.
III.2 Effect of reduced hydrodynamic stress after shear-adaption
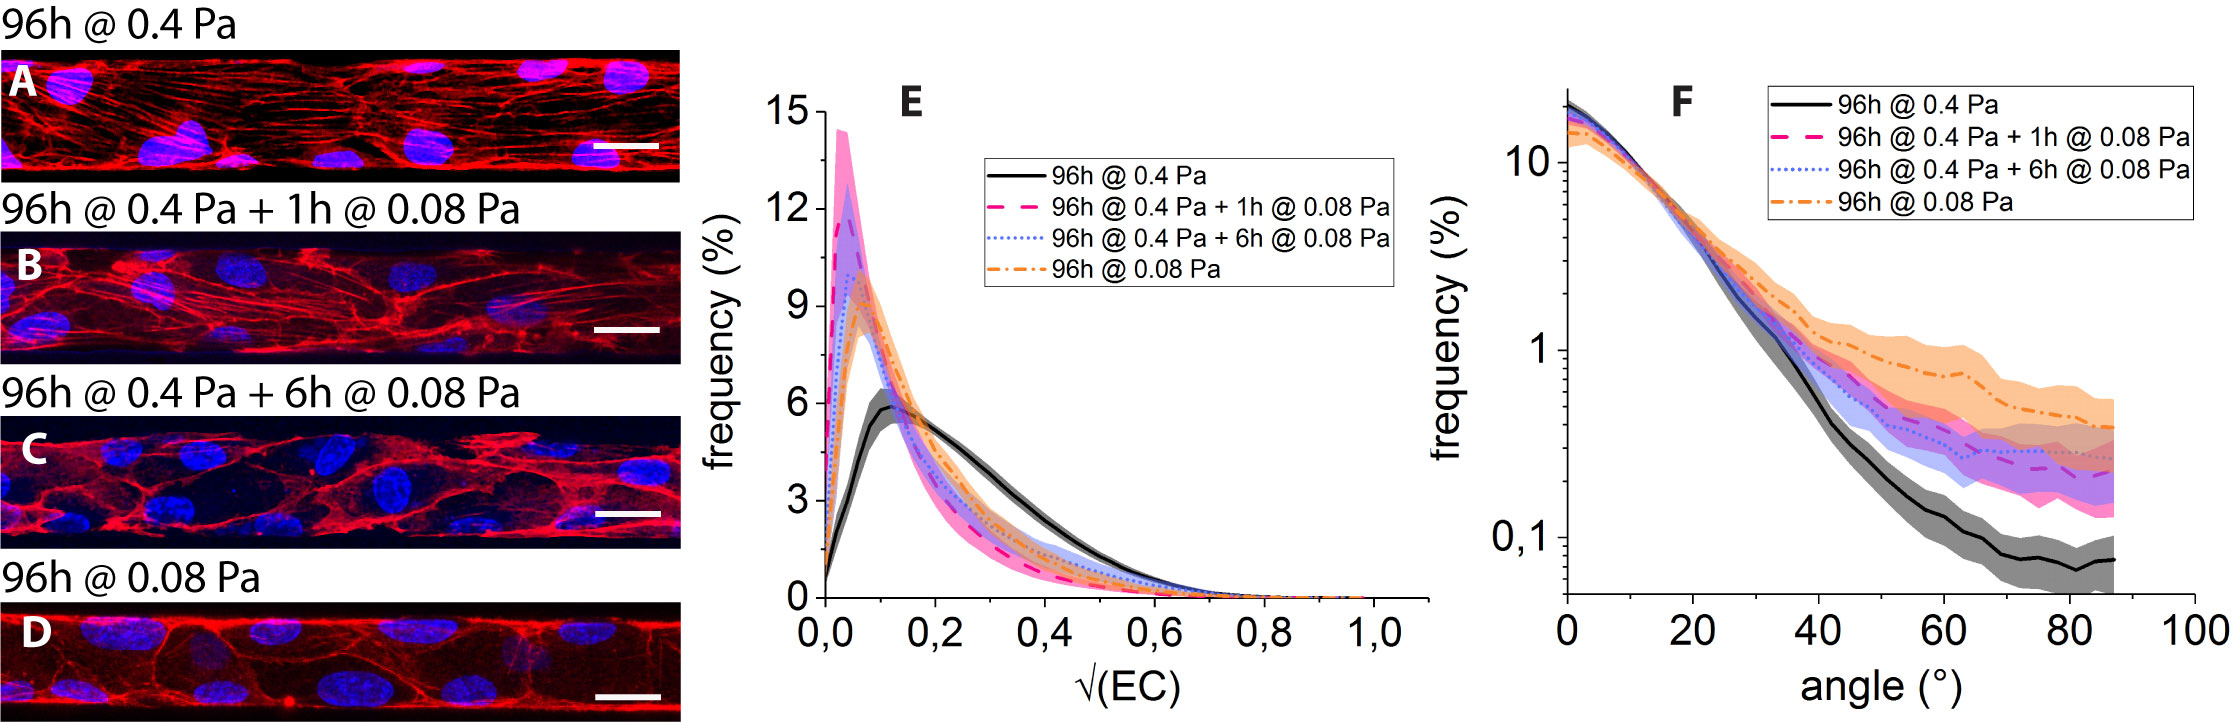
The impact on the F-actin network of culture conditions (i) to (iv) is summarized on Fig. 5.
As already mentioned, culture under 0.4 Pa for 96h (condition (i)) results in the development of flow-aligned stress fibers (Fig. 5A). In contrast to this, submitting the HUVEC, previously shear-adapted to 0.4 Pa for 96h, to 1h of shear stress lowered to 0.08 Pa (condition (ii)) leads to a marked decrease in the number of fibers and to a localization of F-actin at the periphery of the cells (Fig. 5B). Such a trend is maintained after 6h of reduced flow (condition (iii), Fig. 5C).
In addition, we observe that HUVEC constantly submitted to 0.08 Pa for 96h of culture (condition (iv), Fig. 5D) form a confluent monolayer in the microfluidic networks, and display an organization of F-actin presenting features that are qualitatively similar to those observed for conditions (ii) and (iii), with little or no stress fibers and a pronounced actin peripheral band.
The decrease in the number of filamentous structures under low shear stress can be seen on the distributions of (Fig. 5E): as observed under purely static condition, distributions computed for conditions (ii) to (iv) are not significantly different and all exhibit a peak at low values (), whereas that computed for condition (i) is significantly more populated .
Such a loss of actin fibers under 0.08 Pa of wall shear stress is accompanied by a broadening of the angular distributions, which exhibit tails beyond that are more pronounced than at 0.4 Pa (Fig. 5F). While our image analysis procedure does not allow us to discriminate between the various contributions, the observed angular broadening under reduced flow can stem from both a disorientation of stress fibers and from the buildup of peripheral actin, both contributing to large angles in the distributions.
Moreover, we see in Fig. 5F that the angular distribution computed for condition (iv) lies above those computed for conditions (ii) and (iii). This may stem from the fact that HUVEC submitted to 1 or 6h of low shear stress after 96h at 0.4 Pa do however keep a flow-elongated shape, as seen in Fig. 5B and C from the peripheral actin bands, while HUVEC submitted to permanent low shear do not exhibit flow alignment (Fig. 5D), resulting in a broader angle distribution for condition (iv).
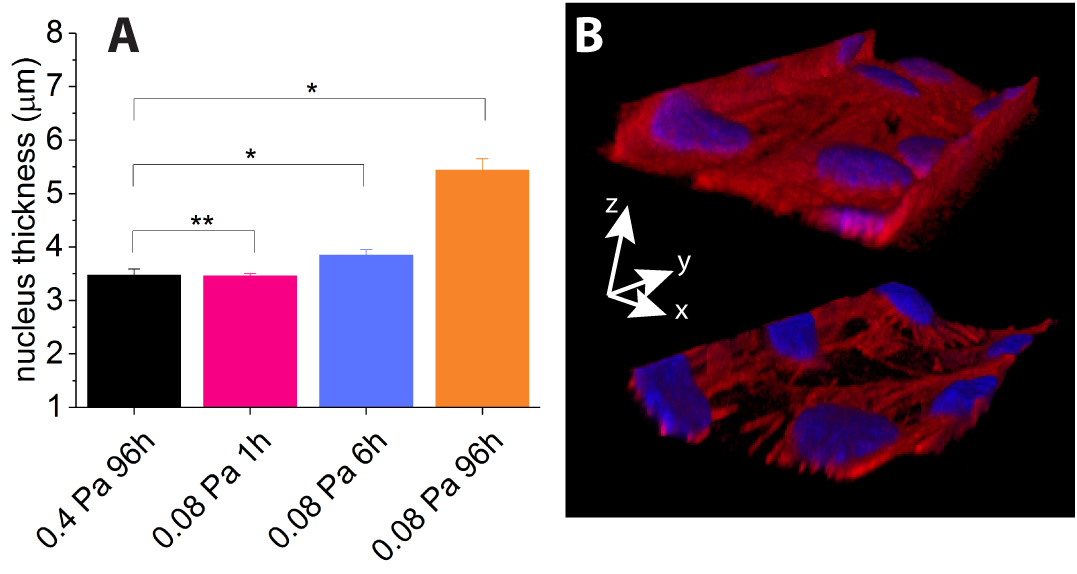
From our 3D confocal image sets, we have measured the maximum thickness of the nuclei of the cells, and notice an increase in thickness under prolonged reduced flow conditions, as shown on Fig. 6A: while nucleus thickness between conditions (i) and (ii) are not statistically different, we measure a significant increase of thickness for conditions (iii) and (iv).
In addition to this, we notice qualitatively that upon long exposure to low shear stress (>6h), 0.4Pa-shear-adapted HUVEC tend to detach from the microchannel walls, mainly from the corners, as illustrated on Fig. 6B, while maintaining cell-cell contacts.
III.3 Effect of neuraminidase treatment
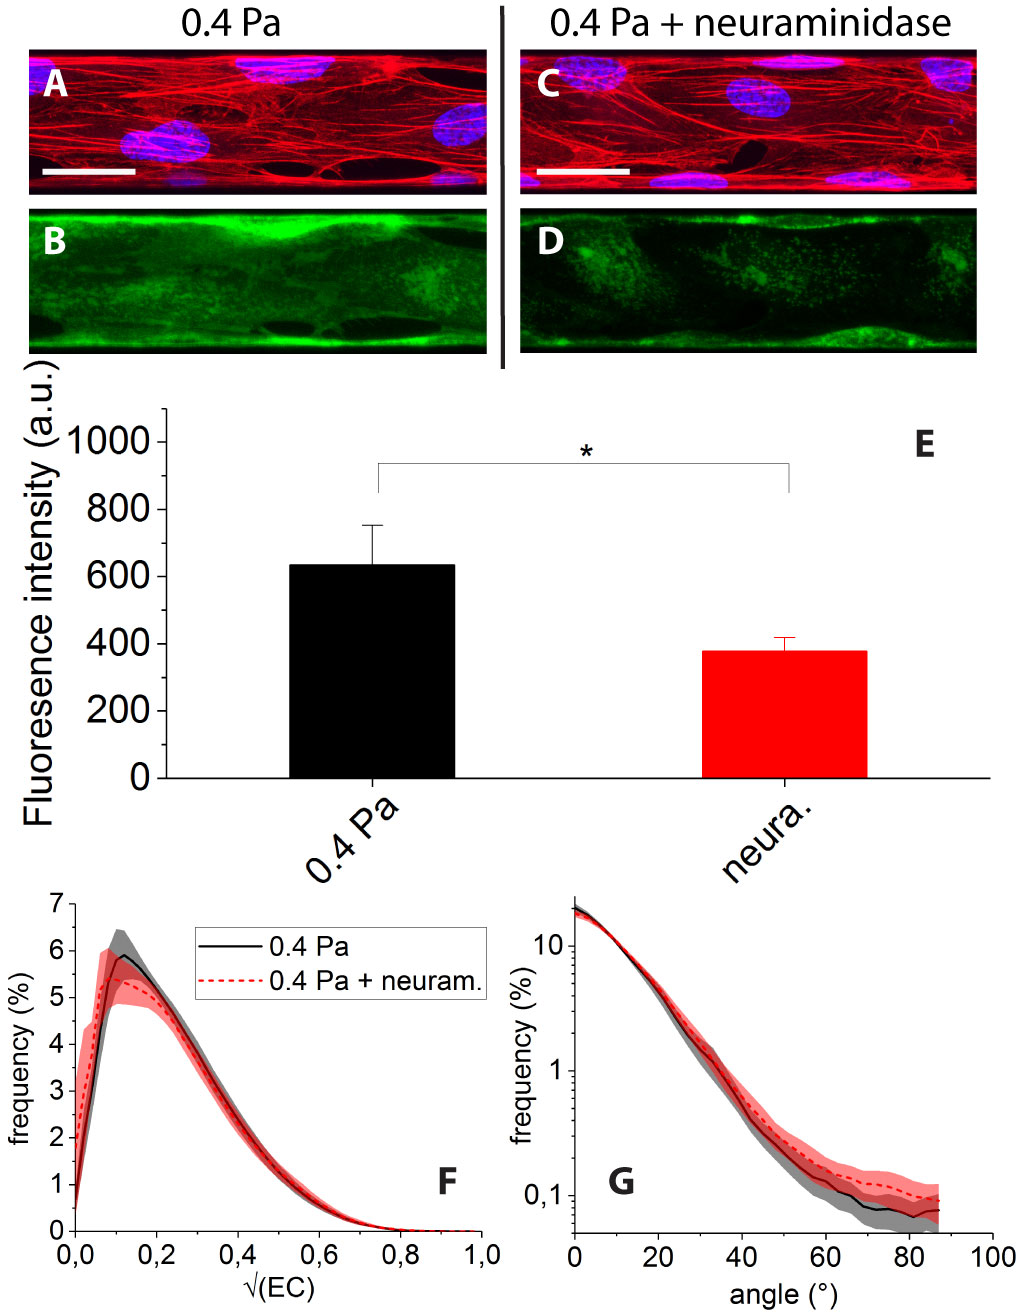
The effect of treating the cells with neuraminidase while submitting them to 0.4 Pa of shear stress is illustrated in Fig. 7. The enzymatic degradation of the glycocalyx results in a clear decrease of the WGA-Alexa fluorescence signal (see Fig. 7C and D) which indicates actual removal of part of the andothelial surface layer. This can be quantified by a statistically significant 40 decrease of image mean intensity (Fig. 7E).
However we find that neuraminidase treatment does not induce any clear change of the F-actin organization: after enzymatic degradation (condition (v)), we observe cells displaying numerous and flow oriented stress fibers (Fig. 7C), similarly to condition (i) (Fig. 7A). Accordingly, distributions of and angles for conditions (i) and (v) are found to display no significant differences (Fig. 7F and G).
IV Discussion and conclusion
The partial degradation of the Endothelial Surface Layer with neuraminidase yielding no discernible change in actin organization may seem puzzling in the first place, as the glycocalyx is directly involved in flow sensing of endothelial cells. However, the glycocalyx is a multicomponent layer, comprising different membrane-bound glycoproteins, proteoglycans and glycosaminoglycans having various functions Pahakis et al. (2007). Neuraminidase specifically targets Sialic Acids (SA), which contribute to a large part of the overall thickness of the ESL and to its permeability Betteridge et al. (2017). However, SA are associated to glycoproteins that are not directly connected to the actin skeleton Zeng et al. (2018). In addition, neuraminidase is expected to leave intact glycosaminoglycans such as Heparan Sulfate Pahakis et al. (2007), a component of the ESL connected to the actin cytoskeleton through trans-membrane syndecans Zeng et al. (2018). Our observation therefore indicates that SA are not involved in actin remodelling under shear stress, and suggests that other members of the ESL connected to the actin cytoskeleton, such as Heparan Sulfate, are not affected by the steric effect of neighboring SA in playing their role in glycocalyx-mediated mechanotransduction Florian et al. (2003); Thi et al. (2004); Tarbell and Pahakis (2006); Ebong et al. (2014); Yen et al. (2015).
Furthermore, our experiments indicate that HUVEC cultured under a steady shear flow corresponding to a wall stress of 0.4 Pa display long and flow-oriented F-actin fibers. This observation is consistent with previous works and shows that the well-established picture of the atheroprotective phenotype holds in a situation where the endothelial cells are strongly confined and organized in 3D into capillary-sized microchannels.
It has been shown in previous studies that such an atheroprotective phenotype is lost in regions of disturbed or low shear flow, favoring e.g. lipoprotein uptake, adhesion of leukocytes Traub and Berk (1998) and inflammation Baratchi et al. (2017). In order to have a complete picture of the mechanical factors controlling the atherosusceptibility of the endothelium, it is not only important to study EC under well-controlled flow conditions, but also to investigate how EC dynamically react to changes in such conditions, such as discussed in recent works related to how EC sense changes in flow direction Wang, Lu, and Schwartz (2012); Wang et al. (2013).
Along this line of studying dynamical changes, our study demonstrates that, starting from a shear-adapted phenotype, HUVEC respond within one hour to a 5-fold lowering of wall shear stress down to 0.08 Pa by a marked rearrangement of the actin cytoskeleton, with stress fibers being disrupted/disorganized and actin being redistributed into the peripheral band. This is consistent with and complements previous observations of the actin organization of HUVEC under high and low stress stimuli obtained from vertical-step flow experiments Chiu et al. (1998). Our observation of a thickening of the nuclei, concomitant with actin remodeling under low shear, suggests a slight inflation of the cellular body. This is consistent with a decrease in the number of stress fibers, which we expect to be associated with a relaxation of the cellular internal stresses.
Finally, we observe a trend for cells adapted under high shear to detach from the walls after long exposure to low shear, whereas HUVEC cultured at low shear from the beginning of the experiment are observed to be well adhered to the channel walls after 96h of culture. This suggests that the observed detachment trend is likely to be transient only, and might be associated with a reorganization of focal adhesions accompanying actin remodeling. This observation clearly calls for further investigation monitoring adhesion proteins Girard and Nerem (1995) during flow reduction. However, such an observation, along with the above observations of actin rearrangement, strongly suggests that upon a five-fold decrease of the wall shear stress, HUVEC switch within a few hours from an atheroprotective to an atheroprone and more motile phenotype Dai et al. (2004).
While previous studies have highlighted differences in phenotypes in response to flow start-up Zeng and Tarbell (2014) or to various flow patterns applied from the start of the culture Chiu and Chien (2011); Zheng et al. (2017); Dai et al. (2004), the present study reports on cytoskeleton reorganization of shear-adapted cells in response to a flow decrease. We note that such a response involves a reorganization of the actin skeleton that shares features (disruption of fibers, actin buildup at periphery of the cells) with what has been observed as a result of exposing endothelial cells to simulated microgravity Versari et al. (2007). This suggests that, in the context of vascular adaptation to space flight conditions, both microgravity and altered blood flow act in concert to induce phenotypic changes of endothelial cells.
Acknowledgements.
We acknowledge the department of Material Sciences of the french Centre National d’Etudes Spatiales (CNES) for financial support. M.I is a PhD fellow of the France-Germany “Living fluids” Doctoral school.References
- Chiu and Chien (2011) J.-J. Chiu and S. Chien, Physiol. Rev. 91, 327 (2011).
- Davies (2008) P. F. Davies, Nat Rev Cardiol 6, 16 (2008).
- Chien (2007) S. Chien, AJP: Heart and Circulatory Physiology 292, H1209 (2007).
- Resnick et al. (2003) N. Resnick, H. Yahav, A. Shay-Salit, M. Shushy, S. Schubert, L. C. M. Zilberman, and E. Wofovitz, Progress in Biophysics and Molecular Biology 81, 177 (2003).
- Malek and Izumo (1996) A. M. Malek and S. Izumo, J. Cell. Sci. 109, 713 (1996).
- Levesque, Nerem, and Sprague (1990) M. J. Levesque, R. M. Nerem, and E. A. Sprague, Biomaterials 11, 702 (1990).
- Lin et al. (2000) K. Lin, P. P. Hsu, B. P. Chen, S. Yuan, S. Usami, J. Y. Shyy, Y. S. Li, and S. Chien, Proc Natl Acad Sci USA 97, 9385 (2000).
- Malek and Izumo (1995) A. M. Malek and S. Izumo, J Biomech 28, 1515 (1995).
- Levesque and Nerem (1985) M. J. Levesque and R. M. Nerem, J Biomech Eng 107, 341 (1985).
- Traub and Berk (1998) O. Traub and B. C. Berk, Arteriosclerosis, Thrombosis, and Vascular Biology 18, 677 (1998).
- Reitsma et al. (2007) S. Reitsma, D. W. Slaaf, H. Vink, M. A. M. J. van Zandvoort, and M. G. A. oude Egbrink, Pflugers Arch - Eur J Physiol 454, 345 (2007).
- Florian et al. (2003) J. A. Florian, J. R. Kosky, K. Ainslie, Z. Pang, R. O. Dull, and J. M. Tarbell, Circulation Research 93, H1145 (2003).
- Thi et al. (2004) M. M. Thi, J. M. Tarbell, S. Weinbaum, and D. C. Spray, Proc Natl Acad Sci USA 101, 16483 (2004).
- Zeng and Tarbell (2014) Y. Zeng and J. M. Tarbell, PLoS ONE 9, e86249 (2014).
- Davies (1995) P. F. Davies, Physiol. Rev. 75, 519 (1995).
- Tzima et al. (2005) E. Tzima, M. Irani-Tehrani, W. B. Kiosses, E. Dejana, D. A. Schultz, B. Engelhardt, G. Cao, H. DeLisser, and M. A. Schwartz, Nature 437, 426 (2005).
- Rizzo et al. (2003) V. Rizzo, C. Morton, N. DePaola, J. E. Schnitzer, and P. F. Davies, AJP: Heart and Circulatory Physiology 285, H1720 (2003).
- Tarbell and Pahakis (2006) J. M. Tarbell and M. Y. Pahakis, J Intern Med 259, 339 (2006).
- Noria et al. (1999) S. Noria, D. B. Cowan, A. I. Gotlieb, and B. L. Langille, Circulation Research 85, 504 (1999).
- Noria et al. (2004) S. Noria, F. Xu, S. McCue, M. Jones, A. I. Gotlieb, and B. L. Langille, Am. J. Pathol. 164, 1211 (2004).
- Franke et al. (1984) R. P. Franke, M. Gräfe, H. Schnittler, D. Seiffge, C. Mittermayer, and D. Drenckhahn, Nature 307, 648 (1984).
- Galbraith, Skalak, and Chien (1998) C. G. Galbraith, R. Skalak, and S. Chien, Cell Motil. Cytoskeleton 40, 317 (1998).
- Wong, Pollard, and Herman (1983) A. J. Wong, T. D. Pollard, and I. M. Herman, Science 219, 867 (1983).
- Nehls and Drenckhahn (1991) V. Nehls and D. Drenckhahn, Microvascular Research 42, 103 (1991).
- Langille et al. (1991) B. L. Langille, J. J. Graham, D. Kim, and A. I. Gotlieb, Arterioscler. Thromb. 11, 1814 (1991).
- Kim, Gotlieb, and Langille (1989) D. W. Kim, A. I. Gotlieb, and B. L. Langille, Arteriosclerosis 9, 439 (1989).
- Walpola, Gotlieb, and Langille (1993) P. L. Walpola, A. I. Gotlieb, and B. L. Langille, Am. J. Pathol. 142, 1392 (1993).
- van der Meer et al. (2010) A. D. van der Meer, A. A. Poot, J. Feijen, and I. Vermes, Biomicrofluidics 4, 011103 (2010).
- Zheng et al. (2017) C. Zheng, X. Zhang, C. Li, Y. Pang, and Y. Huang, Anal. Chem. 89, 3710 (2017).
- Tovar-Lopez et al. (2019) F. Tovar-Lopez, P. Thurgood, C. Gilliam, N. Nguyen, E. Pirogova, K. Khoshmanesh, and S. Baratchi, Front. Bioeng. Biotechnol. 7, pe6 (2019).
- Blackman, Garcı a Carden a, and Gimbrone Jr. (2002) B. R. Blackman, G. Garcı a Carden a, and M. A. Gimbrone Jr., Journal of Biomechanical Engineering 124, 397 (2002).
- Ting et al. (2012) L. H. Ting, J. R. Jahn, J. I. Jung, B. R. Shuman, S. Feghhi, S. J. Han, M. L. Rodriguez, and N. J. Sniadecki, AJP: Heart and Circulatory Physiology 302, H2220 (2012).
- Birukov et al. (2002) K. G. Birukov, A. A. Birukova, S. M. Dudek, A. D. Verin, M. T. Crow, X. Zhan, N. DePaola, and J. G. N. Garcia, Am. J. Respir. Cell Mol. Biol. 26, 453 (2002).
- Girard and Nerem (1995) P. R. Girard and R. M. Nerem, J. Cell. Physiol. 163, 179 (1995).
- Malek, Alper, and Izumo (1999) A. M. Malek, S. L. Alper, and S. Izumo, JAMA 282, 2035 (1999).
- Sakamoto et al. (2010) N. Sakamoto, N. Saito, X. Han, T. Ohashi, and M. Sato, Biochemical and Biophysical Research Communications 395, 264 (2010).
- Mohammed et al. (2019) M. Mohammed, P. Thurgood, C. Gilliam, N. Nguyen, E. Pirogova, K. Peter, K. Khoshmanesh, and S. Baratchi, Anal. Chem. 91, 12077 (2019).
- Chiu et al. (1998) J. J. Chiu, D. L. Wang, S. Chien, R. Skalak, and S. Usami, Journal of Biomechanical Engineering 120, 2 (1998).
- Fisher et al. (2001) A. B. Fisher, S. Chien, A. I. Barakat, and R. M. Nerem, AJP: Lung Cellular and Molecular Physiology 281, L529 (2001).
- Manevich et al. (2001) Y. Manevich, A. Al-Mehdi, V. Muzykantov, and A. B. Fisher, AJP: Heart and Circulatory Physiology 280, H2126 (2001).
- Leemreis et al. (2006) J. R. Leemreis, A. M. G. Versteilen, P. Sipkema, A. B. J. Groeneveld, and R. J. P. Musters, Cytometry 69A, 973 (2006).
- Milovanova et al. (2008) T. Milovanova, S. Chatterjee, B. J. Hawkins, N. Hong, E. M. Sorokina, K. DeBolt, J. S. Moore, M. Madesh, and A. B. Fisher, Biochimica et Biophysica Acta (BBA) - Molecular Cell Research 1783, 1866 (2008).
- Zhang (2001) L. F. Zhang, Journal of Applied Physiology 91, 2415 (2001).
- Hughson, Helm, and Durante (2018) R. L. Hughson, A. Helm, and M. Durante, Nat Rev Cardiol 15, 167 (2018).
- Delp et al. (2000) M. D. Delp, P. N. Colleran, M. K. Wilkerson, M. R. McCurdy, and J. Muller-Delp, AJP: Heart and Circulatory Physiology 278, H1866 (2000).
- Tsvirkun et al. (2017) D. Tsvirkun, A. Grichine, A. Duperray, C. Misbah, and L. Bureau, Sci. Rep. 7, 45036 (2017).
- Sheikh et al. (2003) S. Sheikh, G. E. Rainger, Z. Gale, M. Rahman, and G. B. Nash, Blood 102, 2828 (2003).
- Rezakhaniha et al. (2011) R. Rezakhaniha, A. Agianniotis, J. T. C. Schrauwen, A. Griffa, D. Sage, C. V. C. Bouten, F. N. van de Vosse, M. Unser, and N. Stergiopulos, Biomech Model Mechanobiol 11, 461 (2011).
- Pahakis et al. (2007) M. Y. Pahakis, J. R. Kosky, R. O. Dull, and J. M. Tarbell, Biochem. Biophys. Res. Commun. 355, 228 (2007).
- Betteridge et al. (2017) K. B. Betteridge, K. P. Arkill, C. R. Neal, S. J. Harper, R. R. Foster, S. C. Satchell, D. O. Bates, and A. H. J. Salmon, J Physiol 595, 5015 (2017).
- Zeng et al. (2018) Y. Zeng, X. F. Zhang, B. M. Fu, and J. M. Tarbell, in Molecular, Cellular, and Tissue Engineering of the Vascular System (Springer International Publishing, Cham, 2018) pp. 1–27.
- Ebong et al. (2014) E. E. Ebong, S. V. Lopez-Quintero, V. Rizzo, D. C. Spray, and J. M. Tarbell, Integr. Biol. 6, 338 (2014).
- Yen et al. (2015) W. Yen, B. Cai, J. Yang, L. Zhang, M. Zeng, J. M. Tarbell, and B. M. Fu, PLoS ONE 10, e0117133 (2015).
- Baratchi et al. (2017) S. Baratchi, K. Khoshmanesh, O. L. Woodman, S. Potocnik, K. Peter, and P. McIntyre, Trends in Molecular Medicine , 1 (2017).
- Wang, Lu, and Schwartz (2012) C. Wang, H. Lu, and M. A. Schwartz, J Biomech 45, 1212 (2012).
- Wang et al. (2013) C. Wang, B. M. Baker, C. S. Chen, and M. A. Schwartz, Arteriosclerosis, Thrombosis, and Vascular Biology 33, 2130 (2013).
- Dai et al. (2004) G. Dai, M. R. Kaazempur-Mofrad, S. Natarajan, Y. Zhang, S. Vaughn, B. R. Blackman, R. D. Kamm, G. García-Cardeña, and M. A. Gimbrone, Proc Natl Acad Sci USA 101, 14871 (2004).
- Versari et al. (2007) S. Versari, A. Villa, S. Bradamante, and J. A. M. Maier, Biochimica et Biophysica Acta (BBA) - Molecular Cell Research 1773, 1645 (2007).