The Extreme Super-Eddington NLS1 RX J0134.2-4258 – II. A Weak-Line Seyfert Linking to the Weak-Line Quasar
Abstract
RX J0134.2-4258 is one of the most super-Eddington narrow-line Seyfert 1 (NLS1) galaxies, on which we conducted a monitoring campaign from radio to X-rays. In this paper, we present a detailed analysis of its optical/UV spectra and broadband spectral energy distribution (SED). Our study shows that the preferred black hole mass of RX J0134.2-4258 is , giving a mass accretion rate through the outer disc of (assuming zero spin), compared to the observed luminosity ratio . This reduction in radiative efficiency is expected for super-Eddington flows, as power can be lost via advection and/or disc winds. We find that the optical/UV lines of RX J0134.2-4258 resemble those from weak-like quasars (WLQs), as it has notably weak C iv and N v emission lines. It also has drastic X-ray variability, again similar to that recently observed in some other WLQs. However, WLQs have systematically higher masses (), and lower Eddington ratios () than RX J0134.2-4258. We compare instead to the most extreme NLS1s, with similarly large but smaller masses. These show similarly large reductions in radiative efficiency but their UV lines are not similarly wind-dominated. We suggest a new category of weak-line Seyfert (WLS) galaxies to describe sources like RX J0134.2-4258, and interpret its (so far unique) properties in a model, where the lower-disc-temperature in the higher-mass black holes leads to the UV-line-driving mechanism, which enhances the super-Eddington radiation-pressure-driven wind.
keywords:
accretion, accretion discs - galaxies: active - galaxies: nuclei.1 Introduction
1.1 Narrow-line Seyfert 1 Galaxies
Active galactic nuclei (AGN) are powered by accretion onto a super-massive black hole (SMBH). This converts some fraction of the gravitational potential energy into radiation, powering the observed activity. The multi-wavelength properties of AGN are mainly determined by three parameters, namely the black hole mass, black hole spin and mass accretion rate. The inclination angle also plays a significant role in observations (e.g. Luo et al. 2015; Jin et al. 2017b). Narrow-line Seyfert 1 (NLS1) galaxies are a subtype of AGN characterized by relatively narrow broad lines such as H and relatively weak narrow lines such as [O iii]5007 (Osterbrock & Pogge 1985; Boroson 2002). Comparing with the entire AGN population, NLS1s tend to have small black hole masses of and high mass accretion rates (e.g. Pounds, Done & Osborne 1995; Mathur, Kuraszkiewicz & Czerny 2001; Boroson 2002; Jin et al. 2012a).
In the X-ray band, it is common to observe a strong soft X-ray excess in NLS1s (e.g. Boller, Brandt & Fink 1996; Brandt, Mathur & Elvis 1997), which can often be modelled with an ionized disc reflection component (e.g. Miniutti & Fabian 2004; Ross & Fabian 2005; Crummy et al. 2006; Fabian et al. 2013), and/or a separate warm Comptonisation component (e.g. Laor et al. 1997; Magdziarz et al. 1998; Done et al. 2012; Jin et al. 2013; Jin, Done & Ward 2016, 2017a, 2021). Complex absorption (partially ionised material partially covering the source) can also shape the soft X-ray emission in some AGN (e.g. Miller et al. 2007; Turner et al. 2007; Tatum et al. 2012).
NLS1s themselves form two subtypes, including the X-ray simple NLS1s and X-ray complex NLS1s (Gallo 2006). The X-ray simple NLS1s have smooth and steep X-ray spectra, while the X-ray complex NLS1s show more complicated absorption and emission features. Meanwhile, NLS1s with high mass accretion rates, especially super-Eddington, are likely to have a geometrically-thick (i.e. puffed-up) inner disc structure and disc wind (Ohsuga & Mineshige 2011; Takeuchi, Ohsuga & Mineshige 2014; Jiang, Davis & Stone 2016), which can obscure the intrinsic X-ray emission and introduce additional spectral complexities and variability (e.g. Hagino et al. 2016; Done & Jin 2016; Jin et al. 2017b; Parker et al. 2021). Therefore, the difference between X-ray simple and complex NLS1s can be explained by their different inclination angles, which lead to different line-of-sight to the X-ray corona (Done & Jin 2016; Jin et al. 2017b). Supporting evidence for these subtypes being intrinsically the same is that their optical/UV emission is the same, suggesting that their intrinsic disc properties should indeed be similar (Done & Jin 2016).
1.2 Weak-line Quasars
A similar physical scenario of a puffed-up inner disc with significant winds is proposed to explain the properties of weak-line quasars (WLQs, e.g. Fan et al. 1999; Plotkin et al. 2010; Wu et al. 2011, 2012; Luo et al. 2015; Ni et al. 2018). WLQs are characterized by their weak UV high-ionization emission lines, e.g. rest-frame equivalent width (REW) of C iv Å, and/or REW of Ly N v is Å (e.g. Ni et al. 2018). Winds are clearly indicated as the peak of the weak C iv lines is often highly blue-shifted (Richards et al. 2011; Rankine et al. 2020). WLQs have high black hole masses of , and also fairly high but not extreme mass accretion rates of (e.g. Luo et al. 2015). The empirical relation (e.g. Lusso & Risaliti 2016) implies that these are somewhat X-ray weak compared to less luminous quasars, but 35% of the WLQ population show X-ray emission which is at least a factor 6 below this expectation (Pu et al. 2020). This fraction of X-ray weakness is significantly higher than in the non-WLQ AGN population. A plausible explanation is that the high Eddington ratio causes the inner accretion disc of a WLQ to puff up, which partially shields the X-ray emission from near the black hole. Then the observed X-ray emission will depend on the viewing angle, in which case an X-ray weak WLQ will have a higher inclination angle, so that the line-of-sight to the X-ray corona is obscured by the geometrically thick inner disc (e.g. Wu et al. 2011; Luo et al. 2015; Ni et al. 2018).
Therefore, WLQs and super-Eddington NLS1s share some similar properties (Leighly et al. 2007b; Jin et al. 2017b), yet they do also differ significantly in black hole masses and, more importantly, in Eddington ratios, so the disc structure and geometry need not be the same. A more detailed comparison between these two AGN populations would allow us to better understand the evolution of super-Eddington accretion flows with black hole mass and mass accretion rate.
1.3 The Multi-wavelength Campaign on RX J0134.2-4258
We conduct a new multi-wavelength campaign from radio to hard X-rays to observe one of the most extreme super-Eddington NLS1s, namely RX J0134.2-4258 in order to deepen our understanding about super-Eddington accretion. This campaign involves new observations with XMM-Newton, NuSTAR, Swift, ATCA and the 2.3-m telescope in the Sliding Spring Observatory (SSO), as well as a large set of archival multi-wavelength data (see Section 2 and Jin et al. 2022, here after: Paper-I).
RX J0134.2-4258 was discovered by Voges et al. (1999) in the ROSAT all sky survey. Its key properties are summarized below, while a more detailed introduction can be found in Paper-I. This NLS1 lies at the redshift of 0.237, and it appears as an unresolved source in optical. It has a black hole mass of and an extremely high Eddington ratio of (Grupe et al. 2010). It has a steep hard X-ray slope (, Paper-I), typical of NLS1, but has only an extremely weak soft X-ray excess, which is both peculiar and puzzling. In addition, it also exhibits drastic X-ray variability in terms of both spectral shape and flux (Paper-I). Its optical/UV properties such as the extremely weak [O iii] 5007 and blue-shifted C iv were shown to be similar to the WLQ PHL 1811 by Leighly et al. (2007b).
The latest simultaneous XMM-Newton and NuSTAR observations in our campaign caught RX J0134.2-4258 in its one of the lowest X-ray flux states in history, thus we conducted a detailed X-ray spectral-timing analysis. As shown in Paper-I, we found that the time-average X-ray spectra in the low-flux state has excess flux above 4 keV, which is lagged by 4 ks behind the soft X-rays. The spectral-timing properties in both low and high-flux states can be well modelled under the warm Comptonisation plus a distant neutral reflection scenario, or by a partial covering absorption scenario. Both scenarios require a clumpy disc wind in this super-Eddington accretion system.
Here we perform a detailed multi-wavelength study from infrared, through optical/UV and then to X-rays to provide independent constraints on the global properties of the accretion flow. For example, the optical/UV continuum can be used to measure the mass accretion rate through the outer disc (e.g. Davis & Laor 2011; Done & Jin 2016). The optical/UV emission/absorption lines can provide information about the broad-line region and outflows (e.g. Bottorff et al. 1997; Pancoast, Brewer & Treu 2011; Pancoast et al. 2014; Grier et al. 2017; Li et al. 2018), and can also be used to measure virial black hole mass (e.g. Peterson et al. 2004; Vestergaard & Peterson 2006; Peterson 2014; Du & Wang 2019). The infrared emission can be used to constrain the properties of the dusty torus (e.g. Fuller et al. 2016; Collinson et al. 2017; Martínez-Paredes et al. 2017; Landt et al. 2019). The broadband spectral energy distribution (SED) can be used to estimate the black hole mass and Eddington ratio (e.g. Jin et al. 2012a; Jin, Done & Ward 2016; Jin et al. 2017b), which can then be used to measure the global radiative efficiency (, e.g. Davis & Laor 2011). In this work, we collate a large multi-wavelength dataset to study RX J0134.2-4258.
1.4 The Scope of This Paper
This paper presents a detailed study on the optical/UV and broadband SED properties of RX J0134.2-4258, as well as a detailed comparison with some representative super-Eddington NLS1s and WLQs. We will suggest a new category of weak-line Seyfert (WLS) galaxies, and demonstrate that RX J0134.2-4258 is an archetypal WLS.
The structure of this paper is as follows. Firstly, we describe the multi-wavelength datasets used in this work, and then briefly describe the data reduction procedures. Then we present a detailed estimate of the black hole mass of RX J0134.2-4258 because it is a key parameter. Section 4 presents a detailed multi-component broadband SED modelling, in order to derive key parameters such as the bolometric luminosity, mass accretion rate and Eddington ratio. In Section 5, we first compare RX J0134.2-4258 with WLQs, and propose it as an archetypal WLS, i.e. a new category of AGN. Then we use a small sample to conduct a more general comparison between the super-Eddington NLS1 population and the more typically Eddington WLQ population. In Section 6, we propose a picture for super-Eddington accretion flows with different parameters. We show how the disc properties, such as the disc structure, wind and global radiative efficiency, may depend on the black hole mass and mass accretion rate. Section 7 summarizes the main results of this paper. A detailed optical/UV spectral analysis is presented in the appendix.
We adopt a flat universe model throughout this work, with the Hubble constant H km s-1 Mpc-1, and .
| Instrument | Obs-Date | Waveband | |
| (ks) | |||
| New Observations | |||
| NuSTAR FPMA/FPMB | 2019-12-19 | 98.3 | Hard X-ray |
| XMM-Newton EPIC/OM | 2019-12-19 | 134.3 | X-ray/UV |
| Swift XRT/UVOT | 2019-12-19 | 1.6 | X-ray/UV/Optical |
| SSO 2.3-m Telescope | 2019-12-19 | 1.8 | Optical |
| Archival Observations | |||
| XMM-Newton EPIC/OM | 2008-12-11 | 32.1 | X-ray/UV/Optical |
| HST FOS | 1996-09-21 | 1.7 | UV (G130H) |
| HST FOS | 1996-09-21 | 2.1 | UV (G130H) |
| HST FOS | 1996-09-21 | 0.2 | UV (G160L) |
| HST FOS | 1996-09-21 | 1.5 | UV (G190H) |
| HST FOS | 1996-09-21 | 1.2 | UV (G270H) |
| HST FOS | 1996-09-21 | 1.0 | Optical (G400H) |
| HST FOS | 1996-09-21 | 0.6 | Optical (G570H) |
| WISE | 2010-06-20 | – | Infrared (Band 1-4) |
| 2MASS | 1999-08-27 | – | Infrared (J, H, K) |
2 Observations and Data Reduction
We use a large number of observations, from both our new campaign and previous observations. These datasets are listed in Table 1. The XMM-Newton and NuSTAR data have been used in Paper-I for detailed X-ray spectral-timing analysis, where their data reduction are described in more detail.
2.1 X-ray Observations
There are two XMM-Newton (Jansen et al. 2001) observations for RX J0134.2-4258, whose observation dates differ by 11 years. The first observation in 2008 is referred to as Obs-1, and the second in 2019 is Obs-2. These observations also have simultaneous optical/UV data from various filters with the optical monitor (OM). We summarize the data reduction procedures below. The data are downloaded from the XMM-Newton Science Archive (XSA), and reprocessed with the epproc and empproc tasks in the XMM-Newton Science Analysis System (SAS v18.0.0). The source extraction region was chosen to be a circle of 35 arcsec radius, and no pile-up effect was detected during the two observations. The source and background spectra were extracted with the evselect task, and the response and auxiliary files were produced by the rmfgen and arfgen tasks. The data obtained by the optical monitor (OM) were reprocessed with the omichain task.
The NuSTAR (Harrison et al. 2013) observation of RX J0134.2-4258 was conducted simultaneously with the XMM-Newton observation in 2019. The nupipline task inside the HEASoft package (v6.27.2, Blackburn 1995) was used to reprocess the data. The source extraction region was chosen to be a circle with 1 arcmin radius, and the background was extracted from a nearby circular source-free region with the same radius. The nuproducts task was used to extract the spectra.
There are 51 Swift (Gehrels et al. 2004) observations on RX J0134.2-4258 from 2019-12-19 to 2021-08-22. In this work we only use the observation conducted on 2019-12-31, because it is simultaneous with the XMM-Newton and NuSTAR observations. A complete analysis of all the Swift observations will be present in a following paper (Panessa et al. in preparation, hereafter: Paper-III). Six filters were used in the Swift Ultra-violet Optical Telescope (UVOT) during this Swift observation (i.e. UVW2, UVM2, UVW1, U, B and V). The HEASsoft (v6.27.2) package was used to reduce the data. The Swift X-ray Telescope (XRT) data were reprocessed with the xrtpipeline. The source spectrum was extracted from a circular region of 30 arcsec radius. For the UVOT photometric data, a circular aperture of 5 arcsec radius was adopted. Background was chosen from nearby source-free regions with larger areas. We also ran the standard sensitivity check for UVOT, in order to ensure that the data are not affected by the regions on the detector where the throughputs are degraded due to the contamination of dust/debris (Edelson et al. 2015).
2.2 Optical/UV/Infrared Observations
Hubble Space Telescope (HST) observed RX J0134.2-4258 in 1996 with the Faint Object Spectrograph (FOS), which covered the spectral range of 970 – 5500 Å in the AGN rest-frame. The calibrated data were downloaded from the Mikulski Archive for Space Telescopes (MAST), from which the spectra were extracted with the IRAF/STSDAS tasks following the standard procedure111https://www.stsci.edu/instruments/wfpc2/Wfpc2_dhb/intro_ch36.html. We obtained a new optical spectrum of RX J0134.2-4258 with the SSO 2.3-m telescope on 2019-12-19. Infrared photometry from WISE (band: 1 – 4) and 2MASS (band: J, H, K) were downloaded from the NASA/IPAC Infrared Science Archive (IRSA).
Then we analyze the SSO optical and HST UV spectra, fitting for the lines and continuum components. Details are given in Appendix A, with spectra shown in Figure 1a, de-reddened with for the Fitzpatrick & Massa (2007) reddening curve for = 3.1, and de-redshifted for . These data are separated by 23 years but the overall difference of normalization is only 7%. Below 4000Å, the two spectra match almost perfectly after removing this 7% difference, while above 4000Å the HST spectrum is weaker by another 5%. Therefore, we can connect the HST spectrum (scaled up by 1.07) and the SSO spectrum at 4000Å to derive a broad optical/UV spectrum, which is shown in Figure 1b.
The optical spectrum of RX J0134.2-4258 resembles a typical NLS1 galaxy. According to the empirical eigenvector 1 of AGN (e.g. Boroson 2002; Jin, Ward & Done 2012c), the strong Fe ii and weak [O iii]5007 lines imply that RX J0134.2-4258 should have a very high mass accretion rate. Another key property of RX J0134.2-4258 is that its UV spectrum has very weak and blue-shifted C iv and Ly+Nv emission lines, like WLQs. We performed a detailed multiple Gaussian+Lorentzian profile decomposition for different emission lines. The methods and results are described in Appendix A. The optical/UV line decomposition and best-fit parameters can be found in Figures 6, 7 and Tables 6, 7.
 |
 |
3 The Black Hole Mass
Grupe et al. (2010) reported a virial mass of for RX J0134.2-4258, which is based on the single-epoch H full width at half-maximum (FWHM) of 1160 km s-1, and the radius-luminosity (R-L) relation reported by Kaspi et al. (2000). We use the latest SSO optical spectrum and measure the H FWHM to be 1140 20 km s-1 for the Lorentzian decomposition, and 1410 70 km s-1 for the Gaussian decomposition. The monochromatic luminosity at the rest-frame 5100 Å is measured to be erg s-1. For the two H FWHM measurements and using a later R-L relation reported by Vestergaard & Peterson (2006), we obtain a black hole mass of .
However, recent reverberation mapping studies have shown that for super-Eddington AGN, the observed radius of the broad line region (BLR) is smaller than expected from the classic R-L relation (Du et al. 2018). This is likely due to changes in the disc structure and radiation as the flow becomes super-Eddington. Firstly the accretion flow has intrinsically lower radiative efficiency than a standard disc due to advection and/or winds, and secondly the inner disc may become geometrically thick, which, together with any wind, can provide a shielding mechanism for the ionization of BLR (e.g. Abramowicz et al. 1988; Wang & Netzer 2003; Jiang, Stone & Davis 2014; Done & Jin 2016; Jin, Done & Ward 2016; Jin et al. 2017b). As a result, previous versions of R-L relation can lead to an over-estimate of the black hole mass in the super-Eddington regime.
Recently, Du & Wang (2019) reported a new R-L relation which includes the Fe ii to H (broad component) flux ratio () as an additional parameter. This new relation provides lower mass estimates than traditional relations for super-Eddington AGN. For RX J0134.2-4258, is found to be 1.74 0.15 (see Section A.1), which is larger than most of the sources in Du & Wang (2019). Then it is necessary to choose a value for the virial factor , which depends on the morphology of the host galaxy. Since the host galaxy of RX J0134.2-4258 cannot be resolved, different values need to be tried to understand its impact on the mass estimate (see Table 2). Ho & Kim (2014) reported for AGN in pseudo-bulges, which leads to a mass of . Then for AGN in classic bulges or ellipticals with , the mass is . If we choose for the sample of 93 NLS1s reported by Woo et al. (2015), then the mass is found to be . Therefore, it is clear that the uncertainty of affects the single-epoch virial mass significantly. The intrinsic scatter of 0.2 dex of this new R-L relation introduces further uncertainty, and so there is no significant difference between these virial masses.
The rapid X-ray variability provides an independent method to estimate the black hole mass. Various studies have shown that the mass scales with the X-ray rms (Lu & Yu 2001; Zhou et al. 2010; Ponti et al. 2012; Jin, Done & Ward 2016). We calculate the X-ray rms for different variability timescales, leading to a mass range of and a mean value of (see Paper-I). This mass estimate is subject to an intrinsic scatter of 0.7 dex.
Overall, a typical mass estimate of for RX J0134.2-4258 should be statistically consistent with all the mass estimates presented above.
| Method | |||||
|---|---|---|---|---|---|
| () | |||||
| Best-fit SED | 2.00 fixed | 6.3 | 20.6 | 0.31 | 0.017 |
| X-ray Rms | 1.70 0.80 | 7.4 | 28.5 | 0.26 | 0.015 |
| R-L Relation from Du & Wang (2019) | |||||
| () | 0.79 0.25 | 15.9 | 132.0 | 0.12 | 0.007 |
| () | 1.27 0.22 | 9.9 | 51.1 | 0.19 | 0.011 |
| () | 1.70 0.54 | 7.4 | 28.5 | 0.26 | 0.015 |
4 Multi-wavelength Properties
4.1 Broadband Spectral Energy Distribution
4.1.1 Preparation of the Multi-wavelength Data
The study of spectral energy distribution (SED) can provide crucial information about the accretion system, such as the black hole mass and spin, mass accretion rate, the energy budget in different wavebands and spectral components (e.g. Jin et al. 2012a; Done et al. 2012, 2013). The abundant multi-wavelength data collected from our new observations and public data archives allow us to reconstruct the broadband SED of RX J0134.2-4258.
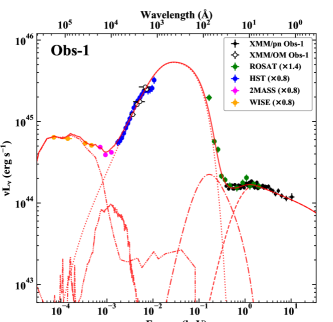
The dataset used to construct the SED is listed in Table 1, which includes XMM-Newton EPIC-pn and five OM filters (UVW2, UVM2, UVW1, U and B) from Obs-1. We neglect Obs-2, with its factor of 4 lower EPIC-pn count rate, as it has a more complex X-ray shape which is most likely due to absorption variability rather than intrinsic spectral change (see Paper-I). We note that the corresponding simultaneous UV fluxes from the OM UVW1 filter are more similar, with Obs-2 being 16 per cent brighter than in Obs-1. The remaining datasets used are Swift XRT and UVOT, ROSAT PSPCB spectrum, HST FOS spectra, 2MASS and WISE photometric points.
RX J0134.2-4258 shows all kinds of emission lines in its optical/UV spectrum, which need to be removed so that the continuum can be used for the SED fitting. These lines will also contribute to the optical/UV photometry, thus we need to perform corrections for all the optical/UV photometric fluxes. We visually inspect the optical/UV spectrum, and choose a series of data points to define the underlying continuum, as shown by the yellow points and blue dash line in Figure 1b. The cyan region between this continuum and the observed spectrum is considered to come from emission lines. The line-free continuum is converted into xspec-readable spectral file for the SED fitting. We also calculate the fraction of continuum flux in every optical/UV band, and then correct the photometric data of the XMM-Newton/OM filters to remove the emission line flux. We calculate the line flux contribution to each filter by convolving the spectra with the full response files of each optical/UV filters, read from the response files stored in the latest calibration database at XMM-Newton222https://heasarc.gsfc.nasa.gov/FTP/xmm/data/responses/om. We calculated the correction factor for every OM and UVOT filter, and then apply it to the corresponding photometric data. The typical correction factor is 5 – 10 per cent, increasing from UV to optical. Finally these data are used as inputs for the SED fitting.
4.1.2 The Accretion Disc Model
RX J0134.2-4258 is an extreme super-Eddington NLS1 (Grupe et al. 2010). In the inner region of such a super-Eddington accretion flow, energy advection and/or disc winds can take away a significant amount of the accretion energy (e.g. Poutanen et al. 2007; Hagino et al. 2016; Done & Jin 2016; Jin et al. 2017b). There are several AGN SED models in xspec (Arnaud 1996), such as optxagnf (Done et al. 2012), agnsed (Kubota & Done 2018) and agnslim (Kubota & Done 2019). Only the latter adopts a slim disc emissivity, where the surface luminosity is kept at the local Eddington limit within a critical radius (Abramowicz et al. 1988; Watarai et al. 2000; Wang & Netzer 2003; Sądowski et al. 2011; Kubota & Done 2019). agnslim uniquely combines this maximum emissivity with the ability to change the local emission to change between blackbody, soft Comptonisation and hard Comptonisation, in order to model the disc, soft excess and hard X-ray corona emission, respectively.
Another major difference between a standard disc and a slim disc is that the inner radius of the disc () is determined by the gas pressure more than by the black hole spin for highly super-Eddington discs (e.g Watarai et al. 2000). This removes the most obvious signature of black hole spin, so we conservatively fix spin at zero here, with the consequence of minimizing the inferred Eddington ratio of the flow.
By default, in the agnslim model the seed photon temperature of the hard X-ray Comptonisation is set to be the temperature of inner disc photons. However, recent studies of X-ray simple super-Eddington NLS1s show that their X-ray spectral-timing properties are better modelled if the warm corona, rather than the inner disc, provides seed photons for the hot corona (Jin et al. 2013; Jin, Done & Ward 2016, 2017a, 2021). Thus we made a small modification to agnslim to link the seed-photon temperature of the hard X-ray Comptonisation to the electron temperature of the warm corona. We refer to this modified agnslim model as agnslimhot, and use it in our subsequent SED analysis.
agnslimhot inherits the full set of parameters of agnslim (see Table 3). The black hole mass is fixed at . The comoving distance is fixed at 937.1 Mpc for redshift . The inclination angle is fixed at 60°, which is larger than 30° as often assumed for normal X-ray simple super-Eddington NLS1s. This is because the enigmatic X-ray variability of RX J0134.2-4258 implies complex and variable absorption, which is more likely to happen at a larger inclination angle. The electron temperature of the hot corona is fixed at 200 keV, and the overall normalization is fixed at 1. The remaining free parameters include the electron temperature , photon index and radius of the warm corona; the photon index and radius of the hot corona; the mass accretion rate through the outer disc and the outer radius of the disc .
 |
4.1.3 Additional Components in the Broadband SED
RX J0134.2-4258 was originally classified as a radio-loud (RL) AGN with a radio loudness of (Grupe et al. 2000), thus there is possibility that the X-ray emission might also include some contribution from the jet, such as the synchrotron self-Compton (SSC) and external Compton (EC) emission (e.g. Kynoch et al. 2018). However, we did not find any evidence of jet emission from X-ray spectral-timing analysis (see Paper-I), and our ongoing radio/optical monitoring campaign shows that RX J0134.2-4258 has returned to a radio-quiet state (see Paper-III). Therefore, the spectral components in the agnslimhot model should be enough to fit the nuclear emission.
To model the hot dust emission in the near infrared, we take the hot dust template from Silva, Maiolino & Granato (2004), and import it into xspec as a local zagndust model. The host galaxy is not resolved in optical images, but it is still possible to identify its flux contribution in the spectrum. We assume it is an Sb galaxy similar to the famous NLS1 RE10, and adopt a corresponding galaxy spectral template from Polletta et al. (2007), which is loaded into xspec as the local hostgal model. Since not all the datasets are simultaneous or observed by the same instrument, there can be normalization discrepancies caused by e.g. long-term variability, different aperture size and flux calibration. Thus we use a free constant to account for the normalization differences between the ROSAT, XMM-Newton and HST data. The data points from 2MASS, WISE and HST join smoothly with each other, and so we use the same constant for these three datasets.
This combination of accretion flow, host galaxy and hot dust, describe the intrinsic continuum, but these spectra are further modified by absorption and reddening along the line of sight.
We use tbabs/ztbabs (Wilms, Allen & McCray 2000) to model the gas absorption from the Milky Way and host galaxy, respectively, with fixed at 1.77 cm-2 for our line of sight (Willingale et al. 2013), and left free. The absorption cross-sections were set to the values of Verner et al. (1996). While this model is a good approximation to the X-ray absorption, it is less good at modelling the impact of this same gas in the UV due to its assumption that the material is completely neutral (but the interstellar medium is multiphase, e.g. McKee 1995; Wolfire et al. 2003) and that the UV absorption is dominated by bound-free edges rather than lines. Nonetheless, both the Galactic column and the host-galaxy column here are rather small (see Section 4.2 below), so this mis-modelling of its UV absorption is not very important.
We also use redden/zredden to model the dust reddening associated with the gas in the Milky Way and the host galaxy, respectively. The Galactic reddening is fixed at 0.0144 (Schlegel, Finkbeiner & Davis 1998), while is left as a free parameter. We note that zredden may not be appropriate to describe the effect of dust in the host galaxy if this is associated with the nuclear region rather than in the interstellar medium (see e.g. Collinson et al. 2015), but this has little impact here as the UV is clearly a very blue spectrum, so the reddening is most probably limited.
| Component | Parameter | Value | Unit |
|---|---|---|---|
| tbabs | 1.77 fixed | cm-2 | |
| redden | 1.44 fixed | ||
| ztbabs | 0.56 | cm-2 | |
| zredden | 0.40 | ||
| zagndust | norm | 1.90 | |
| hostgal | norm | 1.05 | |
| agnslimhot | 2.0 fixed | ||
| agnslimhot | log() | 1.31 | |
| agnslimhot | 0.0 fixed | ||
| agnslimhot | cos | 0.5 fixed | |
| agnslimhot | 0.22 | keV | |
| agnslimhot | 200 fixed | keV | |
| agnslimhot | 2.22 | ||
| agnslimhot | 2.84 | ||
| agnslimhot | 4.65 | ||
| agnslimhot | 5.44 | ||
| agnslimhot | log() | 4.97 | |
| 0.75 | |||
| 1.16 | |||
| 607.3/475 | |||
4.2 Results of the SED Modelling
Based on the above datasets and model configurations, we obtain the best-fit broadband SED for RX J0134.2-4258. Figure 2a shows this SED model, where both model and data are corrected for the Galactic and intrinsic extinction/absorption, and shown in the AGN rest-frame. The best-fit parameters are listed in Table 3.
It is clear that the near-IR emission is dominated by the hot dust components, while the UV continuum is well-fitted by the accretion disc component. There is a small ( per cent) contribution from host galaxy star light between these two in the optical/near-IR band. At higher energies, the soft X-ray emission observed by ROSAT below 0.3 keV is dominated by the emission from the inner disc. The hard X-rays above 2 keV are dominated by a hot corona with photon index of 2.22. There is some evidence for a warm Comptonisation component, with electron temperature of 0.22 keV and photon index 2.84. All these Comptonisation parameters are typical for X-ray simple super-Eddington NLS1s (e.g. Jin et al. 2013; Jin, Done & Ward 2016, 2017a), apart from the soft X-ray excess being much weaker relative to the disc and hot corona as discussed in Paper-I (see also the explicit comparison to RX04 in Section 5.1).
The mass accretion rate through the outer disc () is completely determined by the observed optical/UV emission for the fixed black hole mass and spin, giving , confirming that the accretion flow is highly super-Eddington. A higher value of black hole spin will only increase this. The only way to significantly reduce is to go to higher black hole mass, as the monochromatic luminosity on the Rayleigh-Jeans part of the standard (multi-temperature blackbody) disc continuum has , where (e.g. Shakura & Sunyaev 1973; Davis & Laor 2011; Kubota & Done 2019). Increasing the mass by a factor of 2 (i.e. ) then reduces by a factor of 4, but then is still , so the disc is still super-Eddington even a factor of 2 away from our preferred black hole mass.
The observed bolometric luminosity is derived by integrating the best fit model, and gives ergs s-1. Thus , substantially below the derived for the accretion flow itself. This is clear evidence for a loss of power through advection and/or winds, as expected for a strongly super-Eddington flow.
| Source | Ly + N v REW | Si iv REW | C iv REW | C iv | Mg ii REW | Fe ii REW | H REW | H FWHM | [O iii] REW | |
|---|---|---|---|---|---|---|---|---|---|---|
| (Å) | (Å) | (Å) | (km s-1) | (Å) | (Å) | (Å) | (km s-1) | (Å) | ||
| RE10 | 85.6 8.6 | 22.6 3.2 | 62.1 5.3 | -620 550 | 22.6 1.6 | 24.4 1.8 | 31.7 1.4 | 620 20 | 33.1 2.3 | 0.79 0.07 |
| PH10 | 23.5 2.4 | 6.6 2.1 | 12.1 2.5 | -9900 2400 | – | 53.2 4.2 | 26.1 5.4 | 1700 300 | 4.5 1.3 | 2.33 0.45 |
| PH18 | 28.6 2.9 | 7.9 2.0 | 7.9 2.5 | -1900 1200 | 13.8 2.0 | 33.6 3.0 | 36.1 3.9 | 1900 200 | 3.3 2.8 | 1.11 0.15 |
| RX04 | 37.3 3.7 | 7.5 2.0 | – | – | – | 27.6 2.0 | 24.3 2.5 | 4000 800 | 6.3 0.7 | 1.34 0.16 |
| 1H07 | 39.1 3.9 | 6.9 4.5 | 21.6 5.9 | -1200 1100 | 9.8 1.3 | 44.1 3.3 | 25.4 7.0 | 680 60 | 4.7 3.0 | 2.01 0.47 |
| RX01 | 24.4 2.4 | 8.4 1.2 | 7.6 1.5 | -7600 5700 | 12.1 2.1 | 41.5 3.4 | 23.8 1.2 | 1410 70 | 2.7 0.8 | 1.74 0.16 |
| (F19) | 49.7 5.0 | 9.0 4.2 | 32.6 7.0 | -830 510 | 26.7 2.7 | 31.2 9.3 | 67.5 4.1 | 3210 40 | 17.9 8.2 | 0.53 0.15 |
 |
 |
| () | ( erg s-1) | (%) | ||||||||||
| RE J1034+396: (RE10, , moderate- X-ray simple NLS1) | ||||||||||||
| Obs-1 | 0.2 | 0.5 | 1.7 | 1.7 | 0.057 | 1.00 | 226 | 64 | 60 | 1.33 0.07 | 1.23 0.15 | 16 |
| PHL 1092 (PH10, , WLQ) | ||||||||||||
| Obs-1 | 10.0 | 29.8 | 2.3 | 2.3 | 0.057 | 1.00 | 399 | 61 | 23 | 1.69 0.07 | 0.94 0.08 | 26 |
| Obs-2 | 10.0 | 29.1 | 2.2 | 2.2 | 0.057 | 1.00 | 56900 | 12700 | 23 | 2.49 0.25 | 0.87 0.08 | 22 |
| PHL 1811 (PH18, , WLQ) | ||||||||||||
| Obs-1 | 15.0 | 89.2 | 4.6 | 7.4 | 0.035 | 0.62 | 16500 | 37900 | 17 | 2.46 0.11 | 0.67 0.08 | 17 |
| RX J0439.6-5311 (RX04, , high- NLS1: X-ray simple) | ||||||||||||
| Obs-1 | 0.7 | 5.2 | 5.7 | 11.3 | 0.029 | 0.50 | 90 | 10 | 24 | 1.22 0.04 | 0.91 0.11 | 11 |
| 1H 0707-495 (1H07, , high- NLS1: X-ray complex) | ||||||||||||
| Obs-1 | 0.2 | 2.1 | 8.0 | 22.7 | 0.020 | 0.35 | 320 | 69 | 44 | 1.46 0.04 | 0.57 0.09 | 4 |
| Obs-2 | 0.2 | 2.6 | 9.9 | 31.2 | 0.018 | 0.32 | 1270 | 340 | 44 | 1.85 0.06 | 0.45 0.09 | 3 |
| Obs-3 | 0.2 | 1.7 | 6.5 | 26.4 | 0.014 | 0.25 | 2100 | 1460 | 33 | 2.02 0.08 | 0.55 0.09 | 5 |
| RX J0134.2-4258 (RX J0134.2-4258, , high- NLS1 & WLS) | ||||||||||||
| Obs-1 | 2.0 | 16.3 | 6.3 | 20.6 | 0.017 | 0.31 | 75 | 149 | 22 | 1.40 0.02 | 0.66 0.08 | 12 |
| Obs-2 | 2.0 | 17.3 | 6.7 | 26.2 | 0.015 | 0.26 | 319 | 600 | 20 | 1.70 0.02 | 0.66 0.08 | 13 |
| Quasar Mean SED (Elvis et al. 1994) | ||||||||||||
| – | – | – | – | – | – | – | 27 | 48 | 6 | 1.38 | 0.80 | 34 |
| Quasar Mean SED (Richards et al. 2006) | ||||||||||||
| – | – | – | – | – | – | – | 103 | 109 | 4 | 1.53 | 0.85 | 37 |
References for the redshifts and black hole mass estimates: RE10: Jin, Done & Ward 2021; PH10: Miniutti et al. 2012; Marinello et al. 2020; PH18: Leighly et al. 2007a, b; RX04: Jin, Done & Ward 2017a, Jin et al. 2017b; 1H07: Done & Jin 2016; RX J0134.2-4258: this work; Quasar mean SEDs: Elvis et al. 1994, Richards et al. 2006.
 |
 |
 |
 |
5 Discussion
5.1 Weak UV Lines and the SEDs of Super-Eddington Flows
The weak UV lines of RX01 resemble those from WLQs, defined as Ly + N v REW 15 Å, and C iv REW 10 Å (Fan et al. 1999; Diamond-Stanic et al. 2009; Plotkin et al. 2010; Wu et al. 2011, 2012; Luo et al. 2015; Ni et al. 2018). In this section, we compare RX01 with some typical WLQs and NLS1s (see Table 5)333Note that the estimates of the mass, mass accretion rate and bolometric luminosity are all subject to various systematic uncertainties, so we only show their typical values and do not provide their uncertainties in Table 5., in order to obtain a full understanding of their similarities and differences.
5.1.1 PHL 1811 (hereafter: PH18): typical WLQ
So far, most of the known WLQs lie at relatively high redshifts with . This redshift distribution is partly a selection effect as the C iv line is redshifted into the more easily accessible optical band where wide area surveys such as Sloan Digital Sky Survey (SDSS, York et al. 2000, 3000 – 9200 Å) detect a large number of sources. However, it is also possible to find WLQs at lower redshifts from pointed UV spectroscopic observations (e.g. McDowell et al. 1995; Londish et al. 2004), such as the classic WLQ PH18 at , whose black hole mass is and mass accretion rate (Leighly et al. 2007a, b; Wu et al. 2012; Luo et al. 2015).
Leighly et al. (2007a) first noticed the similarity of weak UV lines between PH18 and RX01 in the wavelength range of 1000-1600Å. Here we compare the entire optical/UV spectra of RX01 (black) and PH18 (orange), as shown in Figure 3 panels a1 and b1. It is clear that these two AGN have remarkably similar optical/UV lines, including the strong optical Fe II lines, extremely weak oxygen forbidden lines, and very weak and blue-shifted UV C iv, C iii] and N v lines. Their optical/UV underlying continua also have similar shapes. Their optical continua, after correcting for the Galactic reddening, are consistent with a standard thin disc model (dotted grey curve: Shakura & Sunyaev 1973), while their UV continua appear flatter at 2300 Å. We apply the same line fitting method as described in Section A.2 to measure the REWs of the UV lines of PH18. We find Ly + N v REW = 28.6 2.9 Å and C iv REW = 7.9 2.0 Å (for C iv 1548 + C iv 1551) for PH18, which are remarkably similar to RX01 (see Table 4).
However, PH18 has a black hole mass which is around an order of magnitude higher than RX01. We fit the broad band SED of PH18 with the same models as used for RX01, fixing black hole spin at , so the model parameters are all directly comparable. This gives (see Table 5), a factor of 3 lower than that of RX01.
We compare their broad band SEDs as the solid black and solid orange lines in Figure 4a. The lower black hole mass and higher of RX01 predict a higher inner disc temperature, but it is clear that the WLQ PH18 has much less X-ray emission relative to the disc peak, and that the X-rays have complex shape. More quantitatively, we adopt the optical-to-X-ray index (, e.g. Lusso et al. 2010) as,
| (1) |
where and are the luminosities at 2 keV and 2500 Å. We find is 2.46 0.11 for PH18, but is only 1.40 0.02 for Obs-1 of RX01. Paper-I shows that RX01 also has a complex X-ray spectral shape when it is X-ray weaker. We include this Obs-2 spectrum as the dashed black line in Figure 4a. Clearly it is not so extremely X-ray weak as PH18, as confirmed by its of 1.70 0.02, but the same mechanisms may well be at work, most likely absorption and scattering in a clumpy wind (Done & Jin 2016; Jin et al. 2017b). Such winds are clearly expected from super-Eddington sources.
Then we compare the broadband SED and optical/UV spectra of RX01 to some other well-known super-Eddington AGN.
5.1.2 PHL 1092 (hereafter: PH10): typical WLQ
PH10, lying at , is often discussed as a WLQ, though its UV line REWs are slightly larger than the formal definition. Its mass is , similar to PH18, but is one order of magnitude larger than RX01. Its mass accretion rate is only mildly super-Eddington at (Miniutti et al. 2012; Marinello et al. 2020, see Table 5). Nonetheless, Figure 3 panels a2 and b2 shows its UV/optical spectra (green line) are very similar in both continuum shape and line emission to RX01 (black line). Its broadband SED shows dramatic soft and hard X-ray variability. One SED observation (Obs-1 of PH10, Figure 4a, green solid line) shows a strong soft X-ray excess, together with harder X-ray emission which has , similar ratio to the disc power as in RX01. The other SED observation (Obs-2 of PH10, green dashed line) shows a much reduced soft X-ray flux, together with extremely weak and complex harder X-ray emission, whose increases to 2.49 0.25, similar to the X-ray weak WLQ PH18.
5.1.3 1H 0707-495 (hereafter: 1H07): high- NLS1
A dramatic change in the soft and hard X-ray fluxes is also seen in the famous NLS1 1H07. This source shows a strong soft X-ray excess and stochastic dips in the 0.3-10 keV light curve as observed by e.g. XMM-Newton and eROSITA (Wilkins et al. 2014; Done & Jin 2016; Boller et al. 2021). The drastic X-ray variability may be originated from complex absorption in the wind (Hagino et al. 2016; Parker et al. 2021). Besides, it has a similar super-Eddington accretion flow as RX01, with , by an order of magnitude lower mass, (Done & Jin 2016, see table 5). We show its UV/optical spectra in magenta in Figure 3 panels a3 and b3. Plainly its optical continuum and lines are very similar to RX01 and WLQs. However, the UV lines are now not so much alike, in that 1H07 shows a substantial REW core which is not strongly blue-shifted (see table 4). Assuming that the blue-shifted wing of the C iv is showing the wind strength, then 1H07 has a less strong wind despite the accretion flow being similarly super-Eddington to RX01, and much more super-Eddington than PH18 and PH10. Figure 4b shows three distinct SEDs of 1H07 (magenta lines and data, similar to those reported by Done & Jin 2016) compared to both observations of RX01 (black solid and dashed lines). This clearly shows that not only are the hard X-rays affected by this complex absorption/scattering in the wind, but the shape and strength of the soft X-rays can also change. As a result, the optical-to-X-ray index varies between 1.4 and 2.0. Thus it may also be that the strangely weak soft X-ray excess in RX01 is due to some obscurers in our line-of-sight rather than being intrinsic.
5.1.4 RX J0439.6-5311 (hereafter: RX04): high- NLS1
We explore this further using another super-Eddington source, RX04 ( for : Jin et al. 2017b, see Table 5). This is an archetypal X-ray simple NLS1 so has very little complex X-ray variability, making it likely that we have a clean line-of-sight to this object. Figure 3 panels a4 and b4 shows the UV and optical spectra of RX04 (red spectra) compared to RX01. Again there is a continuum bend in the UV, indicating that this is an intrinsic feature rather than being due to reddening in the host galaxy. Unfortunately, the HST spectra do not cover the C iv line, but the Ly+N v REW is larger than the formal definition of a WLQ despite the similarity in Si iv line shape and REW (see Table 4). Figure 4c shows the broadband SED of RX04 (red line) compared to the Obs-1 SED of RX01 (black line). The soft X-ray excess of RX04 is much stronger than RX01, which is quantitatively confirmed by the smaller optical-to-X-ray index of RX04 (see Table 5).
A possible explanation is that the soft excess of RX01 is intrinsically present, but is severely suppressed due to complex and variable obscuration/scattering in the wind. Indeed, this is also seen in the variability of PH10 and 1H07 that the extent of the soft X-ray emission can be dramatically reduced. Especially, the soft X-ray bright state of PH10 (its Obs-1, green solid line in Figure 4c) looks like RX04, while the soft X-ray weak state of PH10 is more like RX01. However, while wind obscuration/scattering seems to be a good explanation for the extremely weak soft excess of RX01, it remains difficult to understand how its hard X-rays are apparently seen directly, i.e. not suppressed by the wind as much as the soft excess does.
5.1.5 RE J1034+396 (hereafter: RE10): moderate- NLS1
Alternatively, we explore the idea that the very steep soft X-ray emission of RX01 is intrinsic. One of the steepest soft X-ray AGN is RE10, a source which uniquely shows a persistent X-ray quasi-periodic oscillation in AGN (QPO: Gierliński et al. 2008; Middleton, Uttley & Done 2011; Alston et al. 2014; Jin, Done & Ward 2020). This is a very low mass black hole, with for (Jin, Done & Ward 2021). Figure 3 panels a5 and b5 shows its UV and optical spectra (blue spectra) compared to RX01. Plainly the optical spectrum is very different, probably due to strong host galaxy contamination (e.g. Czerny et al. 2016; Jin, Done & Ward 2021). The UV continuum shape is similar to RX01 (black line) but the UV lines are much stronger, making it unlike a WLQ (see Table 4). Figure 4c also includes the broadband SED of RE10 (blue line), with a similar hard X-ray shape as in RX01, but a much stronger steep soft X-ray excess. The optical-to-X-ray index of RE10 is 1.33 0.07. The very steep soft X-ray emission here is most likely the inner edge of the disc, with perhaps a small contribution from a warm Comptonisation region (see e.g. Done et al. 2012). This very steep soft X-ray spectrum is a feature of the newly discovered Quasi-Periodic Eruptions (QPE), seen in a very rare class of AGN. Intriguingly, the characteristic eruptions are clearly marked by a dramatic increase in soft X-ray excess emission (Miniutti et al. 2019; Arcodia et al. 2021).
5.1.6 AGN Composite Spectra
Finally, we compare the composite QSO spectrum from Francis et al. (1991) with RX01, as shown in the cyan line in Figure 3 panels a6 and b6. In the optical band, the composite spectrum has stronger oxygen lines and weaker Fe ii lines, indicating that the average Eddington ratio of the QSO sample is smaller. In the UV band, the composite spectrum has a continual shape similar to RX01 and PH18, making it quite unlikely that the bend away from the standard disc shape in the UV is due to host galaxy reddening as this would require the RX01, PH18 and the composite spectrum to have very similar E(B-V). Instead, the bend looks like an intrinsic spectral feature. The composite spectrum also has stronger and less blue-shifted emission lines than WLQs. For example, we measure Ly + N v REW = 49.7 Å and C iv REW = 32.6 Å for the composite spectrum, which are even larger than 1H07 and RX04 (Table 4). The SED shape is very different to all the super-Eddington SEDs, with no strong evidence for a larger extreme-UV (EUV) component (Figure 4d).
5.1.7 Weak-Line Seyfert Galaxy
To summarize this section: RX01 has weak and blue-shifted UV emission lines sufficient to class it as a WLQ, but it has much lower black hole mass and higher mass accretion rate than most WLQs. While at the moment this is a unique object, we propose that such sources be called Weak Line Seyferts (WLS).
In comparison, objects with similarly super-Eddington mass accretion rates as RX01, but lower masses have UV emission lines which are not so weak and blue-shifted, so would not be defined as WLS, but rather classed as super-Eddington NLS1.
Most super-Eddington AGN with both low and high black hole masses show strong and complex soft and hard X-ray variability, plausibly due to an absorption/scattering in a clumpy wind. Our viewing angle with respect to this wind as well as the wind properties will determine the impact of this extrinsic variability (separate to the intrinsic variability of the corona/soft X-ray emission region) on the observed X-ray spectrum. This impacts on the derived optical-to-X-ray index , by reducing the observed X-ray flux when the wind material is in the line of sight, so that these events can be identified by the source being X-ray weaker than expected at a given 2500 Å luminosity.
Interestingly, the dusty torus offers an independent viewing angle which is nearly edge-on (Antonucci 1993). It reprocesses the emission from the inner accretion flow and re-emits in the near infrared, thus the intensity of infrared torus emission may also provide clues about the properties of accretion flow. Indeed, Figure 4a shows that the relative infrared luminosities of RX01 and PH18 are very similar. More quantitatively, we adopt the optical-to-infrared index (, Castelló-Mor et al. 2017) as,
| (2) |
where and are the luminosities at 2500 Å and 5 m. Assuming an uncertainty of 10 per cent for the infrared luminosity, we find is 0.67 0.08 for PH18 and 0.66 0.08 for both SEDs of RX01 (see Table 5). Hence it is likely that their torii also see similar SEDs from their separate accretion flows, which increases the global similarity between WLS and WLQs.

5.2 Efficiency of Super-Eddington Accretion Flows in AGN
The global radiative efficiency () is a key parameter of the accretion flow around SMBHs, which indicates the fraction of accreted energy that is converted into radiation. can be estimated by measuring the difference between the observed Eddington ratio and mass accretion rate (Davis & Laor 2011). In Table 5 we have estimated the radiative efficiency for RX01 from its best-fit SEDs, which is found to be 30 per cent of the theoretical efficiency of a standard thin disc for and zero spin. Likewise, we measure for the other AGN mentioned in this work based on their best-fit SEDs, which are shown in Table 5.
We find that as increases, decreases significantly. This is qualitatively consistent with theoretical expectation that as the accretion flow becomes more super-Eddington, its properties deviate from the standard thin disc more significantly, the advection and wind may carry away a larger fraction of accretion energy, thus the global radiative efficiency becomes smaller. For instance, Poutanen et al. (2007) derived a simple equation, ln, to describe the relation between the Eddington ratio and mass accretion rate for super-Eddington accretion flows. The factor is directly related to . For a super-Eddington disc with advection but without outflow, the factor is 1.0; while for a disc with outflow but without advection, the factor is 0.6. In Figure 5 we plot our small AGN sample on the parameter space of and , and compare them with various theoretical relations. We find that for a fixed , the observed Eddington ratio is a factor of few higher than the disc+advection and disc+outflow model, and the deviation increases as AGN becomes more and more super-Eddington. This suggests that while the actual radiative efficiency of a super-Eddington accretion flow is significantly lower than that of a standard thin disc (Shakura & Sunyaev 1973), it remains higher than those predicted by previous super-Eddington disc models.
Based on the six AGN in Figure 5, we perform second-order polynomial model fit to derive an empirical relation between and ,
| (3) |
where , , and are derived from the parameter values and inferred uncertainties. This equation can be used to infer the radiative efficiency for an AGN with , but it is limited by the small sample size, and so it should be refined by future large sample studies.
Figure 5 also shows the inferred uncertainty region for every source. The uncertainty of is mainly caused by the measurement accuracies of the black hole mass , spin (we assumed spin 0 in this work as a conservative limit) and bolometric luminosity . The typical measurement uncertainty of is a few tens of per cent for a well defined SED of an unobscured super-Eddington AGN with high-quality optical/UV and soft/hard X-ray data (e.g. Jin, Ward & Done 2012c; Jin et al. 2013, 2017b; Jin, Done & Ward 2021). The black hole spin is largely unknown, but Davis & Laor (2011) showed that spin can introduce a few tens of per cent uncertainty on . However, this can be easily overwhelmed by the uncertainty of black hole mass estimate, because this uncertainty can be a factor of few, and we have for an observed optical/UV luminosity, so the uncertainty propagated from to is square-amplified. The uncertainty regions in Figure 5 are based on these black hole mass ranges and 50 per cent uncertainty of , and we have also assumed that cannot exceed . We find that except RE10 and PH10 whose values are only 1.7 and 2.3, all the other uncertainty regions lie between the standard thin disc model and the disc+advection/outflow models. Therefore, considering various measurement uncertainties, it appears robust that the observed radiative efficiencies of our super-Eddington AGN sample are indeed lower than the prediction of standard thin disc model, but significantly higher than predictions of theoretical super-Eddington disc models.
It is also useful to compare our results with numerical simulations of super-Eddington accretion flows. For example, Jiang, Stone & Davis (2014) performed three-dimensional (3D) radiation magneto-hydrodynamical (MHD) simulations for an AGN with and . These parameters are comparable with those of RX04. Jiang, Stone & Davis (2014) reported , which then leads to , as shown by the star symbol in Figure 5. This radiative efficiency is significantly higher than those predicted by most theoretical models. It is caused by the inclusion of magnetic buoyancy in the simulation, which enhances the vertical advection of radiation, thereby increasing the global radiative efficiency. The efficiency we found for RX04 is 0.029, which is also much higher than previous theoretical models, but is 55 per cent lower than the 3D MHD simulation.
The observed correlation in Figure 5 for the extreme super-Eddington regime is broadly consistent with the moderate correlation reported by Davis & Laor (2011) using a much larger sample of both sub and super-Eddington Palomar-Green quasars. Davis & Laor (2011) also reported a significant correlation between the radiative efficiency and the black hole mass, which can be explained by the mass-spin correlation predicted by the cosmic evolution of SMBH (Fanidakis et al. 2011). We do not find such a relation in our small sample, which is probably because these six AGN only cover a narrow mass range, and so the effect of mass-spin correlation is negligible.
5.3 A Proposed Picture for Super-Eddington Accretion Flows Depending on and

Super-Eddington NLS1s and WLQs are both characterized by their high mass accretion rates, but their black hole masses differ by more than one order of magnitude, thus comparing these two types of AGN can bring new insights on the super-Eddington accretion flow of SMBH. Based on their different multi-wavelength properties, a puffed-up inner disc scenario was proposed for both types of SMBH accretion systems (e.g. Luo et al. 2015 for WLQs and Jin et al. 2017b for NLS1s). This was discussed even in the original paper of Shakura & Sunyaev (1973), where they show that the flow forms a quasi-spherical funnel when the disc reaches the local Eddington limit, within the spherization radius where is the inner radius (see also Poutanen et al. 2007, Kubota & Done 2019). We can derive a rough estimate of this radius for each object. Such an inner disc structure will produce a geometric collimation of the inner disc/soft X-ray/hard X-ray emission. This inclination dependence will be enhanced by any wind from the super-Eddington flow, and strong evidence for a wind is seen in the rapid and complex X-ray variability. However, both the funnel and the super-Eddington wind might be expected to depend only on rather than on mass, yet we showed examples in the previous section where sources at similar high Eddington fractions have weaker/more blue-shifted UV lines at higher masses, so there should be another intrinsic factor at work as well.
One possibility is that there is an additional wind from the disc due to UV line driving. This is already implicated in the WLQ by the fact that the UV lines (C iv and Ly+N v) are blue-shifted. UV line driving is sensitively dependent on the disc temperature which depends on as well as . A continuum SED which peaks in the UV (as in the mildly super-Eddington high mass AGN) is much more efficient in UV line driving than one that peaks in the EUV/soft X-rays (as in the strongly super-Eddington low-mass NLS1s). Hence this gives a component which depends on mass as well as . Based on the above ideas, we compare the inferred structure of super-Eddington accretion discs for different black hole masses and mass accretion rates, which is shown in Figure 6.
The first row is the puffed-up disc scenario proposed for WLQs such as PH18 and PH10 (e.g. Wu et al. 2012; Luo et al. 2015; Ni et al. 2018). Since their mass accretion rates are close to or slightly above the Eddington limit, the puffed up region is quite small (a few tens of ), and the Eddington wind is not very powerful. However, these structures shield the rest of the disc from the hottest emission (inner funnel and X-ray corona). The maximum outer disc temperature is given at the radius where the puffed up region starts. To infer the SED shape outside the spherization radius, we adopt the optxagnf model (Done et al. 2012) and take the best-fit and listed in Table 5 as inputs444As a rough comparison, we take the average of 25 for 1H07, and 20.6 for RX01., and then truncate the SED at . As shown in Figure 7, for WLQs with masses of , this outer disc emits in the UV, and is just below Eddington. This should power an extremely strong UV line-driven disc wind. This shields the standard BLR from the outer disc from the inner UV/X-ray emission, so the standard BLR which makes the core of the lines is weak, so the UV lines are dominated by the wind emission, giving the characteristic blueshift of the BLR line profile. In Figure 6, we also show the failed dust-driven wind from the model of Czerny & Hryniewicz (2011), where it is suggested that the BLR is itself a (failed) wind, but driven by dust rather than by the UV555This disc scenario may also be applicable for another famous AGN called PDS 456. It is a low-redshift AGN located at with and (Simpson et al. 1999; Reeves et al. 2000). It is famous for showing extreme X-ray variability and X-ray absorption features indicating ultra-fast outflows (Reeves et al. 2020 and references therein). Besides, it is known to show weak [O iii] line with REW 2 Å (Simpson et al. 1999), as well as weak UV high-ionization lines such as C iv REW Å and broad UV absorption lines (Hamann et al. 2018). These multi-wavelength properties are similar to RX01 and PH18, although its C iv is still stronger than the definition of WLQ. PDS 456 also shows a low level of radio emission, although it can be classified as a radio-quiet AGN (Vignali et al. 2000; Yang et al. 2021)..
The second row of Figure 6 shows the disc scenario for the archetypal super-Eddington NLS1 RX04 (Jin et al. 2017b). Comparing to PH18, its black hole mass is one order of magnitude lower, and its mass accretion rate is one order of magnitude higher, thus we expect the disc to be much hotter () and the puffed-up disc region to be larger ( 50 ), and so the super-Eddington disc wind may be more powerful. This again shields the outer disc from the hottest parts of the disc, but the disc temperature just outside of the funnel region is somewhat hotter than seen in WLQs (see Figure 7). This stronger emission below 200Å could be enough to over-ionise the disk wind, so the UV line driving is not efficient. The UV wind then does not shield the core of BLR as efficiently, so the core of the UV lines (e.g. C iv) are stronger, as well as the blue-wing of the lines being weaker (due to the weaker UV wind), so these line profiles do not meet the criteria for a WLQ.

The above picture is further supported by the multi-wavelength properties of the WLS RX01, whose black hole mass and mass accretion rates are both higher than RX04, as shown in the third row of Figure 6. In this case, higher mass accretion rate means that the disc can begin to puff up at an even larger radius of 100 , and so an even stronger super-Eddington wind is expected. This clumpy wind absorbs the soft X-rays of RX01 and causes its drastic X-ray variability, similar to those observed in PH10 and PDS 456. But the emission from the disk outside of the funnel is now similar to that of the WLQ (see Figure 7), so this can have a similarly strong UV line driven wind, and so weak core lines from the BLR, and UV lines dominated by the UV line driven disc wind. Then the UV line-driving mechanism still works efficiently at outer/cooler disc region, making RX01 the so far unique WLS. This also explains why RX01 and PH18 show similar infrared luminosity from hot torus relative to their optical luminosity.
A jet is also drawn in this picture, because the radio-loudness of RE10 was reported to be , and so it was a marginally radio-loud NLS1 more than one decade ago (Gelbord, Mullaney & Ward 2009). But our latest observation campaign shows that now it becomes a radio-quiet source, and so its jet emission may be episodic (see more details in Paper-III).
The last row of Figure 6 shows the disc scenario for 1H07, whose is similar to RX01, but with one order-of-magnitude lower black hole mass. In this case, the accretion disc is the hottest among all the AGN mentioned above, and so the super-Eddington wind is also the strongest, which leads to drastic X-ray variability (e.g. Hagino et al. 2016; Done & Jin 2016; Boller et al. 2021; Parker et al. 2021). The disc emission outside of the funnel region is now similar to RX04 (see Figure 7), just a little too high for the UV line driving to be efficient, so the blue-shifted line from the wind is not strong and the core BLR is not shielded. This explains why 1H07 does not turn out to be a WLS.
Finally, we emphasize that our study of the similarities and differences between super-Eddington NLS1s and WLQs is just at the beginning. More similarities/differences may be found by future studies, including detailed photoionization analyses of the BLRs of super-Eddington NLS1s and WLQs assuming different illuminating SEDs. If the above scenarios are generally correct, we speculate that further studies may find more WLS, as well as more WLQs showing drastic X-ray variability.
6 Summary and Conclusions
We carried out a multi-wavelength campaign on the enigmatic super-Eddington NLS1 RX J0134.2-4258 from radio to optical/UV to X-rays, using both space and ground-based telescopes. In this work, we present a detailed optical/UV spectroscopic analysis as well as broadband SED analysis from infrared to X-rays, and compare these multi-wavelength properties with other super-Eddington NLS1s and WLQs, thereby yielding deeper understanding about the super-Eddington accretion flows around SMBHs. The main results of this paper are summarized below.
-
•
the optical/UV spectra of RX J0134.2-4258 show extremely weak UV high-ionization lines such as C iv, Si iv and N v, which are consistent with the definition of a WLQ. Together with other similarities such as the drastic X-ray variability and optical-to-infrared flux ratio, we propose RX J0134.2-4258 as a new category of AGN, namely the weak-line Seyfert (WLS), which can be considered as the low mass and higher mass accretion rate counterpart of WLQs.
-
•
we build the broadband SED of RX J0134.2-4258, which shows that the soft excess of RX J0134.2-4258 is more than one order of magnitude weaker than in X-ray simple super-Eddington NLS1s. For a preferred black hole mass of and , the mass accretion rate is found to be 20, is 6, so the radiative efficiency is only 30 per cent of that of a standard thin disc.
-
•
by performing a systematic comparison within a small but representative super-Eddington AGN sample, we find that the most extreme NLS1s with similarly large but smaller masses than RX J0134.2-4258 do not show similarly weak and wind-dominated UV high-ionization lines as WLQs and WLS do. Thus the properties of accretion flow should depend on both black hole mass and mass accretion rate.
-
•
in the super-Eddington regime, the observed global radiative efficiency of the accretion flow decreases significantly as the mass accretion rate increases. The measured efficiency is higher than expected from the standard thin disc model and previous super-Eddington disc models, but lower than previous 3D MHD simulations of super-Eddington AGN discs.
-
•
we propose a picture to show the dependence of super-Eddington accretion flows on the black hole mass, mass accretion rate and inclination angle, which can be used to qualitatively understand the multi-wavelength spectral differences between different subtypes of super-Eddington AGN, including super-Eddington NLS1s, WLQs and WLS.
The multi-wavelength long-term variability of RX J0134.2-4258 from radio to X-rays as revealed by our ATCA observations and ongoing Swift observations will be presented in our next paper (Paper-III).
Acknowledgements
CJ thanks Niel Brandt, Jianfeng Wu, Jianmin Wang, Yanrong Li and Erlin Qiao for valuable discussions, and thanks Peng Jiang, Hongyan Zhou and Weimin Yuan for helping with the coordination of optical observations. We thank Murilo Marinello for sharing with us the high-quality optical/UV/IR spectra of PH10. We thank the teams of the Swift satellite and the Siding Spring Observatory for approving and conducting the target-of-opportunity observations, as well as helping with the data reduction. We also thank the XMM-Newton team for helping to investigate instrumental issues related to the OM data.
CJ acknowledges the National Natural Science Foundation of China through grant 11873054, and the support by the Strategic Pioneer Program on Space Science, Chinese Academy of Sciences through grant XDA15052100. CD acknowledges the Science and Technology Facilities Council (STFC) through grant ST/T000244/1 for support. HL acknowledges the support by Chinese Postdoctoral Science Foundation (2021M693203), and the National Natural Science Foundation of China through grant 12103061.
This work is based on observations conducted by XMM-Newton, an ESA science mission with instruments and contributions directly funded by ESA Member States and the USA (NASA). This work also makes use of data from the NuSTAR mission, a project led by the California Institute of Technology, managed by the Jet Propulsion Laboratory, and funded by the National Aeronautics and Space Administration. This research has made use of the XRT Data Analysis Software (XRTDAS) developed under the responsibility of the ASI Science Data Center (ASDC), Italy.
Data Availability
The data underlying this article are publicly available from the High Energy Astrophysics Science Archive Research Center (HEASARC) at https://heasarc.gsfc.nasa.gov, the XMM-Newton Science Archive (XSA) at https://www.cosmos.esa.int/web/xmm-newton/xsa, the Barbara A. Mikulski Archive for Space Telescopes (MAST) at https://mast.stsci.edu/portal/Mashup/Clients/Mast/Portal.html, the Sloan Digital Sky Survey (SDSS) at http://skyserver.sdss.org/dr12/en/home.aspx. The SSO optical spectrum in this article will be shared on reasonable request to the corresponding author.
References
- Abramowicz et al. (1988) Abramowicz M. A., Czerny B., Lasota J. P., Szuszkiewicz E., 1988, ApJ, 332, 646
- Alston et al. (2014) Alston W. N., Markeviciute J., Kara E., Fabian A. C., Middleton M., 2014, MNRAS, 445, L16
- Antonucci (1993) Antonucci R., 1993, ARA&A, 31, 473
- Arcodia et al. (2021) Arcodia R., Merloni A., Nandra K., Buchner J., Salvato M., Pasham D., Remillard R., et al., 2021, Natur, 592, 704
- Arnaud (1996) Arnaud K. A., 1996, ASPC, 101, 17
- Baskin & Laor (2018) Baskin A., Laor A., 2018, MNRAS, 474, 1970
- Blackburn (1995) Blackburn J. K., 1995, ASPC, 77, 367
- Boller, Brandt & Fink (1996) Boller T., Brandt W. N., Fink H., 1996, A&A, 305, 53
- Boller et al. (2021) Boller T., Liu T., Weber P., Arcodia R., Dauser T., Wilms J., Nandra K., et al., 2021, A&A, 647, A6
- Boroson (2002) Boroson T. A., 2002, ApJ, 565, 78
- Bottorff et al. (1997) Bottorff M., Korista K. T., Shlosman I., Blandford R. D., 1997, ApJ, 479, 200
- Brandt, Mathur & Elvis (1997) Brandt W. N., Mathur S., Elvis M., 1997, MNRAS, 285, L25
- Castelló-Mor et al. (2017) Castelló-Mor N., Kaspi S., Netzer H., Du P., Hu C., Ho L. C., Bai J.-M., et al., 2017, MNRAS, 467, 1209
- Coatman et al. (2016) Coatman L., Hewett P. C., Banerji M., Richards G. T., 2016, MNRAS, 461, 647
- Collinson et al. (2015) Collinson J. S., Ward M. J., Done C., Landt H., Elvis M., McDowell J. C., 2015, MNRAS, 449, 2174
- Collinson et al. (2017) Collinson J. S., Ward M. J., Landt H., Done C., Elvis M., McDowell J. C., 2017, MNRAS, 465, 358
- Crummy et al. (2006) Crummy J., Fabian A. C., Gallo L., Ross R. R., 2006, MNRAS, 365, 1067
- Czerny & Hryniewicz (2011) Czerny B., Hryniewicz K., 2011, A&A, 525, L8
- Czerny et al. (2015) Czerny B., Modzelewska J., Petrogalli F., Pych W., Adhikari T. P., Życki P. T., Hryniewicz K., et al., 2015, AdSpR, 55, 1806
- Czerny et al. (2016) Czerny B., You B., Kurcz A., Średzińska J., Hryniewicz K., Nikołajuk M., Krupa M., et al., 2016, A&A, 594, A102
- Davis & Laor (2011) Davis S. W., Laor A., 2011, ApJ, 728, 98
- Diamond-Stanic et al. (2009) Diamond-Stanic A. M., Fan X., Brandt W. N., Shemmer O., Strauss M. A., Anderson S. F., Carilli C. L., et al., 2009, ApJ, 699, 782
- Done et al. (2012) Done C., Davis S. W., Jin C., Blaes O., Ward M., 2012, MNRAS, 420, 1848
- Done et al. (2013) Done C., Jin C., Middleton M., Ward M., 2013, MNRAS, 434, 1955
- Done & Jin (2016) Done C., Jin C., 2016, MNRAS, 460, 1716
- Dong et al. (2008) Dong X., Wang T., Wang J., Yuan W., Zhou H., Dai H., Zhang K., 2008, MNRAS, 383, 581
- Du et al. (2018) Du P., Zhang Z.-X., Wang K., Huang Y.-K., Zhang Y., Lu K.-X., Hu C., et al., 2018, ApJ, 856, 6
- Du & Wang (2019) Du P., Wang J.-M., 2019, ApJ, 886, 42
- Edelson et al. (2015) Edelson R., Gelbord J. M., Horne K., McHardy I. M., Peterson B. M., Arévalo P., Breeveld A. A., et al., 2015, ApJ, 806, 12
- Elvis et al. (1994) Elvis M., Wilkes B. J., McDowell J. C., Green R. F., Bechtold J., Willner S. P., Oey M. S., et al., 1994, ApJS, 95, 1
- Fabian et al. (2013) Fabian A. C., Kara E., Walton D. J., Wilkins D. R., Ross R. R., Lozanov K., Uttley P., et al., 2013, MNRAS, 429, 2917
- Fan et al. (1999) Fan X., Strauss M. A., Gunn J. E., Lupton R. H., Carilli C. L., Rupen M. P., Schmidt G. D., et al., 1999, ApJL, 526, L57
- Fanidakis et al. (2011) Fanidakis N., Baugh C. M., Benson A. J., Bower R. G., Cole S., Done C., Frenk C. S., 2011, MNRAS, 410, 53
- Fitzpatrick & Massa (2007) Fitzpatrick E. L., Massa D., 2007, ApJ, 663, 320
- Francis et al. (1991) Francis P. J., Hewett P. C., Foltz C. B., Chaffee F. H., Weymann R. J., Morris S. L., 1991, ApJ, 373, 465
- Fuller et al. (2016) Fuller L., Lopez-Rodriguez E., Packham C., Ramos-Almeida C., Alonso-Herrero A., Levenson N. A., Radomski J., et al., 2016, MNRAS, 462, 2618
- Gallo (2006) Gallo L. C., 2006, MNRAS, 368, 479
- Gehrels et al. (2004) Gehrels N., Chincarini G., Giommi P., Mason K. O., Nousek J. A., Wells A. A., White N. E., et al., 2004, ApJ, 611, 1005
- Gelbord, Mullaney & Ward (2009) Gelbord J. M., Mullaney J. R., Ward M. J., 2009, MNRAS, 397, 172
- Gierliński et al. (2008) Gierliński M., Middleton M., Ward M., Done C., 2008, Natur, 455, 369
- Goad, Korista & Ruff (2012) Goad M. R., Korista K. T., Ruff A. J., 2012, MNRAS, 426, 3086
- Grier et al. (2017) Grier C. J., Pancoast A., Barth A. J., Fausnaugh M. M., Brewer B. J., Treu T., Peterson B. M., 2017, ApJ, 849, 146
- Grupe et al. (2000) Grupe D., Leighly K. M., Thomas H.-C., Laurent-Muehleisen S. A., 2000, A&A, 356, 11
- Grupe et al. (2010) Grupe D., Komossa S., Leighly K. M., Page K. L., 2010, ApJS, 187, 64
- Hagino et al. (2016) Hagino K., Odaka H., Done C., Tomaru R., Watanabe S., Takahashi T., 2016, MNRAS, 461, 3954
- Hamann et al. (2018) Hamann F., Chartas G., Reeves J., Nardini E., 2018, MNRAS, 476, 943
- Harrison et al. (2013) Harrison F. A., Craig W. W., Christensen F. E., Hailey C. J., Zhang W. W., Boggs S. E., Stern D., et al., 2013, ApJ, 770, 103
- Ho & Kim (2014) Ho L. C., Kim M., 2014, ApJ, 789, 17
- Jansen et al. (2001) Jansen F., Lumb D., Altieri B., Clavel J., Ehle M., Erd C., Gabriel C., et al., 2001, A&A, 365, L1
- Jiang, Stone & Davis (2014) Jiang Y.-F., Stone J. M., Davis S. W., 2014, ApJ, 796, 106
- Jiang, Davis & Stone (2016) Jiang Y.-F., Davis S. W., Stone J. M., 2016, ApJ, 827, 10
- Jin et al. (2012a) Jin C., Ward M., Done C., Gelbord J., 2012, MNRAS, 420, 1825
- Jin, Ward & Done (2012b) Jin C., Ward M., Done C., 2012, MNRAS, 422, 3268
- Jin, Ward & Done (2012c) Jin C., Ward M., Done C., 2012, MNRAS, 425, 907
- Jin et al. (2013) Jin C., Done C., Middleton M., Ward M., 2013, MNRAS, 436, 3173
- Jin, Done & Ward (2016) Jin C., Done C., Ward M., 2016, MNRAS, 455, 691
- Jin, Done & Ward (2017a) Jin C., Done C., Ward M., 2017, MNRAS, 468, 3663
- Jin et al. (2017b) Jin C., Done C., Ward M., Gardner E., 2017, MNRAS, 471, 706
- Jin, Done & Ward (2020) Jin C., Done C., Ward M., 2020, MNRAS, 495, 3538
- Jin, Done & Ward (2021) Jin C., Done C., Ward M., 2021, MNRAS, 500, 2475
- Jin et al. (2022) Jin C., Done C., Ward M., Panessa F., Liu B., Liu H., 2022, MNRAS, 512, 5642
- Kaspi et al. (2000) Kaspi S., Smith P. S., Netzer H., Maoz D., Jannuzi B. T., Giveon U., 2000, ApJ, 533, 631
- Kubota & Done (2018) Kubota A., Done C., 2018, MNRAS, 480, 1247
- Kubota & Done (2019) Kubota A., Done C., 2019, MNRAS, 489, 524
- Kwan & Krolik (1979) Kwan J., Krolik J. H., 1979, ApJL, 233, L91
- Kynoch et al. (2018) Kynoch D., Landt H., Ward M. J., Done C., Gardner E., Boisson C., Arrieta-Lobo M., et al., 2018, MNRAS, 475, 404
- Landt et al. (2019) Landt H., Ward M. J., Kynoch D., Packham C., Ferland G. J., Lawrence A., Pott J.-U., et al., 2019, MNRAS, 489, 1572
- Laor et al. (1997) Laor A., Fiore F., Elvis M., Wilkes B. J., McDowell J. C., 1997, ApJ, 477, 93
- Leighly et al. (2007a) Leighly K. M., Halpern J. P., Jenkins E. B., Grupe D., Choi J., Prescott K. B., 2007, ApJ, 663, 103
- Leighly et al. (2007b) Leighly K. M., Halpern J. P., Jenkins E. B., Casebeer D., 2007, ApJS, 173, 1
- Li et al. (2018) Li Y.-R., Songsheng Y.-Y., Qiu J., Hu C., Du P., Lu K.-X., Huang Y.-K., et al., 2018, ApJ, 869, 137
- Liu et al. (2019) Liu H.-Y., Liu W.-J., Dong X.-B., Zhou H., Wang T., Lu H., Yuan W., 2019, ApJS, 243, 21
- Londish et al. (2004) Londish D., Heidt J., Boyle B. J., Croom S. M., Kedziora-Chudczer L., 2004, MNRAS, 352, 903
- Lu & Yu (2001) Lu Y., Yu Q., 2001, MNRAS, 324, 653
- Luo et al. (2015) Luo B., Brandt W. N., Hall P. B., Wu J., Anderson S. F., Garmire G. P., Gibson R. R., et al., 2015, ApJ, 805, 122
- Lusso et al. (2010) Lusso E., Comastri A., Vignali C., Zamorani G., Brusa M., Gilli R., Iwasawa K., et al., 2010, A&A, 512, A34
- Lusso & Risaliti (2016) Lusso E., Risaliti G., 2016, ApJ, 819, 154
- Magdziarz et al. (1998) Magdziarz P., Blaes O. M., Zdziarski A. A., Johnson W. N., Smith D. A., 1998, MNRAS, 301, 179
- Marinello et al. (2020) Marinello M., Rodríguez-Ardila A., Marziani P., Sigut A., Pradhan A., 2020, MNRAS, 494, 4187
- Martínez-Paredes et al. (2017) Martínez-Paredes M., Aretxaga I., Alonso-Herrero A., González-Martín O., Lopéz-Rodríguez E., Ramos Almeida C., Asensio Ramos A., et al., 2017, MNRAS, 468, 2
- Mathews, Blumenthal & Grandi (1980) Mathews W. G., Blumenthal G. R., Grandi S. A., 1980, ApJ, 235, 971
- Mathur, Kuraszkiewicz & Czerny (2001) Mathur S., Kuraszkiewicz J., Czerny B., 2001, NewA, 6, 321
- Matthews et al. (2020) Matthews J. H., Knigge C., Higginbottom N., Long K. S., Sim S. A., Mangham S. W., Parkinson E. J., et al., 2020, MNRAS, 492, 5540
- McDowell et al. (1995) McDowell J. C., Canizares C., Elvis M., Lawrence A., Markoff S., Mathur S., Wilkes B. J., 1995, ApJ, 450, 585
- McKee (1995) McKee C. F., 1995, ASPC, 80, 292
- Middleton, Uttley & Done (2011) Middleton M., Uttley P., Done C., 2011, MNRAS, 417, 250
- Miller et al. (2007) Miller L., Turner T. J., Reeves J. N., George I. M., Kraemer S. B., Wingert B., 2007, A&A, 463, 131
- Miniutti & Fabian (2004) Miniutti G., Fabian A. C., 2004, MNRAS, 349, 1435
- Miniutti et al. (2012) Miniutti G., Brandt W. N., Schneider D. P., Fabian A. C., Gallo L. C., Boller T., 2012, MNRAS, 425, 1718
- Miniutti et al. (2019) Miniutti G., Saxton R. D., Giustini M., Alexander K. D., Fender R. P., Heywood I., Monageng I., et al., 2019, Natur, 573, 381
- Mizumoto et al. (2021) Mizumoto M., Nomura M., Done C., Ohsuga K., Odaka H., 2021, MNRAS, 503, 1442
- Ni et al. (2018) Ni Q., Brandt W. N., Luo B., Hall P. B., Shen Y., Anderson S. F., Plotkin R. M., et al., 2018, MNRAS, 480, 5184
- Ohsuga & Mineshige (2011) Ohsuga K., Mineshige S., 2011, ApJ, 736, 2
- Osterbrock & Pogge (1985) Osterbrock D. E., Pogge R. W., 1985, ApJ, 297, 166
- Polletta et al. (2007) Polletta M., Tajer M., Maraschi L., Trinchieri G., Lonsdale C. J., Chiappetti L., Andreon S., et al., 2007, ApJ, 663, 81
- Pounds, Done & Osborne (1995) Pounds K. A., Done C., Osborne J. P., 1995, MNRAS, 277, L5
- Rakshit et al. (2017) Rakshit S., Stalin C. S., Chand H., Zhang X.-G., 2017, ApJS, 229, 39
- Parker et al. (2021) Parker M. L., Alston W. N., Härer L., Igo Z., Joyce A., Buisson D. J. K., Chainakun P., et al., 2021, MNRAS, 508, 1798
- Pancoast, Brewer & Treu (2011) Pancoast A., Brewer B. J., Treu T., 2011, ApJ, 730, 139
- Rankine et al. (2020) Rankine A. L., Hewett P. C., Banerji M., Richards G. T., 2020, MNRAS, 492, 4553
- Pancoast et al. (2014) Pancoast A., Brewer B. J., Treu T., Park D., Barth A. J., Bentz M. C., Woo J.-H., 2014, MNRAS, 445, 3073
- Peterson et al. (2004) Peterson B. M., Ferrarese L., Gilbert K. M., Kaspi S., Malkan M. A., Maoz D., Merritt D., et al., 2004, ApJ, 613, 682
- Peterson (2014) Peterson B. M., 2014, SSRv, 183, 253
- Richards et al. (2006) Richards G. T., Lacy M., Storrie-Lombardi L. J., Hall P. B., Gallagher S. C., Hines D. C., Fan X., et al., 2006, ApJS, 166, 470
- Richards et al. (2011) Richards G. T., Kruczek N. E., Gallagher S. C., Hall P. B., Hewett P. C., Leighly K. M., Deo R. P., et al., 2011, AJ, 141, 167
- Plotkin et al. (2010) Plotkin R. M., Anderson S. F., Brandt W. N., Diamond-Stanic A. M., Fan X., MacLeod C. L., Schneider D. P., et al., 2010, ApJ, 721, 562
- Ponti et al. (2012) Ponti G., Papadakis I., Bianchi S., Guainazzi M., Matt G., Uttley P., Bonilla N. F., 2012, A&A, 542, A83
- Poutanen et al. (2007) Poutanen J., Lipunova G., Fabrika S., Butkevich A. G., Abolmasov P., 2007, MNRAS, 377, 1187
- Pu et al. (2020) Pu X., Luo B., Brandt W. N., Timlin J. D., Liu H., Ni Q., Wu J., 2020, ApJ, 900, 141
- Reeves et al. (2000) Reeves J. N., O’Brien P. T., Vaughan S., Law-Green D., Ward M., Simpson C., Pounds K. A., et al., 2000, MNRAS, 312, L17
- Reeves et al. (2020) Reeves J. N., Braito V., Chartas G., Hamann F., Laha S., Nardini E., 2020, ApJ, 895, 37
- Ross & Fabian (2005) Ross R. R., Fabian A. C., 2005, MNRAS, 358, 211
- Schlafly & Finkbeiner (2011) Schlafly E. F., Finkbeiner D. P., 2011, ApJ, 737, 103
- Schlegel, Finkbeiner & Davis (1998) Schlegel D. J., Finkbeiner D. P., Davis M., 1998, ApJ, 500, 525
- Shakura & Sunyaev (1973) Shakura N. I., Sunyaev R. A., 1973, A&A, 500, 33
- Silva, Maiolino & Granato (2004) Silva L., Maiolino R., Granato G. L., 2004, MNRAS, 355, 973
- Simpson et al. (1999) Simpson C., Ward M., O’Brien P., Reeves J., 1999, MNRAS, 303, L23
- Sądowski et al. (2011) Sądowski A., Abramowicz M., Bursa M., Kluźniak W., Lasota J.-P., Różańska A., 2011, A&A, 527, A17
- Shemmer & Netzer (2002) Shemmer O., Netzer H., 2002, ApJL, 567, L19
- Shen et al. (2011) Shen Y., Richards G. T., Strauss M. A., Hall P. B., Schneider D. P., Snedden S., Bizyaev D., et al., 2011, ApJS, 194, 45
- Shen & Ho (2014) Shen Y., Ho L. C., 2014, Natur, 513, 210
- Takeuchi, Ohsuga & Mineshige (2014) Takeuchi S., Ohsuga K., Mineshige S., 2014, PASJ, 66, 48
- Tatum et al. (2012) Tatum M. M., Turner T. J., Sim S. A., Miller L., Reeves J. N., Patrick A. R., Long K. S., 2012, ApJ, 752, 94
- Turner et al. (2007) Turner T. J., Miller L., Reeves J. N., Kraemer S. B., 2007, A&A, 475, 121
- Verner et al. (1996) Verner D. A., Ferland G. J., Korista K. T., Yakovlev D. G., 1996, ApJ, 465, 487
- Véron-Cetty, Joly & Véron (2004) Véron-Cetty M.-P., Joly M., Véron P., 2004, A&A, 417, 515
- Vestergaard & Peterson (2006) Vestergaard M., Peterson B. M., 2006, ApJ, 641, 689
- Vignali et al. (2000) Vignali C., Comastri A., Nicastro F., Matt G., Fiore F., Palumbo G. G. C., 2000, A&A, 362, 69
- Voges et al. (1999) Voges W., Aschenbach B., Boller T., Bräuninger H., Briel U., Burkert W., Dennerl K., et al., 1999, A&A, 349, 389
- Wang & Netzer (2003) Wang J.-M., Netzer H., 2003, A&A, 398, 927
- Watarai et al. (2000) Watarai K.-. ya ., Fukue J., Takeuchi M., Mineshige S., 2000, PASJ, 52, 133
- Wilkins et al. (2014) Wilkins D. R., Kara E., Fabian A. C., Gallo L. C., 2014, MNRAS, 443, 2746
- Willingale et al. (2013) Willingale R., Starling R. L. C., Beardmore A. P., Tanvir N. R., O’Brien P. T., 2013, MNRAS, 431, 394
- Wilms, Allen & McCray (2000) Wilms J., Allen A., McCray R., 2000, ApJ, 542, 914
- Wolfire et al. (2003) Wolfire M. G., McKee C. F., Hollenbach D., Tielens A. G. G. M., 2003, ApJ, 587, 278
- Woo et al. (2015) Woo J.-H., Yoon Y., Park S., Park D., Kim S. C., 2015, ApJ, 801, 38
- Wu et al. (2011) Wu J., Brandt W. N., Hall P. B., Gibson R. R., Richards G. T., Schneider D. P., Shemmer O., et al., 2011, ApJ, 736, 28
- Wu et al. (2012) Wu J., Brandt W. N., Anderson S. F., Diamond-Stanic A. M., Hall P. B., Plotkin R. M., Schneider D. P., et al., 2012, ApJ, 747, 10
- Yang et al. (2021) Yang J., Paragi Z., Nardini E., Baan W. A., Fan L., Mohan P., Varenius E., et al., 2021, MNRAS, 500, 2620
- York et al. (2000) York D. G., Adelman J., Anderson J. E., Anderson S. F., Annis J., Bahcall N. A., Bakken J. A., et al., 2000, AJ, 120, 1579
- Zhou et al. (2006) Zhou H., Wang T., Yuan W., Lu H., Dong X., Wang J., Lu Y., 2006, ApJS, 166, 128
- Zhou et al. (2010) Zhou X.-L., Zhang S.-N., Wang D.-X., Zhu L., 2010, ApJ, 710, 16
- Zhu, Zhang & Tang (2009) Zhu L., Zhang S. N., Tang S., 2009, ApJ, 700, 1173
Appendix A Optical/UV Spectral Analysis
A.1 Optical Spectral Analysis
The optical spectrum of RX J0134.2-4258 resembles a typical NLS1 galaxy. In order to determine the parameters of various emission lines and continuum, we perform a detailed fitting to the optical spectrum. Firstly, the spectrum is corrected for the Galactic dust reddening with (Schlafly & Finkbeiner 2011) and the extinction model in Fitzpatrick & Massa (2007). Then the wavelength and flux are de-redshifted to AGN’s rest frame with . Then we adopt the prescription described in Dong et al. (2008) to fit the spectrum.
The model of Dong et al. (2008) comprises a power law with a slope of -2.5 for the underlying continuum, and an Fe ii template from Véron-Cetty, Joly & Véron (2004). Since no stellar absorption features can be identified in the spectrum, star lights from host galaxy should not affect our emission line fitting, and so we do not include a host galaxy component. This is also confirmed by the extremely weak host galaxy component in the best-fit SED model in Figure 2. All the narrow emission lines are fitted with Gaussian profiles of the same shape. [O iii]5007 is fitted with two Gaussian profiles, one for the central component, and the other for the blue-shifted component. The intensity ratios of emission line doublets such as [O iii]4959/5007 and [N ii]6550/6585 are fixed at their theoretical values. For the broad Balmer lines, we first try Lorentzian profiles to fit the broad component (Zhou et al. 2006; Goad, Korista & Ruff 2012; Rakshit et al. 2017). The velocity shifts and line widths of H and H are kept the same, but their fluxes are left as free parameters. This model configuration assumes that different line components can have different Balmer decrements, which is possible because different emission line regions may have different electron densities and ionization states (e.g. Kwan & Krolik 1979; Mathews, Blumenthal & Grandi 1980; Jin et al. 2012a; Jin, Ward & Done 2012b).
Figure 8 shows the fitting results for the entire optical spectrum. All the line parameters are listed in Table 6. We can see that Balmer lines (e.g. H, H) are well fitted by this Lorentzian decomposition. The FWHM of the broad component is 1140 20 km s-1, which is consistent with the value reported by Grupe et al. (2010). The rest-frame equivalent width (REW) of the narrow component (NC) of H is only 0.1 0.5 Å, and its Balmer decrement is 28. In comparison, the Balmer decrement of the broad component (BC) is 2.76 0.16, which is a typical value of AGN’s broad line region (BLR, e.g. Shen et al. 2011; Jin, Ward & Done 2012b; Shen & Ho 2014). A possible explanation is that at least part of the NC flux is from a region in the host galaxy where the dust extinction is severe, thus it contributes a lot more NC flux in H than H. One way to test this is to check other hydrogen lines such as Pa in the near infrared, but no spectral data is available in this band.
However, it is also possible that the large Balmer decrement of NC is a consequence of line decomposition, which is often ambiguous. As a further test, we follow the procedure of Liu et al. (2019) to fit the Balmer lines by replacing the BC Lorentzian profile with two broad Gaussian profiles, i.e. an intermediate component (IC) and a BC (e.g. Zhu, Zhang & Tang 2009; Jin et al. 2012a). As shown in Figure 9, this model can also provide good fits to the Balmer lines. The FWHMs of NC, IC and BC are found to be 300 20, 1140 70 and 3520 170 km s-1, respectively. The Balmer decrement is 5.7 1.8, 2.9 0.4 and 2.1 0.3 for the three components. Thus NC also appears heavily reddened. In this case, the ratio of H NC/[Oiii]5007 is 0.6 0.4, which is much larger than 0.06 0.11 as found in the Lorentzian fit and in most AGN (e.g. Shen & Ho 2014). Hence it is possible that the NC flux is overestimated in this line decomposition, and so we slightly prefer the Lorentzian method. The FWHM of H after subtracting the NC is 1410 70 km s-1, which is slightly broader than in the Lorentzian decomposition. Therefore, there is indeed some ambiguity in the width of Balmer lines caused by different line decomposition methods.
Our spectral fits also confirm the existence of strong Fe ii emission, the REW of which is Å within 4434 – 4684 Å. The flux ratio between the Fe ii line in 4434 – 4684 Å and the broad H line is . After removing Feii lines, [Oiii]5007 is found to be extremely weak, with the total REW being only 2.7 0.8 Å.
A.2 UV Spectral Analysis
A special property of RX J0134.2-4258 is its weak and strongly blue-shifted UV emission lines. We perform local spectral fitting to individual UV lines, such as the Mg ii 2797/2803, C iv 1548/1551, N v 1238/1243 doublets. The fits are plotted in Figure 10, and the line parameters are listed in Table 7.
The Mg ii 2797/2803 doublet can be well fitted with two Lorentzian components of the same shape and flux, as shown in Figure 10a. The velocity shift is found to be -380 90 km s-1, indicating that the line is slightly blue-shifted. The FWHM is found to be 1170 240 km s-1, which is similar to the width of H.
The C iv line is much more blue-shifted and extended. It contains two adjacent lines at 1548 and 1551 Å. Each of the two lines are fitted with two Gaussian components, including a narrow core component and a broad and blue-shifted wing component. As shown in Figure 10b, this model can fit the line very well. The core component has a FWHM of 3250 320 km s-1, much broader than the BC of H, and its velocity shift is -1780 70 km s-1. The wing component has a velocity shift of -5160 660 km s-1 and a much larger FWHM of 7800 800 km s-1. These two components have a total REW of 3.8 1.5 Å. The total REW of the C iv doublet is much smaller than that measured from the major AGN population (e.g. 30 Å in the quasars’ composite spectrum: Luo et al. 2015; Coatman et al. 2016). The weak and blue-shifted C iv doublet resembles WLQs.
The Si iv 1393/1402 doublet has a different shape from C iv. The velocity shift of the core component is -710 230 km s-1, and its FWHM is 860 320 km s-1. The broad component is shifted by -1890 20 km s-1, with a FWHM of 3660 40 km s-1. Therefore, the line width and velocity shift of Si iv are less extreme than C iv. This is consistent with the fact that the ionization energy of Si iv is lower, and so its emission region may have a larger radius, where the radiation pressure is weaker and the outflow speed is smaller.
The N v 1238/1243 doublet contains two broad lines. These two lines are often heavily blended with the broad Ly line at 1216 Å, making them difficult to decompose. We assume that N v has the same line profile as C iv, and then fit only the red side of the line hump within 1230 – 1250 Å. As shown in Figure 10d, the result indicates that the line blend within 1150 – 1250 Å mostly come from the strong N v 1238/1243 doublet. The flux ratio of N v/C iv is 2.2 0.4 , which is larger than the typical AGN value of less than unity (e.g. Shemmer & Netzer 2002). This suggests that either the outflow in RX J0134.2-4258 is more metal rich, or the flux of N v in the line blend is over-estimated. Unfortunately, the spectral quality of this waveband is not good enough for a more accurate decomposition of Ly and N v.

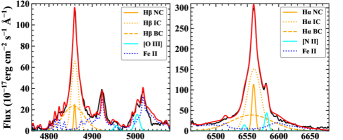

| Component | Parameter | Value | Unit |
|---|---|---|---|
| H | |||
| Narrow Gauss | -260 20 | km s-1 | |
| FWHM | 280 50 | km s-1 | |
| Flux | 560 160 | erg cm-2 s-1 | |
| REW | 8.6 2.5 | Å | |
| Broad Lorentz | -250 10 | km s-1 | |
| FWHM | 1140 20 | km s-1 | |
| Flux | 8540 240 | erg cm-2 s-1 | |
| REW | 131.3 3.6 | Å | |
| H | |||
| Narrow Gauss | -260 tied | km s-1 | |
| FWHM | 280 tied | km s-1 | |
| Flux | 20 70 | erg cm-2 s-1 | |
| REW | 0.1 0.5 | Å | |
| Broad Lorentz | -250 tied | km s-1 | |
| FWHM | 1140 tied | km s-1 | |
| Flux | 3090 160 | erg cm-2 s-1 | |
| REW | 24.7 1.2 | Å | |
| O iii5007 | |||
| Core Gauss | -260 tied | km s-1 | |
| FWHM | 280 tied | km s-1 | |
| Flux | 40 40 | erg cm-2 s-1 | |
| REW | 0.3 0.3 | Å | |
| Wing Gauss | -310 290 | km s-1 | |
| FWHM | 770 270 | km s-1 | |
| Flux | 290 90 | erg cm-2 s-1 | |
| REW | 2.4 0.7 | Å | |
| Component | Parameter | Value | Unit |
|---|---|---|---|
| Mg ii 2797 | |||
| Single Lorentz | -380 90 | km s-1 | |
| FWHM | 1170 240 | km s-1 | |
| Flux | 2480 610 | erg cm-2 s-1 | |
| REW | 6.1 1.5 | Å | |
| C iv 1548 | |||
| Core Gauss | -1780 70 | km s-1 | |
| FWHM | 3250 320 | km s-1 | |
| Flux | 1800 350 | erg cm-2 s-1 | |
| REW | 1.7 0.9 | Å | |
| Wing Gauss | -5160 660 | km s-1 | |
| FWHM | 7800 800 | km s-1 | |
| Flux | 2280 400 | erg cm-2 s-1 | |
| REW | 2.1 1.2 | Å | |
| Si iv 1393 | |||
| Core Gauss | -710 230 | km s-1 | |
| FWHM | 860 320 | km s-1 | |
| Flux | 530 300 | erg cm-2 s-1 | |
| REW | 0.5 0.2 | Å | |
| Wing Gauss | -1890 20 | km s-1 | |
| FWHM | 3660 40 | km s-1 | |
| Flux | 4360 530 | erg cm-2 s-1 | |
| REW | 3.7 1.2 | Å | |