The first galaxy cluster discovered by the VISTA Variables in the Vía Láctea Survey
Abstract
We report the first confirmed detection of the galaxy cluster VVV-J144321-611754 at very low latitudes (l = 315.836∘, b = -1.650∘) located in the tile d015 of the VISTA Variables in the Vía Láctea (VVV) survey. We defined the region of 30 30 centered in the brightest galaxy finding 25 galaxies. For these objects, extinction-corrected median colors of (H - Ks) = 0.34 0.05 mag, (J - H) = 0.57 0.08 mag and (J - Ks) = 0.87 0.06 mag, and R1/2 = 1.59 0.16 ; C = 3.01 0.08; and Sersic index, n = 4.63 0.39 were estimated. They were visually confirmed showing characteristics of early-type galaxies in the near-IR images. An automatic clustering analysis performed in the whole tile found that the concentration of galaxies VVV-J144321-611754 is a real, compact concentration of early-type galaxies. Assuming a typical galaxy cluster with low X-ray luminosity, the photometric redshift of the brightest galaxy is 0.196 0.025. Follow-up near-IR spectroscopy with FLAMINGOS-2 at the Gemini-South telescope revealed that the two brighter cluster galaxies have typical spectra of early-type galaxies and the estimated redshift for the brightest galaxy VVV-J144321.06-611753.9 is 0.2340.022 and for VVV-J144319.02-611746.1 is 0.2320.019. Finally, these galaxies clearly follow the cluster Red Sequence in the rest-frame near-IR color–magnitude diagram with the slope similar to galaxy cluster at redshift of 0.2. These results are consistent with the presence of a bona fide galaxy cluster beyond the Milky Way disk.
1 Introduction
Extragalactic sources and large-scale structure behind the Milky Way (MW) are obscured by dust and stellar crowding. The light of these sources is dimmed more than 25% in the optical and 10% in the near-infrared wavelengths (Henning et al. 1998). This effect is far larger close to the MW mid-plane because the dust is concentrated there.
Several efforts have been made to study the distribution of galaxies behind the MW. Kraan-Korteweg & Lahav (2000) have reviewed the search of galaxies in the Zone of Avoidance (ZoA, |b| ) using optical, near-IR, far IR, radio and X-ray wavelengths. In the near-IR, the 2MASS Redshift Survey (Huchra et al. 2012) 97.6% complete to the limiting magnitude of Ks = 11.75 mag was used to generate the catalog of groups of galaxies (Tully 2015) in the ZoA. At radio wavelengths, we can mention the Arecibo L-band Feed Array ZoA survey (McIntyre et al. 2015) and the blind 21cm HI-line imaging survey on the Perseus-Pisces Supercluster filament crossing the ZoA (Ramatsoku et al. 2016). The results are complementary, near-IR selection favors the detection of early-type galaxies and blind HI surveys favor the detection of late-type galaxies typically.
However, rich galaxy clusters are traced by X-ray emmisions of the diffuse gas present in the systems. A search for clusters of galaxies in the ZoA was carried out by by Ebeling, Mullis & Tully (2002) using the ROSAT All Sky Survey Bright Source Catalog (Ebeling et al. 1996; Voges et al. 1999). There are only 13 galaxy clusters with measured redshifts in the literature at lower galactic latitudes (|b|): 1 cluster detected from XMM-Newton observations (Nevalainen et al. 2001); 2 clusters from the Clusters in the Zone of Avoidance project (Ebeling, Mullis & Tully 2002); 1 from the meta-catalogue of X-ray detected clusters of galaxies (Piffaretti et al. 2011); and 9 from the Planck catalogue of Sunyaev-Zeldovich sources (Ma, Hinshaw & Scott 2013).
The VISTA Variables in the Vía Láctea (Minniti et al. 2010, hereafter VVV) is a public ESO photometric variability survey aimed mainly to study the stellar populations of the MW bulge (-10 ∘ +10∘ and -10∘+5∘) and MW disk (-65∘ -10∘ and -2∘ +2∘) in Z, Y, J, H and Ks near-IR passbands. This survey has yielded the detection of new globular clusters (Minniti et al. 2011, 2017); new stellar open clusters (Borissova et al. 2011; Borissova et al. 2014; Barbá et al. 2015); the discovery of brown dwarfs (Beamin et al. 2013) and other classes of variable stars. Moreover, data from the VVV survey have also been used for extragalactic studies. Amôres et al. (2012) reported 204 candidate galaxies behind the Galactic disk, in the direction of the Carina’s spiral arm ( 285∘ to 290∘) based on visual inspection. Coldwell et al. (2014) used near-IR photometry to confirm the existence of the previously X-ray detected galaxy cluster Suzaku J1759-3450 (Mori et al. 2013). Coldwell et al. (2014) found 15 galaxies within a projected distance of 350 kpc from the central X-ray peak emission at a redshift of 0.13. More recently, Baravalle et al. (2018) presented a method to search and characterize extragalactic sources detected from VVV image data. They derived photometric and morphological parameters of the sources by combining SExtractor+PSFEx.
In this study, we use our photometric procedure to search for extragalactic sources and present the analysis for a galaxy cluster candidate found in the VVV tile d015.
VVV-J144321.06-611753.9 is the first confirmed galaxy cluster selected originally through VVV photometry.
This paper is organized as follows: In section 2, we describe the near-IR data and selection criteria, both for the VVV photometry and for the FLAMINGOS-2 spectroscopic data obtained at Gemini South. In section 3, we present the cluster detection and analysis from four different methods, all used to confirm that VVV-J144321.06-611753.9 is a bona fide galaxy cluster. The methods are (1) Automatic clustering analysis; (2) Spectral energy distribution modeling; (3) Spectroscopic redshift measurements; and (4) the Cluster Red Sequence. In section 4, we present a summary of the data analysis and main results.
Throughout the paper, we use the following cosmological parameters:
H0 = 70.4 kms-1 Mpc-1,
= 0.272, and = 0.728 (Komatsu et al. 2011).
2 The data
A concentration of extended objects was detected serendipitously in the search for new stellar cluster candidates in the VVV survey (Barbá et al. 2015). VVV-J144321.06-611753.9 was found in the d015 MW disk tile centered at J2000 , (l = 315.836∘, b = -1.650∘), which corresponds to the brightest object coordinates.
2.1 VVV Near-IR photometry
In order to detect and characterize the extragalactic sources in the tile d015, we applied the photometric methodology developed in Baravalle et al. (2018), which uses the combination of and . The sources were selected using the stellar index CLASS_STAR, the SPREAD_MODEL () parameter, the radius that contains 50% of the total flux of an object (R1/2), the concentration index (C) and the near-IR colors. The adopted criteria consider: ; 1.0 R; 2.1 C 5; and ; and the colors 0.5 (J - Ks) 2.0 mag; 0.0 (J - H) 1.0 mag; and 0.0 (H - Ks) 2.0 mag with the color restriction (J - H) + 0.9 (H - Ks) 0.44 mag to minimize false detections. Also, the sources with Z and Y detections should satisfy -0.3 (Y - J) 1.0 mag and -0.3 (Z - Y) 1.0 mag.
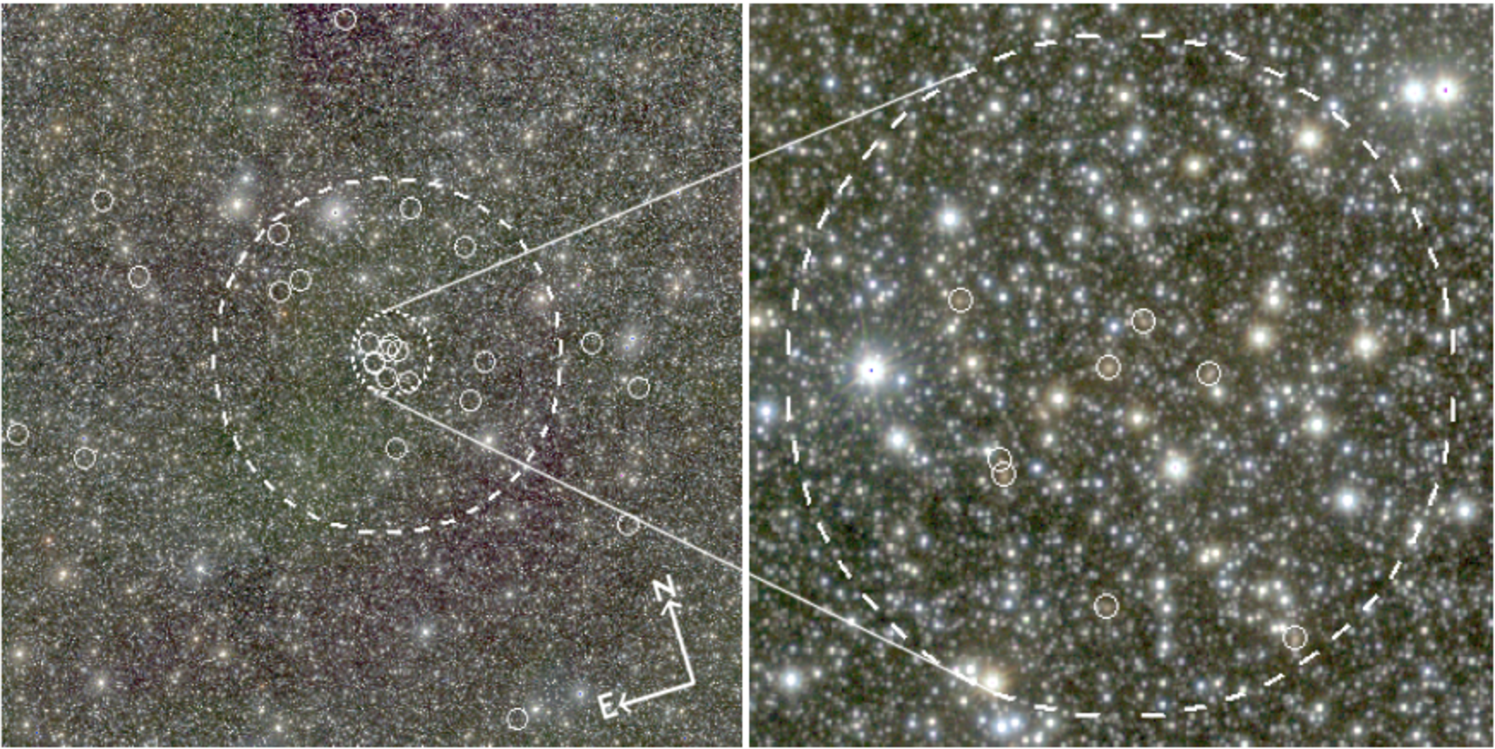
Following these criteria, we detected 933 extragalactic sources in the d015 VVV MW disk tile with 24 located in the region of 30 30 centered at VVV-J144321.05-611753.9. Three objects were discarded because they are low surface brightness sources with strong strong stellar contamination that could not be effectively corrected. The objects VVV-J144243.0-611529.8, VVV-J144331.6-612133.1 and VVV-J144426.4-611101.3 have contamination by nearby stars and they were corrected using the procedure described in Baravalle et al. (2018). Additionally, four sources that satisfied the above criteria but had slightly smaller R1/2 than 1 arcsec, R1/2, between 0.78 and 0.95 ), were also included after a visual inspection. Our final sample consists of 25 extragalactic sources, all of them visually confirmed to be galaxies. They were all detected in the J, H and Ks passbands and only four sources were also detected in the Z and Y VVV passbands. Figure 1 shows a cutout made from a composite (J, H and Ks) color image of the field showing the concentration of galaxies, centered at the brightest galaxy (VVV-J144321.05-611753.9). The 25 galaxies of the concentration are marked by small circles. The left panel corresponds to a 3030 box identifying with dashed lines, two circles with diameters of 3 and 7 . The right panel shows the 33 central parts of the cluster candidate.
Table 1 shows the photometric properties of the 25 galaxies. Column (1) gives the VVV identification; columns (2) and (3), RA and Dec in J2000 coordinates; columns (4) to (8) show the PSF Z, Y, J, H and Ks magnitudes; columns (9) to (13) show the aperture magnitudes within a 2 diameter, respectively; finally, columns (14) to (17) list the morphological parameters based on Ks-band photometry: the half-light radius; concentration index; the ellipticity; and the Sersic index. The PSF magnitudes are estimates of the total Ks magnitudes and they range between 13.70 and 16.00 mag. All magnitudes were corrected for galactic extinction using the maps of Schlafly & Finkbeiner (2011) and the relative extinctions of Catelan et al. (2011). The completeness was estimated for the tiles d010 and d115 in Baravalle et al. (2018, Figure 3) showing that 80 percent completeness is reached for sources fainter than 17 to 17.5 Ks magnitudes. We are reaching these magnitude limits in the tile d015, with a median Ks extinction value AKs = 0.73 0.01 mag. In the studied region of 3030 , the extinction was not constant with median AKs = 1.07 0.04 mag: 1.13 0.05 mag in the central parts (radius smaller than 1.5 ); 1.12 0.07 mag for radius between 1.5 to 3.5 ; and 0.93 0.09 mag in the most external parts.
The galaxies in the concentration are clearly small and red when compared against those in the whole tile. Extinction corrected median values of the photometric properties are: PSF magnitudes, J = 15.50 0.13 mag; H = 15.09 0.14 mag; and Ks = 14.64 0.14 mag and colors, (H - Ks) = 0.34 0.05 mag; (J - H) = 0.57 0.08 mag; and (J - Ks) = 0.87 0.06 mag. The median morphological parameters are: R1/2 = 1.59 0.16 ; C = 3.01 0.08; = 0.30 0.03 and Sersic index, n = 4.63 0.39.
2.2 FLAMINGOS-2 IR spectroscopy
We obtained follow-up spectroscopic data using the near-infrared imaging spectrograph, FLAMINGOS-2 at Gemini South, in the Fast Turnaround (Program ID: GS-2016A-FT-18) observing mode. The observations were made during the nights of July 30 and August 02 of 2016. We collected long-slit spectra with the JH/HK grism and 0.72 arcsec slit. This resulted in a peak resolution R600, a dispersion of 6.55 Å/pix and a total spectral coverage from 0.98 to 1.80 m. The projected on-sky slit length was 4.48 . We observed the 8 brightest galaxies in the central part of the concentration. We set each pointing to include two objects per slit, constraining the angular separation between each galaxy pair to be lower than 3 . In addition, we optimized the slit position angle configuration or slit rotation to avoid bright stars for each setup. The objects have Ks magnitudes between 13.7 to 14.8 mag and the exposure time was 8 120s to reach a signal-to-noise ratio for each combined galaxy spectrum. Calibration frames were acquired together with telluric standard star spectra to remove telluric absorption features from the science data.
The spectra were reduced using the IRAF/Gemini tasks and the Gemini FLAMINGOS-2 PyRAF data reduction package. We performed the basic data reduction and combination of the 2-dimensional data with nsreduce and nscombine routines, respectively. The arc-line identification and wavelength calibration steps were carried out with the nsfitcoords and nstransform routines, respectively. After obtaining the two-dimensional spectra, the one-dimensional spectra were extracted via the nsextract routine, to then be telluric-corrected following the Maiolino et al. (1996) procedure. Finally, the spectra were also flux calibrated using the photometric data available for the telluric standard star observed.
3 Cluster Detection and Analysis
In this section we present the photometric and spectroscopic results of the galaxy concentration VVV-J144321-611754. We performed an automatic clustering analysis in the tile d015 and we obtained a photometric redshift estimate through the analysis of the spectral energy distribution. We determined the spectroscopic redshifts for the brightest objects and, finally, the cluster Red Sequence.
3.1 Automatic clustering analysis
We performed an automatic clustering analysis in order to gain insight about the nature of the galaxy clustering. This analysis aims to split the data into sets of associated objects with a joint conditional probability distribution. In our case, a mixture of simple Gaussian densities would separate the data into different groups by varying the number of free parameters, such as the number and shape of the Gaussians. The best model was obtained using the Bayesian Information Criteria, which penalizes those models with high number of free parameters.
We used the public code Mclust (Scrucca et al. 2016) in the catalog of extragalactic sources found in the tile d015, applying the mixture of Gaussians to the sky coordinates, Right Ascension and Declination. In order to use galaxies with higher probability of belonging to a galaxy cluster, they should satisfy that: R 3 ; n 2; and Ks magnitudes fainter than 15.7 mag. We found that the best model has 4 spherically symmetric Gaussians associated to 4 groups with different circular angular areas. The group 1 identified with the concentration of galaxies VVV-J144321-611754 has the smallest angular radius of the sample, 0.138 degrees, whereas the other three groups have angular radii greater than 0.230 degrees. Galaxies within this radius have a higher probability of belonging to the group. Figure 2 shows the distribution of the extragalactic sources of the tile d015 in galactic coordinates. The 25 galaxies of VVV-J144321-611754 are represented by small dots; the objects identified with the groups 1 to 4, with open squares, circles, crosses and triangles, respectively. The group angular sizes are shown in Figure 2. We also took into account some photometric properties of the extragalactic sources, such as the extinction corrected colors, C and n to characterize the groups. The median values for group 1 that contains the concentration of galaxies are (J - Ks) = 0.84 0.05 mag; (H - Ks) = 0.30 0.04 mag; R1/2 = 1.27 0.09 ; C = 3.01 0.06; = 0.301 0.03; n = 4.3 0.3. The other three groups include bluer galaxies with C and n higher than 3.03 and 4.75, respectively. Group 1 is formed with 24 extragalactic objects that were visually inspected; some of them are fainter galaxies with nearby bright stars or located at the outer parts with lower group probability. This result suggests that the VVV-J144321-611754 is a real concentration of galaxies formed by early-type objects.
3.2 Modeling the Spectral energy distribution
EzGal (Mancone & Gonzalez 2012) is a tool to model the evolution of the spectral energy distribution (SED) of a stellar population that gives some derived properties such as the magnitude evolution as a function of redshift for different passbands. This tool uses different stellar population synthesis (SPS) models including Bruzual & Charlot (2003), the Maraston model (Maraston 2005), the BaSTI model (Percival et al. 2009), and the Flexible Stellar Population Synthesis (FSPS, Conroy, Gunn & White 2009). The Bruzual & Charlot (2003) model is the most commonly used, which computes the spectral evolution of stellar populations for different ages and a wide range of metallicities. The Maraston model includes a detailed treatment of thermally pulsating asymptotic giant branch stars that dominate the infrared light of a young stellar population. The BaSTI models include a wide range of metallicities for both solar-scaled and -enhanced metallicities. The FSPS models are unique in dealing with important SPS inputs, such as, the initial mass function (IMF) or stellar evolution phases, treating them as free parameters, allowing the uncertainties introduced by various SPS inputs to be quantitatively measured.
The Ks model magnitudes were obtained using EzGal for Bruzual & Charlot (2003) models assuming a formation redshift of z = 3; the Chabrier initial mass function; a solar metallicity; and a simple stellar population at different redshifts. We used a standard normalization of Ks absolute magnitude of -25.51 0.09 (Brough et al. 2002) for redshifts higher than 0.1 assuming the cluster X-ray luminosity LX(0.3 3.5 keV) 1.9 1044 erg s-1. In the evolution of Ks magnitudes, the brightest galaxy in the concentration has an observed Ks magnitude of 13.77 mag, which corresponds to a photometric redshift of 0.196 0.025. This value is also in agreement with the Stott et al. (2009) estimate based on the Ks magnitude and color of the brightest cluster galaxy. Therefore, all these results indicate that the photometric redshift of the galaxy concentration VVV-J144321-611754 is 0.196 0.025.
3.3 Spectroscopic redshifts
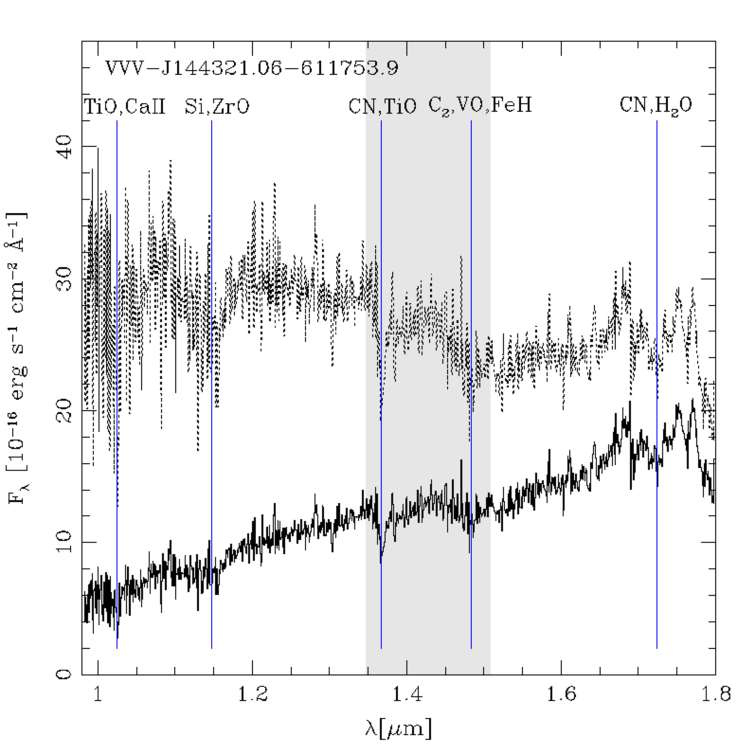
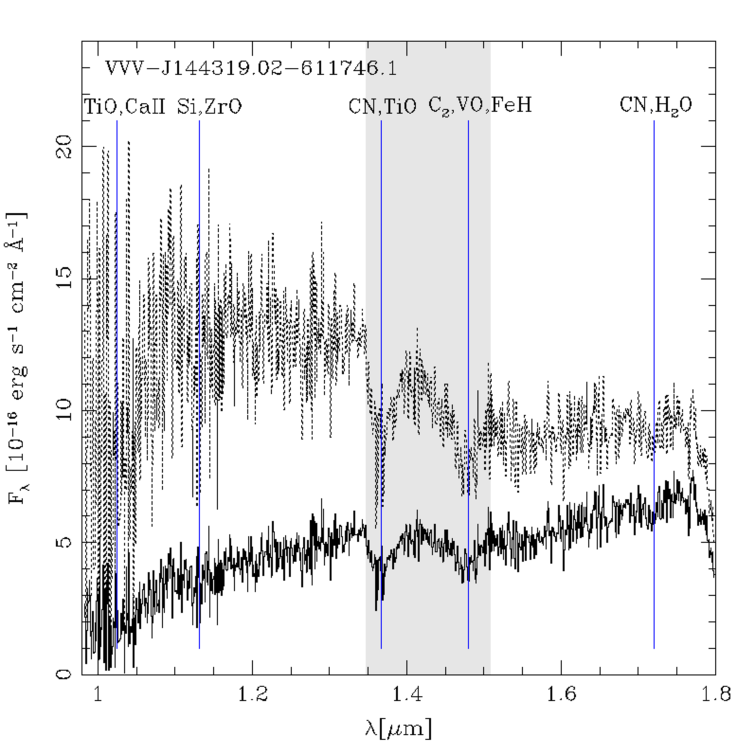
The brighter galaxies VVV-J144321.06-611753.9 and VVV-J144319.02-611746.1 were observed in a single pointing. The spectra were flux calibrated and then normalized to the photometry aperture fluxes, in order to be able to perform the dust reddening correction. The final spectra had 9.5 enough to obtain a precise redshift estimation. Figure 3 shows the spectra of the two galaxies. The solid lines represent the observed spectra with the continuum highly affected by the MW disk dust extinction, making the identification of the spectral features difficult. The dotted lines represent the spectra corrected for absorption of Galactic dust. The spectra were corrected by a simple model of dust reddening extinction in order to retrieve an hypothetical spectrum free of dust. We identified several molecular bands and absorption lines, such as the TiO 0.85 m and ZrO 0.93 m molecular bands overlapped with the CaII and Si absorption lines, respectively. Similarly, the CN and TiO bands at 1.1 m were identified, in addition to the blend of C2, VO and FeH bands at 1.2 m. Finally, we recognized the slump of CN and H2O 1.4 m bands. All these features, marked by vertical lines in the figure, are typical of old stellar populations (Rayner et al. 2009; Mason et al. 2015). The telluric absorption is shown as a shaded region. The estimated redshift for VVV-J144321.06-611753.9 is 0.2340.022 and for VVV-J144319.02-611746.1 is 0.2320.019. The relative large uncertainties in these estimates are mainly related to the use of molecular bands. It was impossible to obtain redshifts for the fainter galaxies in the other pointings due to the lower of the spectra.
For the two brightest galaxies, the spectra include features typical of early-type galaxies. Also, the good agreement between the two redshifts indicates that both galaxies likely belong to the same galaxy cluster. Also, for the brightest galaxy, the difference between the photometric and spectroscopic redshift estimates is about 0.044, and smaller than the uncertainties. We use this spectroscopic redshift as a cluster redshift estimate.
3.4 The Cluster Red Sequence
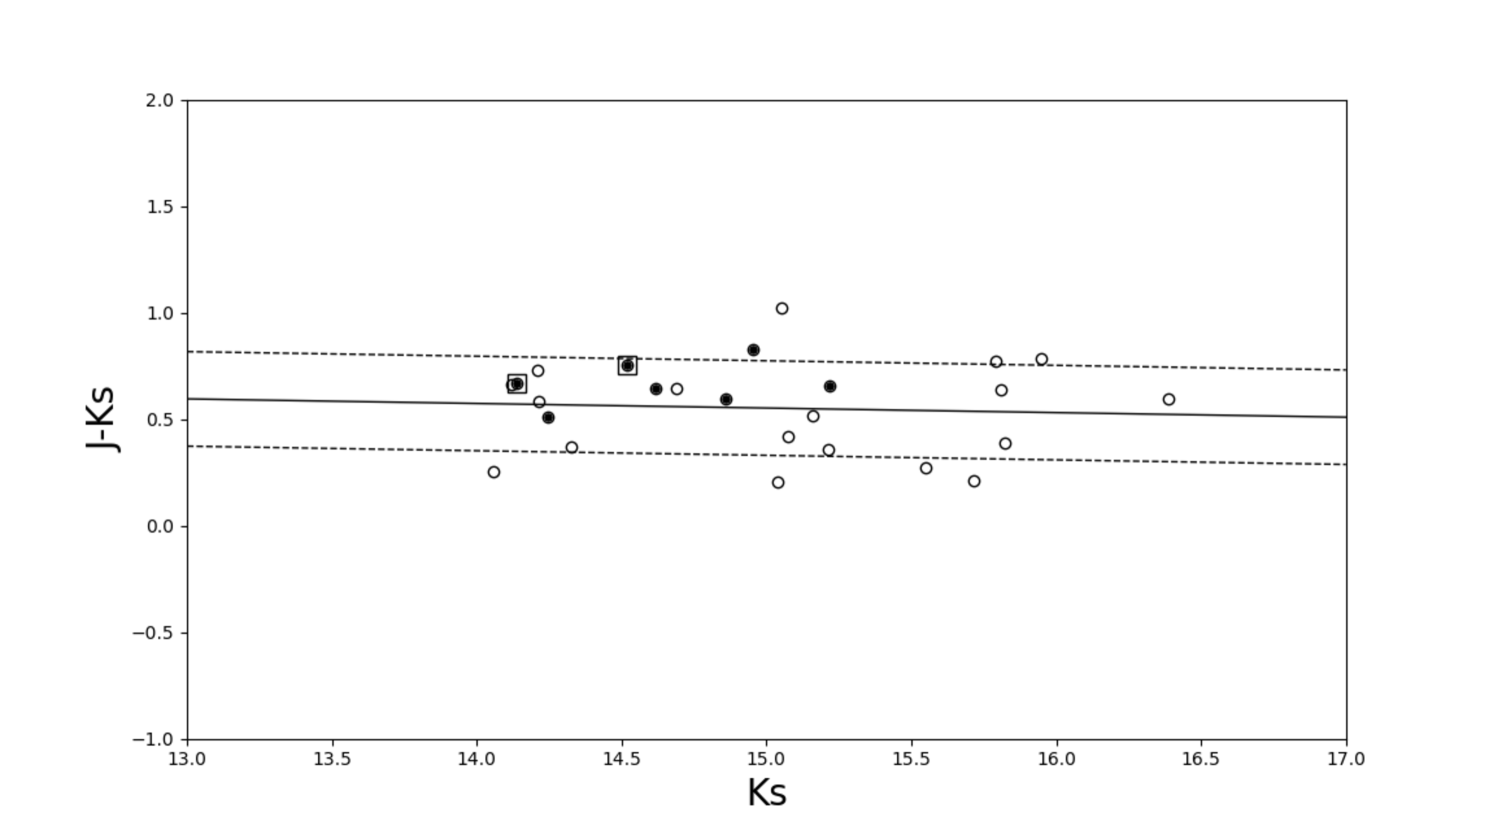
In galaxy clusters, the early-type galaxies follow a tight relation in the Color-Magnitude Diagrams called the Red Sequence (Yee, Gladders & López-Cruz 1999, hereafter RS). We applied the K-corrections to the Ks-band fluxes for the changes of the effective rest- frame wavelengths. We adopted the approximation to the computed observed colors of the 2MASS filters in the Vega system. Following the algorithm by Chilingarian et al. (2010), we used our estimated spectroscopic redshift of the galaxy concentration and the observed (J - Ks) color.
Figure 4 shows the rest-frame near-IR (J - Ks) color – Ks magnitude diagram of the 25 galaxies in the 3030 region. The objects with photometric data are represented by open circles; spectroscopic data by filled circles; and the two objects with estimated redshifts are represented by open squares. The cluster RS shows substantial scatter that might be related to the higher Ks extinction values observed in the central parts of the cluster as compared to outer regions (Section 2.1). The best RS fit relation (J - Ks) = -0.02 0.01 Ks + 0.87 0.05 was obtained with the 22 galaxies that are also found to belong to the group 1 of the clustering analysis. The solid line in the figure represents the best linear fit and the dashed lines, the 1 dispersion. Compared with Gladders et al. (1998) that found stable results using 3 iteration, even this conservative RS has about 64% of the galaxies in the central parts of the galaxy concentration. We obtained similar results using bootstrapping analysis, that supports the idea that these galaxies are part of a galaxy cluster. The cluster RS slope is in agreement with observed near-IR RS for the sample of Stott et al. (2009) and the slope evolution model by Bower et al. (2006) at z 0.2.
Finally, we estimated the virial radius of the galaxy cluster at the derived redshift using the method of Merchán & Zandivarez (2005). We found Rvir = 2.1 0.4 Mpc for the galaxies in the group 1 of the clustering analysis, and Rvir = 1.7 0.2 Mpc for the galaxies that follow the RS within 1. The estimates agree with the typical virial radii of galaxy clusters and they are comparable within the uncertainties.
4 Summary
In this work, we report the first confirmed galaxy cluster, named VVV-J144321-611754, originally detected in the tile d015 of the VVV survey. We performed the photometric procedure in the tile as described in Baravalle et al. (2018) obtaining morphological and photometric parameters of 933 extragalactic sources. We defined a 30 30 region centered in the brightest galaxy of the concentration, finding 25 sources that were visually inspected and confirmed to be galaxies. For these galaxies, we obtain extinction corrected median near-IR colors of (H - Ks) = 0.34 0.05 mag, (J - H) = 0.57 0.08 mag and (J - Ks) = 0.87 0.06 mag. The median half-light radius is R1/2 = 1.59 0.16 ; C = 3.01 0.08; = 0.30 0.03 and Sersic index, n = 4.63 0.39. All these morphological parameters are consistent with those of early-type galaxies.
An automatic clustering analysis found four groups in the tile, where the concentration of galaxies VVV-J144321-611754 is a real and the most compact concentration detected, composed of early-type galaxies. Assuming a typical galaxy cluster with low X-ray luminosity, we estimated the photometric redshift of the brightest galaxy to be 0.196 0.025. The IR spectra of the two brightest galaxies exhibit the typical features of early-type galaxies. The estimated redshift for VVV-J144321.06-611753.9 (the brightest galaxy) is 0.2340.022 and for VVV-J144319.02-611746.1 is 0.2320.019. The estimated cluster redshift is 0.2340.022. The presence of the cluster RS is clear in the rest-frame color – magnitude diagram of the studied 30 30 region. Based on all these results, we conclude that the galaxy concentration VVV-J144321-611754 found in the VVV tile d015 is a bona fide galaxy cluster.
References
- Amôres et al. (2012) Amôres, E. B., Sodré, L., Minniti, D., et al. 2012, AJ, 144, 127
- Baravalle et al. (2018) Baravalle, L. D., Alonso, M. V., Nilo Castellón, J. L., Beamín, J. C., & Minniti, D. 2018, AJ, 155, 46
- Barbá et al. (2015) Barbá, R. H., Roman-Lopes, A., Nilo Castellón, J. L., et al. 2015, A&A, 581, A120
- Beamín et al. (2013) Beamín, J. C., Minniti, D., Gromadzki, M., et al. 2013, A&A, 557, L8
- Borissova et al. (2011) Borissova, J., Bonatto, C., Kurtev, R., et al. 2011, A&A, 532, A131
- Borissova et al. (2014) Borissova, J., Ramírez Alegría, S., Chené, A. N., & Kurtev, R. 2014, Revista Mexicana de Astronomia y Astrofisica Conference Series, 44, 149
- Bower et al. (2006) Bower, R. G., Benson, A. J., Malbon, R., et al. 2006, MNRAS, 370, 645
- Brough et al. (2002) Brough, S., Collins, C. A., Burke, D. J., Mann, R. G., & Lynam, P. D. 2002, MNRAS, 329, L53
- Bruzual & Charlot (2003) Bruzual, G., & Charlot, S. 2003, MNRAS, 344, 1000
- Catelan et al. (2011) Catelan, M., Minniti, D., Lucas, P. W., et al. 2011, RR Lyrae Stars, Metal-Poor Stars, and the Galaxy, 5, 145
- Chilingarian et al. (2010) Chilingarian, I. V., Melchior, A.-L., & Zolotukhin, I. Y. 2010, MNRAS, 405, 1409
- Coldwell et al. (2014) Coldwell, G., Alonso, S., Duplancic, F., et al. 2014, A&A, 569, A49
- Conroy et al. (2009) Conroy, C., Gunn, J. E., & White, M. 2009, ApJ, 699, 486
- Ebeling et al. (1996) Ebeling, H., Voges, W., Bohringer, H., et al. 1996, MNRAS, 281, 799
- Ebeling et al. (2002) Ebeling, H., Mullis, C. R., & Tully, R. B. 2002, ApJ, 580, 774
- Gladders et al. (1998) Gladders, M. D., López-Cruz, O., Yee, H. K. C., & Kodama, T. 1998, ApJ, 501, 571
- Henning et al. (1998) Henning, P. A., Kraan-Korteweg, R. C., Rivers, A. J., et al. 1998, AJ, 115, 584
- Huchra et al. (2012) Huchra, J. P., Macri, L. M., Masters, K. L., et al. 2012, ApJS, 199, 26
- Komatsu et al. (2011) Komatsu, E., Smith, K. M., Dunkley, J., et al. 2011, ApJS, 192, 18
- Kraan-Korteweg & Lahav (2000) Kraan-Korteweg, R. C., & Lahav, O. 2000, A&A Rev., 10, 211
- Ma et al. (2013) Ma, Y.-Z., Hinshaw, G., & Scott, D. 2013, ApJ, 771, 137
- Maiolino et al. (1996) Maiolino, R., Rieke, G. H., & Rieke, M. J. 1996, AJ, 111, 537
- Mancone & Gonzalez (2012) Mancone, C. L., & Gonzalez, A. H. 2012, PASP, 124, 606
- Maraston (2005) Maraston, C. 2005, MNRAS, 362, 799
- Mason et al. (2015) Mason, R., Rodriguez-Ardila, A., Martins, L., et al. 2015, ApJS, 217, 13
- McIntyre et al. (2015) McIntyre, T. P., Henning, P. A., Minchin, R. F., Momjian, E., & Butcher, Z. 2015, AJ, 150, 28
- Merchán & Zandivarez (2005) Merchán, M. E., & Zandivarez, A. 2005, ApJ, 630, 759
- Minniti et al. (2010) Minniti, D., Lucas, P. W., Emerson, J. P., et al. 2010, New A, 15, 433
- Minniti et al. (2011) Minniti, D., Hempel, M., Toledo, I., et al. 2011, A&A, 527, A81
- Minniti et al. (2017) Minniti, D., Geisler, D., Alonso-García, J., et al. 2017, ApJ, 849, L24
- Mori et al. (2013) Mori, H., Maeda, Y., Furuzawa, A., Haba, Y., & Ueda, Y. 2013, PASJ, 65, 102
- Nevalainen et al. (2001) Nevalainen, J., Lumb, D., dos Santos, S., et al. 2001, A&A, 374, 66
- Percival et al. (2009) Percival, S. M., Salaris, M., Cassisi, S., & Pietrinferni, A. 2009, ApJ, 690, 427
- Piffaretti et al. (2011) Piffaretti, R., Arnaud, M., Pratt, G. W., Pointecouteau, E., & Melin, J.-B. 2011, A&A, 534, A109
- Ramatsoku et al. (2016) Ramatsoku, M., Verheijen, M. A. W., Kraan-Korteweg, R. C., et al. 2016, MNRAS, 460, 923
- Rayner et al. (2009) Rayner, J., Cushing, M.& Vacca, W., et al. 2009, ApJS, 185, 289
- Schlafly & Finkbeiner (2011) Schlafly, E. F., & Finkbeiner, D. P. 2011, ApJ, 737, 103
- Scrucca et al. (2016) Scrucca L., Fop M., Brendan Murphy T. & Adrian E. Raftery A. E. 2016, The R Journal, 8:1, pages 289-317
- Stott et al. (2009) Stott, J. P., Pimbblet, K. A., Edge, A. C., Smith, G. P., & Wardlow, J. L. 2009, MNRAS, 394, 2098
- Tully (2015) Tully, R. B. 2015, AJ, 149, 54
- Voges et al. (1999) Voges, W., Aschenbach, B., Boller, T., et al. 1999, A&A, 349, 389
- Yee et al. (1999) Yee, H. K. C., Gladders, M. D., & López-Cruz, O. 1999, Photometric Redshifts and the Detection of High Redshift Galaxies, 191, 166

| ID | RA (J2000) | Dec (J2000) | Z | Y | J | H | Ks | Z2″ | Y2″ | J2″ | H2″ | Ks 2″ | R1/2 | C | n | |||
|---|---|---|---|---|---|---|---|---|---|---|---|---|---|---|---|---|---|---|
| VVV-J144217.23-612102.9 | 14:42:17.23 | -61:21:02.9 | 15.85 | 15.58 | 15.45 | 15.16 | 14.95 | 15.79 | 15.47 | 15.27 | 14.96 | 14.74 | 1.27 | 2.79 | 0.29 | 2.09 | ||
| VVV-J144243.03-611529.8 | 14:42:43.03 | -61:15:29.8 | 14.87 | 14.16 | 13.79 | 14.57 | 13.83 | 13.53 | 2.16 | 3.80 | 0.16 | 3.45 | ||||||
| VVV-J144252.33-611955.9 | 14:42:52.33 | -61:19:55.9 | 16.52 | 15.96 | 15.61 | 15.76 | 16.32 | 15.46 | 0.78 | 2.55 | 0.25 | 4.81 | ||||||
| VVV-J144254.41-611308.4 | 14:42:54.41 | -61:13:08.4 | 16.63 | 15.96 | 15.53 | 16.5 | 15.84 | 15.39 | 1.10 | 2.8 | 0.34 | 4.63 | ||||||
| VVV-J144302.30-612104.7 | 14:43:02.30 | -61:21:04.7 | 15.58 | 15.12 | 14.80 | 15.37 | 14.95 | 14.61 | 1.01 | 3.01 | 0.07 | 3.36 | ||||||
| VVV-J144317.50-611807.6 | 14:43:17.50 | -61:18:07.6 | 14.64 | 14.71 | 14.62 | 14.30 | 14.06 | 14.65 | 14.62 | 14.40 | 14.07 | 13.85 | 1.79 | 3.39 | 0.34 | 3.39 | ||
| VVV-J144318.67-611925.5 | 14:43:18.67 | -61:19:25.5 | 15.03 | 14.43 | 13.89 | 14.63 | 13.91 | 13.88 | 2.65 | 2.97 | 0.46 | 2.67 | ||||||
| VVV-J144319.03-611746.2 | 14:43:19.03 | -61:17:46.2 | 15.09 | 14.55 | 14.10 | 15.33 | 14.55 | 14.26 | 1.08 | 2.92 | 0.21 | 6.07 | ||||||
| VVV-J144321.05-611753.9 | 14:43:21.05 | -61:17:53.9 | 14.60 | 14.07 | 13.73 | 14.56 | 13.95 | 13.60 | 2.33 | 3.49 | 0.15 | 7.15 | ||||||
| VVV-J144325.01-611854.7 | 14:43:25.01 | -61:18:54.7 | 15.76 | 15.09 | 14.81 | 15.59 | 14.93 | 14.64 | 1.95 | 3.48 | 0.17 | 5.18 | ||||||
| VVV-J144325.32-611719.0 | 14:43:25.32 | -61:17:19.0 | 15.16 | 14.57 | 14.22 | 15.02 | 14.48 | 14.09 | 1.73 | 3.25 | 0.30 | 4.63 | ||||||
| VVV-J144326.47-611804.6 | 14:43:26.47 | -61:18:04.6 | 15.40 | 14.67 | 14.47 | 15.3 | 14.61 | 14.43 | 0.95 | 3.81 | 0.22 | 9.11 | ||||||
| VVV-J144326.58-611808.8 | 14:43:26.58 | -61:18:08.8 | 15.67 | 14.95 | 14.53 | 15.35 | 14.65 | 14.19 | 1.59 | 2.89 | 0.45 | 2.39 | ||||||
| VVV-J144331.64-612133.1 | 14:43:31.64 | -61:21:33.1 | 15.81 | 15.24 | 14.94 | 15.10 | 15.60 | 14.81 | 0.82 | 2.71 | 0.09 | 6.89 | ||||||
| VVV-J144337.61-611355.6 | 14:43:37.61 | -61:13:55.6 | 16.31 | 15.72 | 15.37 | 15.61 | 16.14 | 15.21 | 0.86 | 2.74 | 0.53 | 5.83 | ||||||
| VVV-J144338.11-611153.2 | 14:43:38.11 | -61:11:53.2 | 14.68 | 14.13 | 13.83 | 14.50 | 13.94 | 13.65 | 1.43 | 3.01 | 0.41 | 2.64 | ||||||
| VVV-J144345.26-611356.6 | 14:43:45.26 | -61:13:56.6 | 15.87 | 15.57 | 15.54 | 15.81 | 15.39 | 15.23 | 1.92 | 3.10 | 0.44 | 2.48 | ||||||
| VVV-J144208.98-612325.1 | 14:42:08.98 | -61:23:25.1 | 16.55 | 15.86 | 15.37 | 16.31 | 15.67 | 15.22 | 1.04 | 2.87 | 0.48 | 6.62 | ||||||
| VVV-J144426.62-610744.4 | 14:44:26.62 | -61:07:44.4 | 15.11 | 14.51 | 14.29 | 15.12 | 14.4 | 14.19 | 1.42 | 3.46 | 0.08 | 5.90 | ||||||
| VVV-J144230.74-612811.3 | 14:42:30.74 | -61:28:11.3 | 15.21 | 15.86 | 15.39 | 15.11 | 14.77 | 15.91 | 15.86 | 15.59 | 15.34 | 14.97 | 2.3 | 2.39 | 0.29 | 2.66 | ||
| VVV-J144331.39-613319.8 | 14:43:31.39 | -61:33:19.8 | 16.99 | 16.28 | 16.0 | 16.75 | 16.18 | 15.88 | 1.33 | 2.83 | 0.39 | 4.09 | ||||||
| VVV-J144248.72-610518.6 | 14:42:48.72 | -61:05:18.6 | 15.81 | 15.12 | 14.64 | 15.91 | 14.92 | 14.515 | 2.71 | 3.29 | 0.65 | 4.31 | ||||||
| VVV-J144426.38-611101.3 | 14:44:26.38 | -61:11:01.3 | 15.5 | 13.9 | 13.9 | 14.07 | 13.49 | 13.7 | 2.44 | 3.48 | 0.21 | 1.74 | ||||||
| VVV-J144507.49-611636.8 | 14:45:07.49 | -61:16:36.8 | 16.05 | 15.71 | 15.41 | 16.11 | 15.58 | 15.19 | 4.09 | 3.43 | 0.68 | 4.67 | ||||||
| VVV-J144524.77-611437.3 | 14:45:24.77 | -61:14:37.3 | 15.86 | 15.34 | 14.7 | 14.06 | 13.72 | 15.86 | 15.26 | 14.6 | 14.17 | 13.641 | 3.06 | 3.76 | 0.44 | 7.37 |