The H surface brightness – radius plane as a diagnostic tool for photoionized nebulae
Abstract
The H surface brightness – radius (–) relation is a robust distance indicator for planetary nebulae (PNe), further enhanced by different populations of PNe having distinct loci in – space. Other types of photoionized nebulae also plot in quite distinct regions in the – plane, allowing its use as a diagnostic tool. In particular, the nova shells and massive star ejecta (MSE) plot on relatively tight loci illustrating their evolutionary sequences. For the MSE, there is potential to develop a distance indicator for these objects, based on their trend in – space. As high-resolution, narrowband surveys of the nearest galaxies become more commonplace, the – plane is a potentially useful diagnostic tool to help identify the various ionized nebulae in these systems.
1 Introduction
This paper explores the potential of the – plane as a diagnostic tool for the study of photoionized emission nebulae. As part of our work on determining distances for Galactic planetary nebulae (PNe), we developed and calibrated the H surface brightness – radius (–) relation [1], which has been shown to be more accurate than previous statistical distance methods, particularly for the demographically common ‘senile’ PNe. Its application requires an angular size, an integrated H flux, and the reddening to the PN. From these quantities, an intrinsic radius is calculated, which when combined with the angular size, yields the distance directly. Rather than using the radio domain, we chose the H emission-line, firstly as it best represents the nebular ionized mass, and secondly because a number of narrowband H imaging surveys have recently become available [2][3][4][5], from which accurate integrated fluxes and/or diameters can be determined [6][7][8]. Ongoing H surveys [9] will continue to be useful, as part of our ongoing efforts to characterize the entire Galactic PN population [10].
2 The H relation for planetary nebulae
In [1] we described in detail the construction of a catalogue of H fluxes, angular diameters, and distances for both Galactic and extra-galactic PNe, to be used as primary calibrators for the – relation. This relation was refined from earlier versions [11][12][13][14][15] published previously, based on continued improvement in the input data, with consequent reduction of the uncertainties. A range of criteria to further improve the precision of the – relation were investigated by [15], with [1] eventually separating PNe into two broad groups based on spectroscopic criteria. Optically thick PNe (with strong [O ii] and [N ii] lines) are systematically more massive than the optically-thin PNe that fall along the lower part of the PN locus. Using sub-trends has allowed more precision in determining distances, as good as 18 per cent in the case of optically-thin PNe. Recently, [16] analysed the commonly-used SSV distance scale [17] in some depth. In particular, this scale has a substantial scale error at large PN radii, meaning that the distances for evolved (demographically-common) PNe are considerably underestimated, by a factor of two-or-so. Our revised scale [1] is largely free of this problem, having improved on the mean – relation of [15], which in turn had been independently validated [16][18][19] as the most reliable statistical distance scale to date. We expect our distances to remain useful even after the expected data avalanche from the Gaia satellite [21], as many PN central stars are fainter than the Gaia magnitude limit, or have confusion problems in compact PNe of high surface brightness [22]. Of course the Gaia parallaxes will allow the refinement of our proposed sub-trends in the – plane, enhancing its ability both as a diagnostic tool, and as a robust measure for the many PNe without trigonometric distances.
3 Other Emission Nebulae
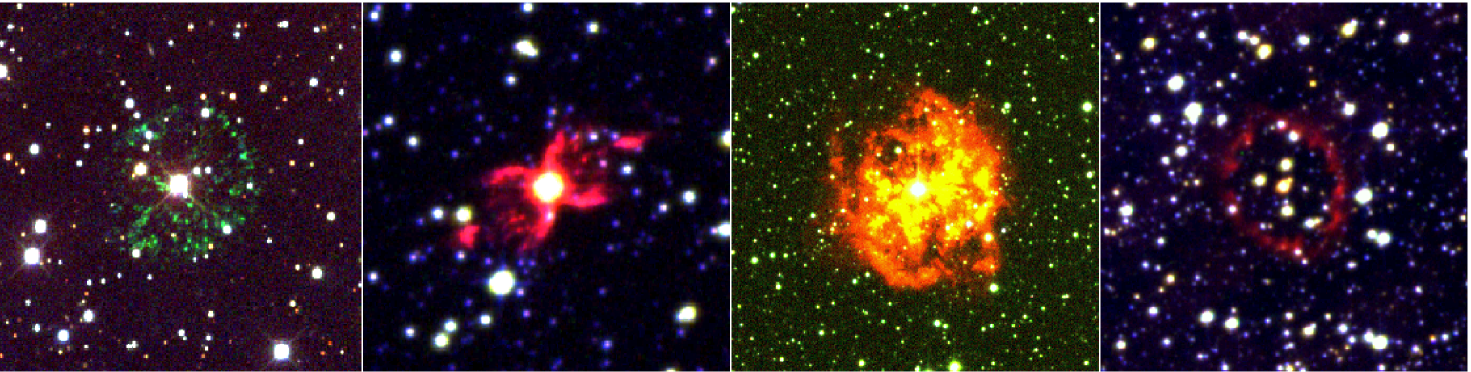
Besides the PNe discussed in [1], we are also interested in the ability of the – diagram to discriminate between bona fide PNe, transitional objects, and the zoo of PN-like nebulae and outright mimics (see Fig. 1) that have been confused with them [23][24], both in the Milky Way and in the nearest galaxies. It is well known that some bipolar PNe have similar morphologies to the outflows around D-type symbiotic stars (SyS), and their similarities and differences have been discussed several times in the literature, e.g. [25][26][27][28]. To investigate these nebulae, we have adopted H fluxes from the literature, supplemented with our own data [6][7][10], while distances have been taken from the sources given in [1], supplemented with a few distances from [20]. Note that the locations of the SyS nebulae in the – plot are only indicative, as their fluxes and dimensions are difficult to measure precisely. For the ejecta around luminous blue variable (LBV) and Wolf-Rayet stars [29][30], we adopt the data directly from [1], as we do for the low-mass H ii regions in the ISM. We also plot a range of nova shells where we utilize the rather heterogeneous data compiled by [31][32][33]. Finally, we add the faint bipolar nebula surrounding CK Vul [34][35], the bowshock nebulae around the nova-like cataclysmic variables (CVs) BZ Cam [36][37] and V341 Ara [15][38], as well as the peculiar object Te 11 [39][40].
4 Discussion
In Fig. 2, we plot a range of different photoionized nebulae in – space. Besides the primary PN locus, some transitional PNe and miscellaneous PN-like objects described in [1] are also plotted. Particularly interesting are the locations of the core and lobes of the outflow KjPn8 [41], showing the large range in ejecta mass between outflow episodes. The massive star ejecta (MSE) generally plot above the PNe, reflecting their larger ionized masses in the mean. For the MSE, a reasonably tight evolutionary trend is seen, if we exclude the young, low-mass outflow around the historical LBV, P Cygni. The points can be fit by a relation with a slope of , markedly shallower than the PN locus, indicating the substantial amount of circumstellar and/or interstellar material being swept up in the evolved MSE. The data suggest an approximate distance scale can be developed for ejecta around LBVs and WN stars, at least for those shells that are not dominated by snow-plowed interstellar matter.
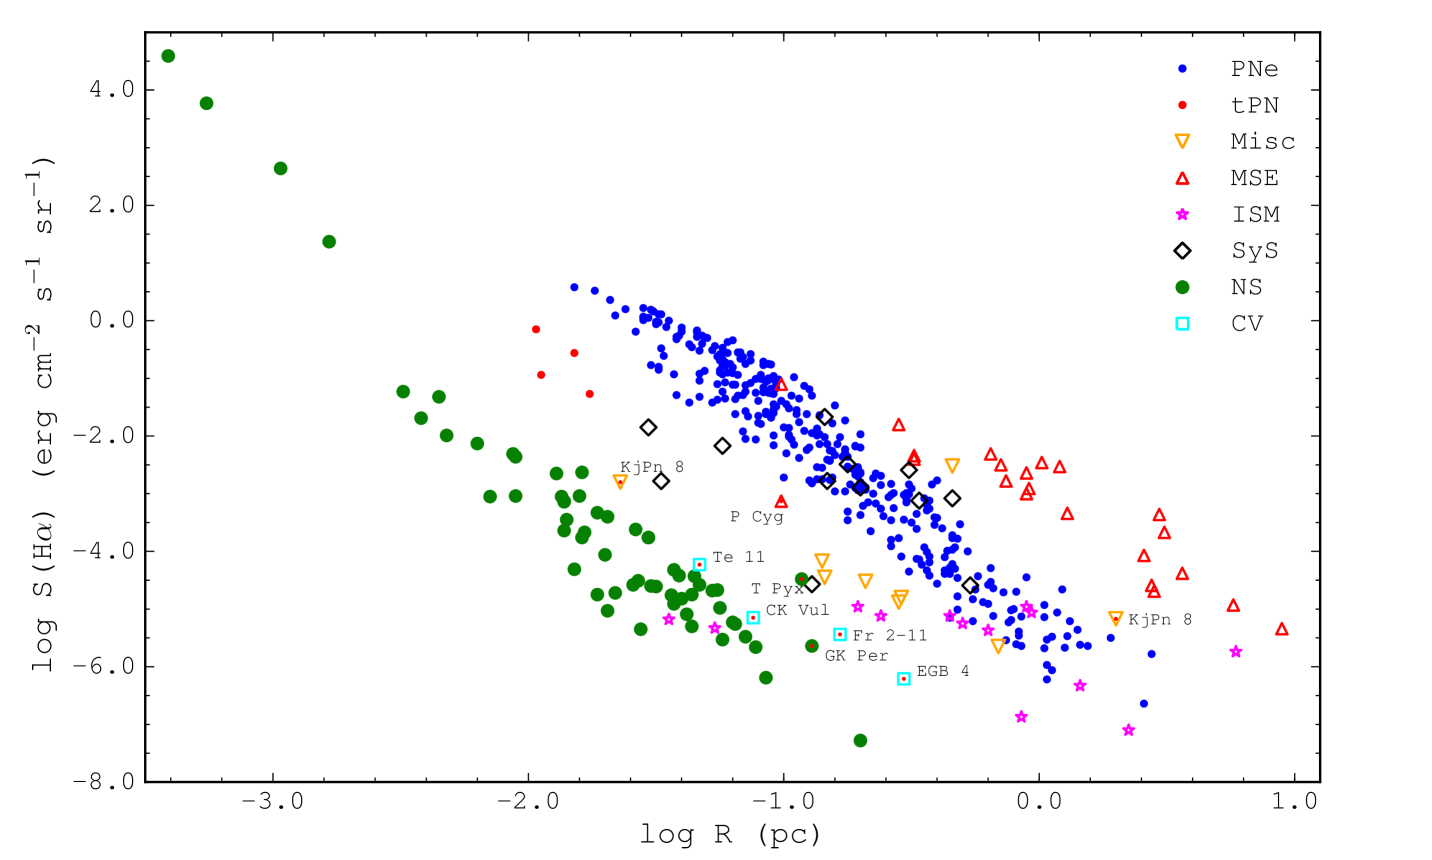
The nova shells, as expected, show a steep relation (power law slope ) at young ages due to adiabatic expansion, before the trend flattens at larger radii as additional circumstellar material is swept up. The unusual (massive) shells around GK Per and T Pyx [42][43][44] are seen to be above the mean shell trend. Note there is at least one PN hosting a classical nova [45], as well a very faint bipolar nebula [43][46] surrounding the nova ejecta from GK Per, with properties similar to a low-mass PN [1]. The CV bowshock nebulae (EGB 4 and Fr 2-11) are clearly seen to be of lower ionized mass than PNe, though apparently distinct to classical nova shells. Te 11 has affinities with these nebulae, based on its nebular abundances and very low expansion velocity; while it plots close to the ordinary nova shells, its distinct morphology (i.e. a high volume filling factor) suggests a greater ionized mass and different origin, cf. [40]. The bipolar nebula around CK Vul is seen to have a mass comparable to a nova shell, but its origin remains uncertain [35]. As shown in [1] the diffuse H ii regions in the ISM ionized by low-mass stars are generally of low to very-low surface brightness and plot on and around the PN locus at medium to large radii. What is somewhat unexpected is the substantial overlap in phase space between the symbiotic outflows and PNe, with some evolved SyS nebulae being as massive as typical PNe. Along with the emission-line diagnostic diagrams we have developed [23][47][48], the – plane will also be a useful adjunct to help identify ionized nebulae in and beyond the Milky Way, particularly with the advent of deep hydrogen-line surveys using the next generation of telescopes. A more detailed discussion will be published elsewhere.
References
References
- [1] Frew D J, Parker Q A and Bojičić I S 2016 MNRAS 455 1459
- [2] Gaustad J E, McCullough P R, Rosing W and Van Buren D 2001 PASP 113 1326
- [3] Haffner L M, Reynolds R J, Tufte S L, Madsen G J, Jaehnig K P and Percival J W 2003 ApJS 149 405
- [4] Drew J E et al. 2005 MNRAS 362 753
- [5] Parker Q A et al. 2005 MNRAS 362 689
- [6] Frew D J, Bojičić I S and Parker Q A 2013 MNRAS 431 2
- [7] Frew D J, Bojičić I S, Parker Q A, Pierce M J, Gunawardhana M L and Reid W A 2014a MNRAS 440 1080
- [8] Madsen G J, Frew D J, Parker Q A, Reynolds R J and Haffner L M 2006 in Proc. IAU Symp. vol 234 Planetary Nebulae in our Galaxy and Beyond, ed M J Barlow and R H Méndez (Cambridge: CUP) p 455
- [9] Drew J E et al. 2014 MNRAS 440 2036
- [10] Parker Q A et al. 2015 Amer. Astron. Soc. Meeting 225 108.06
- [11] Pierce M J, Frew D J, Parker Q A and Köppen J 2004 Pub. Astron. Soc. Aust. 21 334
- [12] Frew D J, Parker Q A and Russeil D 2006 MNRAS 372 1081
- [13] Frew D J and Parker Q A 2006 in Proc. IAU Symp. vol 234 Planetary Nebulae in our Galaxy and Beyond, ed M J Barlow and R H Méndez (Cambridge: Cambridge University Press) p 49
- [14] Frew D J and Parker Q A 2007 in Proc. APN IV Conf., ed R L M Corradi, A Manchado and N Soker, online at http://wwwiaces/proyect/apn4 id. 68
- [15] Frew D J 2008 PhD thesis (Macquarie University, Sydney)
- [16] Smith H 2015 MNRAS 449 2980
- [17] Stanghellini L, Shaw R A and Villaver E 2008 ApJ 689 194
- [18] Jacob R, Schönberner D and Steffen M 2013 A&A 558 A78
- [19] Ali A, Ismail H A and Alsolami Z 2015 Ap&SS 357 21
- [20] Vickers S B, Frew D J, Parker Q A and Bojičić I S 2015 MNRAS 447 1673
- [21] Cacciari C, Pancino E and Bellazzini M 2016 Astron. Nachr. in press (arXiv:1512.03658)
- [22] Manteiga M, Fustes D, Dafonte C and Arcay B 2014 in Proc. APN VI Conf., ed C Morisset, G Delgado-Inglada and S Torres-Peimbert, online at http://www.astroscu.unam.mx/apn6/PROCEEDINGS/ id. 57
- [23] Frew D J and Parker Q A 2010 Pub. Astron. Soc. Aust. 27 129
- [24] Frew D J, Madsen G J, O’Toole S J and Parker Q A 2010 Pub. Astron. Soc. Aust. 27 203
- [25] Corradi R L M and Schwarz H E 1995 A&A 293 871
- [26] Corradi R L M 2003 in ASP Conf. Proc. vol 303 Symbiotic Stars Probing Stellar Evolution, ed R L M Corradi, J Mikolajewska and T J Mahoney (San Francisco: Astronomical Society of the Pacific) p 393
- [27] Kwok S 2003 in ASP Conf. Proc. vol 303 Symbiotic Stars Probing Stellar Evolution, ed R L M Corradi, J Mikolajewska and T J Mahoney (San Francisco: Astronomical Society of the Pacific) p 428
- [28] Miszalski B., Boffin H M J, Frew D J, Acker A, Köppen J, Moffat A F J and Parker Q 2012 MNRAS 419 39
- [29] Chu Y-H 2003 in Proc. IAU Symp. vol 212 A Massive Star Odyssey: From Main Sequence to Supernova, ed K van der Hucht, A Herrero and C Esteban (San Francisco: Astronomical Society of the Pacific) p 585
- [30] Weis K 2003 A&A 408 205
- [31] Downes R A and Duerbeck H W 2000 AJ 120 2007
- [32] Downes R A, Duerbeck H W and Delahodde C E 2001 J. Astron. Data 7 6
- [33] Gill C D and O’Brien T J 2000 MNRAS 314 175
- [34] Hajduk M et al. 2007 MNRAS 378 1298
- [35] Hajduk M, van Hoof P A M and Zijlstra A A 2014 MNRAS 432 167
- [36] Greiner J et al. 2001 A&A 376 1031
- [37] Hollis J M, Oliversen R J, Wagner R M and Feibelman W A 1992 ApJ 393 217
- [38] Frew D J, Madsen G J and Parker Q A 2006 in Proc. IAU Symp. vol 234 Planetary Nebulae in our Galaxy and Beyond, ed M J Barlow and R H Méndez (Cambridge: Cambridge University Press) p 395
- [39] Jacoby G H et al. 2010 Pub. Astron. Soc. Aust. 27 156
- [40] Miszalski B et al. 2016 MNRAS 456 633
- [41] López J A, Vázquez R and Rodríguez L F 1995 ApJ 455 L63
- [42] Liimets T et al. 2012 ApJ 761 34
- [43] Shara M M, Zurek D, De Marco O, Mizusawa T, Williams R and Livio M 2012 AJ 143 143
- [44] Shara M M et al. 2015 ApJ 805 148
- [45] Wesson R et al. 2008 ApJ 688 L21
- [46] Bode M F, Roberts J A, Whittet D C B, Seaquist E R and Frail D A 1987 Nature 329 519
- [47] Sabin L et al. 2013 MNRAS 431 279
- [48] Frew D J et al. 2014b MNRAS 440 1345