marginnote \restoresymbolorigmarginnotemarginnote \jvolAA \jyearYYYY
The Interstellar Dust Properties of Nearby Galaxies
Abstract
This article gives an overview of the constitution, physical conditions and observables of dust in the interstellar medium of nearby galaxies. We first review the macroscopic, spatial distribution of dust in these objects, and its consequence on our ability to study grain physics. We also discuss the possibility to use dust tracers as diagnostic tools. We then survey our current understanding of the microscopic, intrinsic properties of dust in different environments, derived from different observables: emission, extinction, polarization, depletions, over the whole electromagnetic spectrum. Finally, we summarize the clues of grain evolution, evidenced either on local scales or over cosmic time. We put in perspective the different evolution scenarios. We attempt a comprehensive presentation of the main observational constraints, analysis methods and modelling frameworks of the distinct processes. We do not cover the dust properties of the Milky Way and distant galaxies, nor circumstellar or active galactic nucleus torus dust.
doi:
10.1146/((please add article doi))keywords:
ISM: dust, Magellanic clouds, nearby galaxies, methods1 INTRODUCTION
1.1 The Interstellar Dust: a Key Galaxy Component
Interstellar grains are solid particles of sizes , made of heavy elements (mainly O, C, Si, Mg, Fe) available in the InterStellar Medium (\HyColor@XZeroOneThreeFour\pc@goptd@color\pc@hyenc@colorpdfcommentcolor\HyColor@XZeroOneThreeFour\pc@goptd@fontcolor\pc@hyenc@fontcolorpdfcommentcolor\HyColor@XZeroOneThreeFour\pc@goptd@icolor\pc@hyenc@icolorpdfcommentcolor\pdfmark[ISM]pdfmark=/ANN,Subtype=/Widget,Raw=/TU (Interstellar medium\textCR(\pc@goptd@deadline)) /T (tooltip zref@0) /C [ ] /FT/Btn /F 768 /Ff 65536 /H/N /BS ¡¡ /W 0 ¿¿ ). They appear to be rather uniformly mixed with the gas. Although accounting for of the \HyColor@XZeroOneThreeFour\pc@goptd@color\pc@hyenc@colorpdfcommentcolor\HyColor@XZeroOneThreeFour\pc@goptd@fontcolor\pc@hyenc@fontcolorpdfcommentcolor\HyColor@XZeroOneThreeFour\pc@goptd@icolor\pc@hyenc@icolorpdfcommentcolor\pdfmark[ISM]pdfmark=/ANN,Subtype=/Widget,Raw=/TU (Interstellar medium\textCR(\pc@goptd@deadline)) /T (tooltip zref@1) /C [ ] /FT/Btn /F 768 /Ff 65536 /H/N /BS ¡¡ /W 0 ¿¿ mass, they have a radical impact on galaxies, as they scatter and absorb starlight. In normal disk galaxies, they re-radiate in the InfraRed (\HyColor@XZeroOneThreeFour\pc@goptd@color\pc@hyenc@colorpdfcommentcolor\HyColor@XZeroOneThreeFour\pc@goptd@fontcolor\pc@hyenc@fontcolorpdfcommentcolor\HyColor@XZeroOneThreeFour\pc@goptd@icolor\pc@hyenc@icolorpdfcommentcolor\pdfmark[IR]pdfmark=/ANN,Subtype=/Widget,Raw=/TU (Infrared\textCR(\pc@goptd@deadline)) /T (tooltip zref@2) /C [ ] /FT/Btn /F 768 /Ff 65536 /H/N /BS ¡¡ /W 0 ¿¿ ) about of the stellar power, and up to in ultraluminous \HyColor@XZeroOneThreeFour\pc@goptd@color\pc@hyenc@colorpdfcommentcolor\HyColor@XZeroOneThreeFour\pc@goptd@fontcolor\pc@hyenc@fontcolorpdfcommentcolor\HyColor@XZeroOneThreeFour\pc@goptd@icolor\pc@hyenc@icolorpdfcommentcolor\pdfmark[IR]pdfmark=/ANN,Subtype=/Widget,Raw=/TU (Infrared\textCR(\pc@goptd@deadline)) /T (tooltip zref@3) /C [ ] /FT/Btn /F 768 /Ff 65536 /H/N /BS ¡¡ /W 0 ¿¿ galaxies (e.g. Clements et al., 1996). In addition, they are responsible for the heating of the gas in PhotoDissociation Regions (\HyColor@XZeroOneThreeFour\pc@goptd@color\pc@hyenc@colorpdfcommentcolor\HyColor@XZeroOneThreeFour\pc@goptd@fontcolor\pc@hyenc@fontcolorpdfcommentcolor\HyColor@XZeroOneThreeFour\pc@goptd@icolor\pc@hyenc@icolorpdfcommentcolor\pdfmark[PDR]pdfmark=/ANN,Subtype=/Widget,Raw=/TU (Photodissociation region\textCR(\pc@goptd@deadline)) /T (tooltip zref@4) /C [ ] /FT/Btn /F 768 /Ff 65536 /H/N /BS ¡¡ /W 0 ¿¿ ), by photoelectric effect (\HyColor@XZeroOneThreeFour\pc@goptd@color\pc@hyenc@colorpdfcommentcolor\HyColor@XZeroOneThreeFour\pc@goptd@fontcolor\pc@hyenc@fontcolorpdfcommentcolor\HyColor@XZeroOneThreeFour\pc@goptd@icolor\pc@hyenc@icolorpdfcommentcolor\pdfmark[PE]pdfmark=/ANN,Subtype=/Widget,Raw=/TU (Photoelectric\textCR(\pc@goptd@deadline)) /T (tooltip zref@5) /C [ ] /FT/Btn /F 768 /Ff 65536 /H/N /BS ¡¡ /W 0 ¿¿ ; Draine, 1978). They are also catalysts of numerous chemical reactions, including the formation of the most abundant molecule in the Universe, H2 (Gould & Salpeter, 1963).
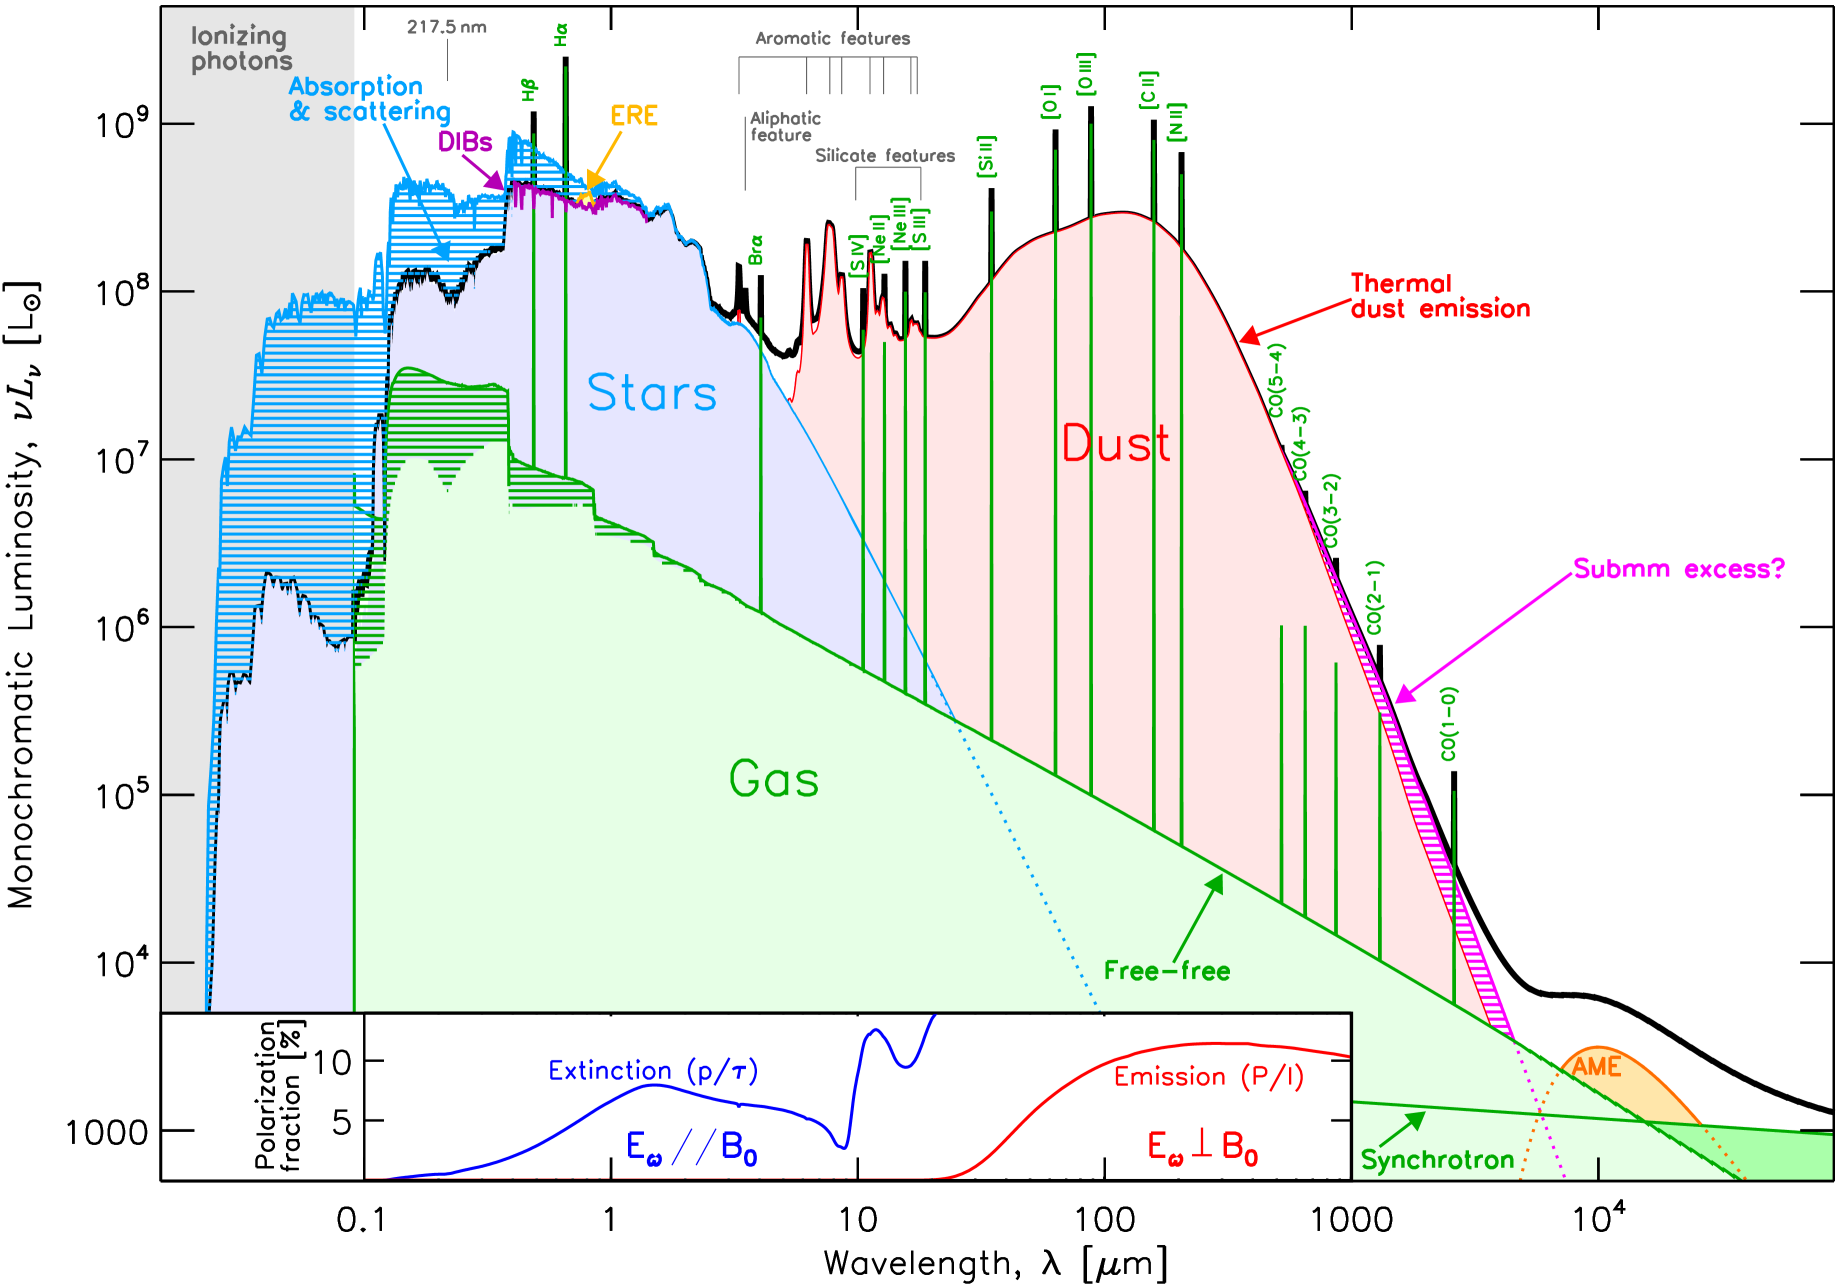
A detailed knowledge of the grain properties is crucial to study the lifecycle of the \HyColor@XZeroOneThreeFour\pc@goptd@color\pc@hyenc@colorpdfcommentcolor\HyColor@XZeroOneThreeFour\pc@goptd@fontcolor\pc@hyenc@fontcolorpdfcommentcolor\HyColor@XZeroOneThreeFour\pc@goptd@icolor\pc@hyenc@icolorpdfcommentcolor\pdfmark[ISM]pdfmark=/ANN,Subtype=/Widget,Raw=/TU (Interstellar medium\textCR(\pc@goptd@deadline)) /T (tooltip zref@6) /C [ ] /FT/Btn /F 768 /Ff 65536 /H/N /BS ¡¡ /W 0 ¿¿ and galaxy evolution, as it is needed to: (1) unredden \HyColor@XZeroOneThreeFour\pc@goptd@color\pc@hyenc@colorpdfcommentcolor\HyColor@XZeroOneThreeFour\pc@goptd@fontcolor\pc@hyenc@fontcolorpdfcommentcolor\HyColor@XZeroOneThreeFour\pc@goptd@icolor\pc@hyenc@icolorpdfcommentcolor\pdfmark[UV]pdfmark=/ANN,Subtype=/Widget,Raw=/TU (Ultraviolet\textCR(\pc@goptd@deadline)) /T (tooltip zref@7) /C [ ] /FT/Btn /F 768 /Ff 65536 /H/N /BS ¡¡ /W 0 ¿¿ -visible observations; (2) study deeply embedded regions; (3) build reliable diagnostics of the physical conditions and of the evolutionary stage of a galaxy or a star forming region; (4) provide accurate prescriptions in photoionization and photodissociation models, and simulations of the star formation process. However, as we will show in this review, there remains several uncertainties about the grain properties and their evolution. Dust physics is characterized by the great complexity of its object. The number of ways to combine elements to build interstellar solids is virtually limitless and has consequences on the longevity of the particle and its observables. The progress in this field is thus mainly driven by empirical constraints: observations over the whole electromagnetic spectrum (Figure 1); and laboratory experiments on dust analogs.
[h]
2 WHAT ARE THE “DUST PROPERTIES”?
2.0.1 Dust mixture constitution
The constitution of a grain mixture is defined by: (1) the chemical composition of the bulk material and its stoichiometry; (2) the structure of the grains (crystalline, amorphous, porous, aggregated, etc.); (3) the presence of heterogeneous inclusions; (4) the presence of organic and/or icy mantles; (5) the shape of the grains; (6) their size distribution; (7) their abundance relative to the gas.
2.0.2 Dust physical conditions
A dust mixture, with a given constitution, can experience different physical conditions: (1) thermal excitation of the grains, due to radiative heating (equilibrium or stochastic), or to collisional heating in a hot plasma; (2) grain charging by exchange of electrons with the gas; (3) alignment of elongated grains on the magnetic field; (4) grain rotation (relevant for the smallest sizes).
2.0.3 Dust observables
A grain mixture undergoing a given set of physical conditions will exhibit the following observables (represented on Figure 1): (1. Emission) the emission of a thermal continuum (\HyColor@XZeroOneThreeFour\pc@goptd@color\pc@hyenc@colorpdfcommentcolor\HyColor@XZeroOneThreeFour\pc@goptd@fontcolor\pc@hyenc@fontcolorpdfcommentcolor\HyColor@XZeroOneThreeFour\pc@goptd@icolor\pc@hyenc@icolorpdfcommentcolor\pdfmark[IR]pdfmark=/ANN,Subtype=/Widget,Raw=/TU (Infrared\textCR(\pc@goptd@deadline)) /T (tooltip zref@8) /C [ ] /FT/Btn /F 768 /Ff 65536 /H/N /BS ¡¡ /W 0 ¿¿ to mm), and molecular and solid state features (Mid-\HyColor@XZeroOneThreeFour\pc@goptd@color\pc@hyenc@colorpdfcommentcolor\HyColor@XZeroOneThreeFour\pc@goptd@fontcolor\pc@hyenc@fontcolorpdfcommentcolor\HyColor@XZeroOneThreeFour\pc@goptd@icolor\pc@hyenc@icolorpdfcommentcolor\pdfmark[IR]pdfmark=/ANN,Subtype=/Widget,Raw=/TU (Infrared\textCR(\pc@goptd@deadline)) /T (tooltip zref@9) /C [ ] /FT/Btn /F 768 /Ff 65536 /H/N /BS ¡¡ /W 0 ¿¿ ; \HyColor@XZeroOneThreeFour\pc@goptd@color\pc@hyenc@colorpdfcommentcolor\HyColor@XZeroOneThreeFour\pc@goptd@fontcolor\pc@hyenc@fontcolorpdfcommentcolor\HyColor@XZeroOneThreeFour\pc@goptd@icolor\pc@hyenc@icolorpdfcommentcolor\pdfmark[MIR]pdfmark=/ANN,Subtype=/Widget,Raw=/TU (Mid-infrared\textCR(\pc@goptd@deadline)) /T (tooltip zref@10) /C [ ] /FT/Btn /F 768 /Ff 65536 /H/N /BS ¡¡ /W 0 ¿¿ ); a possible microwave emission (cm); a possible luminescence (visible); the possible polarization of this emission (\HyColor@XZeroOneThreeFour\pc@goptd@color\pc@hyenc@colorpdfcommentcolor\HyColor@XZeroOneThreeFour\pc@goptd@fontcolor\pc@hyenc@fontcolorpdfcommentcolor\HyColor@XZeroOneThreeFour\pc@goptd@icolor\pc@hyenc@icolorpdfcommentcolor\pdfmark[IR]pdfmark=/ANN,Subtype=/Widget,Raw=/TU (Infrared\textCR(\pc@goptd@deadline)) /T (tooltip zref@11) /C [ ] /FT/Btn /F 768 /Ff 65536 /H/N /BS ¡¡ /W 0 ¿¿ to mm); (2. Absorption) the absorption of the light from a background source by a continuum, as well as molecular and solid state features, including diffuse interstellar bands and ices (X-ray to \HyColor@XZeroOneThreeFour\pc@goptd@color\pc@hyenc@colorpdfcommentcolor\HyColor@XZeroOneThreeFour\pc@goptd@fontcolor\pc@hyenc@fontcolorpdfcommentcolor\HyColor@XZeroOneThreeFour\pc@goptd@icolor\pc@hyenc@icolorpdfcommentcolor\pdfmark[MIR]pdfmark=/ANN,Subtype=/Widget,Raw=/TU (Mid-infrared\textCR(\pc@goptd@deadline)) /T (tooltip zref@12) /C [ ] /FT/Btn /F 768 /Ff 65536 /H/N /BS ¡¡ /W 0 ¿¿ ); the possible polarization of this absorption (\HyColor@XZeroOneThreeFour\pc@goptd@color\pc@hyenc@colorpdfcommentcolor\HyColor@XZeroOneThreeFour\pc@goptd@fontcolor\pc@hyenc@fontcolorpdfcommentcolor\HyColor@XZeroOneThreeFour\pc@goptd@icolor\pc@hyenc@icolorpdfcommentcolor\pdfmark[UV]pdfmark=/ANN,Subtype=/Widget,Raw=/TU (Ultraviolet\textCR(\pc@goptd@deadline)) /T (tooltip zref@13) /C [ ] /FT/Btn /F 768 /Ff 65536 /H/N /BS ¡¡ /W 0 ¿¿ to visible); (3. Scattering) the scattering of the light from a bright source in our direction, and its polarization (X-ray to Near-\HyColor@XZeroOneThreeFour\pc@goptd@color\pc@hyenc@colorpdfcommentcolor\HyColor@XZeroOneThreeFour\pc@goptd@fontcolor\pc@hyenc@fontcolorpdfcommentcolor\HyColor@XZeroOneThreeFour\pc@goptd@icolor\pc@hyenc@icolorpdfcommentcolor\pdfmark[IR]pdfmark=/ANN,Subtype=/Widget,Raw=/TU (Infrared\textCR(\pc@goptd@deadline)) /T (tooltip zref@14) /C [ ] /FT/Btn /F 768 /Ff 65536 /H/N /BS ¡¡ /W 0 ¿¿ ; \HyColor@XZeroOneThreeFour\pc@goptd@color\pc@hyenc@colorpdfcommentcolor\HyColor@XZeroOneThreeFour\pc@goptd@fontcolor\pc@hyenc@fontcolorpdfcommentcolor\HyColor@XZeroOneThreeFour\pc@goptd@icolor\pc@hyenc@icolorpdfcommentcolor\pdfmark[NIR]pdfmark=/ANN,Subtype=/Widget,Raw=/TU (Near-infrared\textCR(\pc@goptd@deadline)) /T (tooltip zref@15) /C [ ] /FT/Btn /F 768 /Ff 65536 /H/N /BS ¡¡ /W 0 ¿¿ ). (4. Depletions) some elemental depletion patterns.
2.1 The Invaluable Laboratories of Nearby Galaxies
Most of our knowledge of the dust properties comes from studies of the Milky Way (\HyColor@XZeroOneThreeFour\pc@goptd@color\pc@hyenc@colorpdfcommentcolor\HyColor@XZeroOneThreeFour\pc@goptd@fontcolor\pc@hyenc@fontcolorpdfcommentcolor\HyColor@XZeroOneThreeFour\pc@goptd@icolor\pc@hyenc@icolorpdfcommentcolor\pdfmark[MW]pdfmark=/ANN,Subtype=/Widget,Raw=/TU (Milky Way\textCR(\pc@goptd@deadline)) /T (tooltip zref@24) /C [ ] /FT/Btn /F 768 /Ff 65536 /H/N /BS ¡¡ /W 0 ¿¿ ). However, as it will be demonstrated in this paper, an increasing number of nearby galaxy studies provide unique discriminating constraints on fundamental dust processes. Indeed, nearby galaxies harbor a wider diversity of environmental conditions (metallicity, star formation activity, etc.) than what can be found in the \HyColor@XZeroOneThreeFour\pc@goptd@color\pc@hyenc@colorpdfcommentcolor\HyColor@XZeroOneThreeFour\pc@goptd@fontcolor\pc@hyenc@fontcolorpdfcommentcolor\HyColor@XZeroOneThreeFour\pc@goptd@icolor\pc@hyenc@icolorpdfcommentcolor\pdfmark[MW]pdfmark=/ANN,Subtype=/Widget,Raw=/TU (Milky Way\textCR(\pc@goptd@deadline)) /T (tooltip zref@25) /C [ ] /FT/Btn /F 768 /Ff 65536 /H/N /BS ¡¡ /W 0 ¿¿ . In particular, they allow us to observe dust in extreme conditions. Second, they constitute a necessary intermediate step towards understanding distant galaxies, as they are spatially resolved and have a better wavelength coverage. Finally, the interpretation can sometimes be more difficult in the \HyColor@XZeroOneThreeFour\pc@goptd@color\pc@hyenc@colorpdfcommentcolor\HyColor@XZeroOneThreeFour\pc@goptd@fontcolor\pc@hyenc@fontcolorpdfcommentcolor\HyColor@XZeroOneThreeFour\pc@goptd@icolor\pc@hyenc@icolorpdfcommentcolor\pdfmark[MW]pdfmark=/ANN,Subtype=/Widget,Raw=/TU (Milky Way\textCR(\pc@goptd@deadline)) /T (tooltip zref@26) /C [ ] /FT/Btn /F 768 /Ff 65536 /H/N /BS ¡¡ /W 0 ¿¿ , as we see the projected material of its entire disk. On the contrary, high latitude observations of face-on galaxies can provide cleaner sightlines.
We do not have a precise definition of nearby galaxies. They constitute a category expanding with the angular resolution of \HyColor@XZeroOneThreeFour\pc@goptd@color\pc@hyenc@colorpdfcommentcolor\HyColor@XZeroOneThreeFour\pc@goptd@fontcolor\pc@hyenc@fontcolorpdfcommentcolor\HyColor@XZeroOneThreeFour\pc@goptd@icolor\pc@hyenc@icolorpdfcommentcolor\pdfmark[IR]pdfmark=/ANN,Subtype=/Widget,Raw=/TU (Infrared\textCR(\pc@goptd@deadline)) /T (tooltip zref@27) /C [ ] /FT/Btn /F 768 /Ff 65536 /H/N /BS ¡¡ /W 0 ¿¿ observatories. In this review, we consider they are objects closer than Mpc.
3 THE MACROSCOPIC DISTRIBUTION OF DUST IN GALAXIES
3.1 The Observational Point of View
3.1.1 The Dust Distribution in Disk Galaxies
Dust biases our understanding of galactic structure, as it affects our derivation of luminosity profiles. The level of dust attenuation can indeed strongly vary depending on the sightline and from one galaxy to another (e.g. Calzetti, 2001; Pierini et al., 2004; Battisti, Calzetti & Chary, 2016). Understanding how dust is distributed in galaxies is a necessary step to correct for these attenuation effects. ††margin: \entry Scale-length/heightthe intensity, at radius/azimuth, , can be written as: , where is the scale-length/height.
3.1.1.1 MIR dust scale-length
@goptd@color\pc@hyenc@colorpdfcommentcolor\HyColor@XZeroOneThreeFour\pc@goptd@fontcolor\pc@hyenc@fontcolorpdfcommentcolor\HyColor@XZeroOneThreeFour\pc@goptd@icolor\pc@hyenc@icolorpdfcommentcolor\pdfmark[ISO]pdfmark=/ANN,Subtype=/Widget,Raw=/TU (Infrared Space Telescope (5-210 microns; 1995-1998)\textCR(\pc@goptd@deadline)) /T (tooltip zref@28) /C [ ] /FT/Btn /F 768 /Ff 65536 /H/N /BS ¡¡ /W 0 ¿¿ observations helped assess the \HyColor@XZeroOneThreeFour\pc@goptd@color\pc@hyenc@colorpdfcommentcolor\HyColor@XZeroOneThreeFour\pc@goptd@fontcolor\pc@hyenc@fontcolorpdfcommentcolor\HyColor@XZeroOneThreeFour\pc@goptd@icolor\pc@hyenc@icolorpdfcommentcolor\pdfmark[MIR]pdfmark=/ANN,Subtype=/Widget,Raw=/TU (Mid-infrared\textCR(\pc@goptd@deadline)) /T (tooltip zref@29) /C [ ] /FT/Btn /F 768 /Ff 65536 /H/N /BS ¡¡ /W 0 ¿¿ extent of nearby spirals (especially at 7 and ). They showed that the \HyColor@XZeroOneThreeFour\pc@goptd@color\pc@hyenc@colorpdfcommentcolor\HyColor@XZeroOneThreeFour\pc@goptd@fontcolor\pc@hyenc@fontcolorpdfcommentcolor\HyColor@XZeroOneThreeFour\pc@goptd@icolor\pc@hyenc@icolorpdfcommentcolor\pdfmark[MIR]pdfmark=/ANN,Subtype=/Widget,Raw=/TU (Mid-infrared\textCR(\pc@goptd@deadline)) /T (tooltip zref@30) /C [ ] /FT/Btn /F 768 /Ff 65536 /H/N /BS ¡¡ /W 0 ¿¿ and optical emission have very similar morphologies and concentration indices (Boselli et al., 2003). However, the \HyColor@XZeroOneThreeFour\pc@goptd@color\pc@hyenc@colorpdfcommentcolor\HyColor@XZeroOneThreeFour\pc@goptd@fontcolor\pc@hyenc@fontcolorpdfcommentcolor\HyColor@XZeroOneThreeFour\pc@goptd@icolor\pc@hyenc@icolorpdfcommentcolor\pdfmark[MIR]pdfmark=/ANN,Subtype=/Widget,Raw=/TU (Mid-infrared\textCR(\pc@goptd@deadline)) /T (tooltip zref@31) /C [ ] /FT/Btn /F 768 /Ff 65536 /H/N /BS ¡¡ /W 0 ¿¿ scale-length tends to be systematically smaller than the optical one (Malhotra et al., 1996) and the arm/inter-arm contrast is larger in the \HyColor@XZeroOneThreeFour\pc@goptd@color\pc@hyenc@colorpdfcommentcolor\HyColor@XZeroOneThreeFour\pc@goptd@fontcolor\pc@hyenc@fontcolorpdfcommentcolor\HyColor@XZeroOneThreeFour\pc@goptd@icolor\pc@hyenc@icolorpdfcommentcolor\pdfmark[MIR]pdfmark=/ANN,Subtype=/Widget,Raw=/TU (Mid-infrared\textCR(\pc@goptd@deadline)) /T (tooltip zref@32) /C [ ] /FT/Btn /F 768 /Ff 65536 /H/N /BS ¡¡ /W 0 ¿¿ than in the optical (Vogler et al., 2005). From a large range of morphologies, Roussel et al. (2001) also found that if the IR-to-optical size ratio does not seem to be affected by the presence of a bar, this ratio is, on the contrary, particularly reduced in H i-deficient galaxies or early-type galaxies (see also Bendo et al., 2002). Numerous analysis have shown that the \HyColor@XZeroOneThreeFour\pc@goptd@color\pc@hyenc@colorpdfcommentcolor\HyColor@XZeroOneThreeFour\pc@goptd@fontcolor\pc@hyenc@fontcolorpdfcommentcolor\HyColor@XZeroOneThreeFour\pc@goptd@icolor\pc@hyenc@icolorpdfcommentcolor\pdfmark[MIR]pdfmark=/ANN,Subtype=/Widget,Raw=/TU (Mid-infrared\textCR(\pc@goptd@deadline)) /T (tooltip zref@33) /C [ ] /FT/Btn /F 768 /Ff 65536 /H/N /BS ¡¡ /W 0 ¿¿ disk has a similar scale-length to that of 12CO(10), H or the radio continuum (Sauvage et al., 1996; Walsh et al., 2002; Vogler et al., 2005). The relation with H, in particular, indicates that the \HyColor@XZeroOneThreeFour\pc@goptd@color\pc@hyenc@colorpdfcommentcolor\HyColor@XZeroOneThreeFour\pc@goptd@fontcolor\pc@hyenc@fontcolorpdfcommentcolor\HyColor@XZeroOneThreeFour\pc@goptd@icolor\pc@hyenc@icolorpdfcommentcolor\pdfmark[MIR]pdfmark=/ANN,Subtype=/Widget,Raw=/TU (Mid-infrared\textCR(\pc@goptd@deadline)) /T (tooltip zref@34) /C [ ] /FT/Btn /F 768 /Ff 65536 /H/N /BS ¡¡ /W 0 ¿¿ scale-length of a galaxy is determined by its star-forming activity. Indeed, the \HyColor@XZeroOneThreeFour\pc@goptd@color\pc@hyenc@colorpdfcommentcolor\HyColor@XZeroOneThreeFour\pc@goptd@fontcolor\pc@hyenc@fontcolorpdfcommentcolor\HyColor@XZeroOneThreeFour\pc@goptd@icolor\pc@hyenc@icolorpdfcommentcolor\pdfmark[MIR]pdfmark=/ANN,Subtype=/Widget,Raw=/TU (Mid-infrared\textCR(\pc@goptd@deadline)) /T (tooltip zref@35) /C [ ] /FT/Btn /F 768 /Ff 65536 /H/N /BS ¡¡ /W 0 ¿¿ emission is enhanced in star forming regions. With \HyColor@XZeroOneThreeFour\pc@goptd@color\pc@hyenc@colorpdfcommentcolor\HyColor@XZeroOneThreeFour\pc@goptd@fontcolor\pc@hyenc@fontcolorpdfcommentcolor\HyColor@XZeroOneThreeFour\pc@goptd@icolor\pc@hyenc@icolorpdfcommentcolor\pdfmark[Spitzer]pdfmark=/ANN,Subtype=/Widget,Raw=/TU (Spitzer space telescope (3-160 microns; 2003-2009)\textCR(\pc@goptd@deadline)) /T (tooltip zref@36) /C [ ] /FT/Btn /F 768 /Ff 65536 /H/N /BS ¡¡ /W 0 ¿¿ , the improved sensitivity and spatial resolution opened a new frame to model the distribution of dust inside galaxies and in particular to derive radial profiles. \HyColor@XZeroOneThreeFour\pc@goptd@color\pc@hyenc@colorpdfcommentcolor\HyColor@XZeroOneThreeFour\pc@goptd@fontcolor\pc@hyenc@fontcolorpdfcommentcolor\HyColor@XZeroOneThreeFour\pc@goptd@icolor\pc@hyenc@icolorpdfcommentcolor\pdfmark[Spitzer]pdfmark=/ANN,Subtype=/Widget,Raw=/TU (Spitzer space telescope (3-160 microns; 2003-2009)\textCR(\pc@goptd@deadline)) /T (tooltip zref@37) /C [ ] /FT/Btn /F 768 /Ff 65536 /H/N /BS ¡¡ /W 0 ¿¿ confirmed that the concentration index varies with wavelength. Studying radial profiles of 75 nearby galaxies, Muñoz-Mateos et al. (2009b) found that the concentration indices drop in the \HyColor@XZeroOneThreeFour\pc@goptd@color\pc@hyenc@colorpdfcommentcolor\HyColor@XZeroOneThreeFour\pc@goptd@fontcolor\pc@hyenc@fontcolorpdfcommentcolor\HyColor@XZeroOneThreeFour\pc@goptd@icolor\pc@hyenc@icolorpdfcommentcolor\pdfmark[UIB]pdfmark=/ANN,Subtype=/Widget,Raw=/TU (Unidentified infrared band\textCR(\pc@goptd@deadline)) /T (tooltip zref@38) /C [ ] /FT/Btn /F 768 /Ff 65536 /H/N /BS ¡¡ /W 0 ¿¿ s (5.8 and ; Section 6.1.2). The \HyColor@XZeroOneThreeFour\pc@goptd@color\pc@hyenc@colorpdfcommentcolor\HyColor@XZeroOneThreeFour\pc@goptd@fontcolor\pc@hyenc@fontcolorpdfcommentcolor\HyColor@XZeroOneThreeFour\pc@goptd@icolor\pc@hyenc@icolorpdfcommentcolor\pdfmark[MIR]pdfmark=/ANN,Subtype=/Widget,Raw=/TU (Mid-infrared\textCR(\pc@goptd@deadline)) /T (tooltip zref@39) /C [ ] /FT/Btn /F 768 /Ff 65536 /H/N /BS ¡¡ /W 0 ¿¿ observations at longer wavelengths rather indicate a large variety of behaviours, including galaxies with very intense nuclear, circumnuclear or outer ring emission, thus larger concentration indices (e.g. NGC 1291, NGC 1512, NGC 1097, NGC 3351). ††margin: \entry ISOInfrared Space Observatory (; ) \entryConcentration indexratio between radii along the major axis encompassing 75 and of the total flux of a galaxy. \entrySpitzerspace telescope (; ). \entryUIBUnidentified Infrared Bands (cf. Section 6.1.2). Prominent \HyColor@XZeroOneThreeFour\pc@goptd@color\pc@hyenc@colorpdfcommentcolor\HyColor@XZeroOneThreeFour\pc@goptd@fontcolor\pc@hyenc@fontcolorpdfcommentcolor\HyColor@XZeroOneThreeFour\pc@goptd@icolor\pc@hyenc@icolorpdfcommentcolor\pdfmark[MIR]pdfmark=/ANN,Subtype=/Widget,Raw=/TU (Mid-infrared\textCR(\pc@goptd@deadline)) /T (tooltip zref@40) /C [ ] /FT/Btn /F 768 /Ff 65536 /H/N /BS ¡¡ /W 0 ¿¿ features (Figure 1), attributed to carbonaceous grains.
3.1.1.2 FIR/submm dust scale-length
From \HyColor@XZeroOneThreeFour\pc@goptd@color\pc@hyenc@colorpdfcommentcolor\HyColor@XZeroOneThreeFour\pc@goptd@fontcolor\pc@hyenc@fontcolorpdfcommentcolor\HyColor@XZeroOneThreeFour\pc@goptd@icolor\pc@hyenc@icolorpdfcommentcolor\pdfmark[ISO]pdfmark=/ANN,Subtype=/Widget,Raw=/TU (Infrared Space Telescope (5-210 microns; 1995-1998)\textCR(\pc@goptd@deadline)) /T (tooltip zref@41) /C [ ] /FT/Btn /F 768 /Ff 65536 /H/N /BS ¡¡ /W 0 ¿¿ observations, it quickly became clear that the disk scale-length of the \HyColor@XZeroOneThreeFour\pc@goptd@color\pc@hyenc@colorpdfcommentcolor\HyColor@XZeroOneThreeFour\pc@goptd@fontcolor\pc@hyenc@fontcolorpdfcommentcolor\HyColor@XZeroOneThreeFour\pc@goptd@icolor\pc@hyenc@icolorpdfcommentcolor\pdfmark[IR]pdfmark=/ANN,Subtype=/Widget,Raw=/TU (Infrared\textCR(\pc@goptd@deadline)) /T (tooltip zref@42) /C [ ] /FT/Btn /F 768 /Ff 65536 /H/N /BS ¡¡ /W 0 ¿¿ emission increases with wavelength (Hippelein et al., 2003), with a Far-\HyColor@XZeroOneThreeFour\pc@goptd@color\pc@hyenc@colorpdfcommentcolor\HyColor@XZeroOneThreeFour\pc@goptd@fontcolor\pc@hyenc@fontcolorpdfcommentcolor\HyColor@XZeroOneThreeFour\pc@goptd@icolor\pc@hyenc@icolorpdfcommentcolor\pdfmark[IR]pdfmark=/ANN,Subtype=/Widget,Raw=/TU (Infrared\textCR(\pc@goptd@deadline)) /T (tooltip zref@43) /C [ ] /FT/Btn /F 768 /Ff 65536 /H/N /BS ¡¡ /W 0 ¿¿ (\HyColor@XZeroOneThreeFour\pc@goptd@color\pc@hyenc@colorpdfcommentcolor\HyColor@XZeroOneThreeFour\pc@goptd@fontcolor\pc@hyenc@fontcolorpdfcommentcolor\HyColor@XZeroOneThreeFour\pc@goptd@icolor\pc@hyenc@icolorpdfcommentcolor\pdfmark[FIR]pdfmark=/ANN,Subtype=/Widget,Raw=/TU (Far-infrared\textCR(\pc@goptd@deadline)) /T (tooltip zref@44) /C [ ] /FT/Btn /F 768 /Ff 65536 /H/N /BS ¡¡ /W 0 ¿¿ ) scale-length larger than the optical scale-length (Tuffs et al., 1996; Alton et al., 1998; Haas et al., 1998; Davies et al., 1999; Trewhella et al., 2000). This \HyColor@XZeroOneThreeFour\pc@goptd@color\pc@hyenc@colorpdfcommentcolor\HyColor@XZeroOneThreeFour\pc@goptd@fontcolor\pc@hyenc@fontcolorpdfcommentcolor\HyColor@XZeroOneThreeFour\pc@goptd@icolor\pc@hyenc@icolorpdfcommentcolor\pdfmark[FIR]pdfmark=/ANN,Subtype=/Widget,Raw=/TU (Far-infrared\textCR(\pc@goptd@deadline)) /T (tooltip zref@45) /C [ ] /FT/Btn /F 768 /Ff 65536 /H/N /BS ¡¡ /W 0 ¿¿ colour gradient observed in the disk suggests that part of the \HyColor@XZeroOneThreeFour\pc@goptd@color\pc@hyenc@colorpdfcommentcolor\HyColor@XZeroOneThreeFour\pc@goptd@fontcolor\pc@hyenc@fontcolorpdfcommentcolor\HyColor@XZeroOneThreeFour\pc@goptd@icolor\pc@hyenc@icolorpdfcommentcolor\pdfmark[FIR]pdfmark=/ANN,Subtype=/Widget,Raw=/TU (Far-infrared\textCR(\pc@goptd@deadline)) /T (tooltip zref@46) /C [ ] /FT/Btn /F 768 /Ff 65536 /H/N /BS ¡¡ /W 0 ¿¿ emission arises from grains heated by the radially decreasing diffuse InterStellar Radiation Field (\HyColor@XZeroOneThreeFour\pc@goptd@color\pc@hyenc@colorpdfcommentcolor\HyColor@XZeroOneThreeFour\pc@goptd@fontcolor\pc@hyenc@fontcolorpdfcommentcolor\HyColor@XZeroOneThreeFour\pc@goptd@icolor\pc@hyenc@icolorpdfcommentcolor\pdfmark[ISRF]pdfmark=/ANN,Subtype=/Widget,Raw=/TU (Interstellar radiation field\textCR(\pc@goptd@deadline)) /T (tooltip zref@47) /C [ ] /FT/Btn /F 768 /Ff 65536 /H/N /BS ¡¡ /W 0 ¿¿ ). In the edge-on spiral galaxy NGC 891, Popescu & Tuffs (2003) showed that large amounts of \HyColor@XZeroOneThreeFour\pc@goptd@color\pc@hyenc@colorpdfcommentcolor\HyColor@XZeroOneThreeFour\pc@goptd@fontcolor\pc@hyenc@fontcolorpdfcommentcolor\HyColor@XZeroOneThreeFour\pc@goptd@icolor\pc@hyenc@icolorpdfcommentcolor\pdfmark[FIR]pdfmark=/ANN,Subtype=/Widget,Raw=/TU (Far-infrared\textCR(\pc@goptd@deadline)) /T (tooltip zref@48) /C [ ] /FT/Btn /F 768 /Ff 65536 /H/N /BS ¡¡ /W 0 ¿¿ emission was associated to the extended H i disk, raising the question of whether grains are transported from the inner/optical disk, transferred via interactions or more resistant to destruction by shocks in the outer disk. \HyColor@XZeroOneThreeFour\pc@goptd@color\pc@hyenc@colorpdfcommentcolor\HyColor@XZeroOneThreeFour\pc@goptd@fontcolor\pc@hyenc@fontcolorpdfcommentcolor\HyColor@XZeroOneThreeFour\pc@goptd@icolor\pc@hyenc@icolorpdfcommentcolor\pdfmark[Spitzer]pdfmark=/ANN,Subtype=/Widget,Raw=/TU (Spitzer space telescope (3-160 microns; 2003-2009)\textCR(\pc@goptd@deadline)) /T (tooltip zref@49) /C [ ] /FT/Btn /F 768 /Ff 65536 /H/N /BS ¡¡ /W 0 ¿¿ , \HyColor@XZeroOneThreeFour\pc@goptd@color\pc@hyenc@colorpdfcommentcolor\HyColor@XZeroOneThreeFour\pc@goptd@fontcolor\pc@hyenc@fontcolorpdfcommentcolor\HyColor@XZeroOneThreeFour\pc@goptd@icolor\pc@hyenc@icolorpdfcommentcolor\pdfmark[Herschel]pdfmark=/ANN,Subtype=/Widget,Raw=/TU (Herschel space observatory (55-672 microns; 2009-2013)\textCR(\pc@goptd@deadline)) /T (tooltip zref@50) /C [ ] /FT/Btn /F 768 /Ff 65536 /H/N /BS ¡¡ /W 0 ¿¿ , as well as plane or ground-based \HyColor@XZeroOneThreeFour\pc@goptd@color\pc@hyenc@colorpdfcommentcolor\HyColor@XZeroOneThreeFour\pc@goptd@fontcolor\pc@hyenc@fontcolorpdfcommentcolor\HyColor@XZeroOneThreeFour\pc@goptd@icolor\pc@hyenc@icolorpdfcommentcolor\pdfmark[submm]pdfmark=/ANN,Subtype=/Widget,Raw=/TU (Submillimeter\textCR(\pc@goptd@deadline)) /T (tooltip zref@51) /C [ ] /FT/Btn /F 768 /Ff 65536 /H/N /BS ¡¡ /W 0 ¿¿ instruments have since then revolutionised our vision of the \HyColor@XZeroOneThreeFour\pc@goptd@color\pc@hyenc@colorpdfcommentcolor\HyColor@XZeroOneThreeFour\pc@goptd@fontcolor\pc@hyenc@fontcolorpdfcommentcolor\HyColor@XZeroOneThreeFour\pc@goptd@icolor\pc@hyenc@icolorpdfcommentcolor\pdfmark[FIR]pdfmark=/ANN,Subtype=/Widget,Raw=/TU (Far-infrared\textCR(\pc@goptd@deadline)) /T (tooltip zref@52) /C [ ] /FT/Btn /F 768 /Ff 65536 /H/N /BS ¡¡ /W 0 ¿¿ /\HyColor@XZeroOneThreeFour\pc@goptd@color\pc@hyenc@colorpdfcommentcolor\HyColor@XZeroOneThreeFour\pc@goptd@fontcolor\pc@hyenc@fontcolorpdfcommentcolor\HyColor@XZeroOneThreeFour\pc@goptd@icolor\pc@hyenc@icolorpdfcommentcolor\pdfmark[submm]pdfmark=/ANN,Subtype=/Widget,Raw=/TU (Submillimeter\textCR(\pc@goptd@deadline)) /T (tooltip zref@53) /C [ ] /FT/Btn /F 768 /Ff 65536 /H/N /BS ¡¡ /W 0 ¿¿ emission and particularly confirm the detection of large cold extended disks (Block et al., 1994; Stevens, Amure & Gear, 2005; Hinz et al., 2012). In M 51, the scale-length of the underlying exponential disk was estimated as kpc (Meijerink et al., 2005). More statistically, Muñoz-Mateos et al. (2009a) and Hunt et al. (2015) examined the exponential dust profiles of nearby galaxies. They showed that the \HyColor@XZeroOneThreeFour\pc@goptd@color\pc@hyenc@colorpdfcommentcolor\HyColor@XZeroOneThreeFour\pc@goptd@fontcolor\pc@hyenc@fontcolorpdfcommentcolor\HyColor@XZeroOneThreeFour\pc@goptd@icolor\pc@hyenc@icolorpdfcommentcolor\pdfmark[FIR]pdfmark=/ANN,Subtype=/Widget,Raw=/TU (Far-infrared\textCR(\pc@goptd@deadline)) /T (tooltip zref@54) /C [ ] /FT/Btn /F 768 /Ff 65536 /H/N /BS ¡¡ /W 0 ¿¿ scale-length does not vary strongly with galaxy type and is on average larger than stellar scale-lengths. ††margin: \entry Herschelspace observatory (; ).
3.1.1.3 Scale-height Studies
In the Galaxy, a scale-height of the order of 100 pc has been estimated using \HyColor@XZeroOneThreeFour\pc@goptd@color\pc@hyenc@colorpdfcommentcolor\HyColor@XZeroOneThreeFour\pc@goptd@fontcolor\pc@hyenc@fontcolorpdfcommentcolor\HyColor@XZeroOneThreeFour\pc@goptd@icolor\pc@hyenc@icolorpdfcommentcolor\pdfmark[IRAS]pdfmark=/ANN,Subtype=/Widget,Raw=/TU (Infrared astronomical satellite (12-100 microns; 1983)\textCR(\pc@goptd@deadline)) /T (tooltip zref@55) /C [ ] /FT/Btn /F 768 /Ff 65536 /H/N /BS ¡¡ /W 0 ¿¿ observations at , with a vertical distribution that correlates with the distribution of the H i gas (Boulanger & Perault, 1988). Davies et al. (1997) extended the analysis to the colder dust phase using \HyColor@XZeroOneThreeFour\pc@goptd@color\pc@hyenc@colorpdfcommentcolor\HyColor@XZeroOneThreeFour\pc@goptd@fontcolor\pc@hyenc@fontcolorpdfcommentcolor\HyColor@XZeroOneThreeFour\pc@goptd@icolor\pc@hyenc@icolorpdfcommentcolor\pdfmark[COBE]pdfmark=/ANN,Subtype=/Widget,Raw=/TU (Cosmic Background Explorer (12-5000 microns; 1989-1993)\textCR(\pc@goptd@deadline)) /T (tooltip zref@56) /C [ ] /FT/Btn /F 768 /Ff 65536 /H/N /BS ¡¡ /W 0 ¿¿ data and found a more diffuse 20 K dust component, with a cold dust scale-height of about pc (Davies et al., 1997). Outside our \HyColor@XZeroOneThreeFour\pc@goptd@color\pc@hyenc@colorpdfcommentcolor\HyColor@XZeroOneThreeFour\pc@goptd@fontcolor\pc@hyenc@fontcolorpdfcommentcolor\HyColor@XZeroOneThreeFour\pc@goptd@icolor\pc@hyenc@icolorpdfcommentcolor\pdfmark[MW]pdfmark=/ANN,Subtype=/Widget,Raw=/TU (Milky Way\textCR(\pc@goptd@deadline)) /T (tooltip zref@57) /C [ ] /FT/Btn /F 768 /Ff 65536 /H/N /BS ¡¡ /W 0 ¿¿ , edge-on galaxies are ideal objects to constrain this parameter. Xilouris et al. (1999) studied the stellar and dust disks in five of these edge-on late-type spirals and found that their mean optical-to-dust scale-height ratio was . This ratio is often used as an a priori assumption for disk models (Tempel, Tamm & Tenjes, 2010). Quantifying the dust scale-height is undoubtedly more difficult for face-on galaxies. Padoan et al. (2001) proposed a new method to measure the average scale-height in face-on disk galaxies. From the H i data in the Large Magellanic Cloud (\HyColor@XZeroOneThreeFour\pc@goptd@color\pc@hyenc@colorpdfcommentcolor\HyColor@XZeroOneThreeFour\pc@goptd@fontcolor\pc@hyenc@fontcolorpdfcommentcolor\HyColor@XZeroOneThreeFour\pc@goptd@icolor\pc@hyenc@icolorpdfcommentcolor\pdfmark[LMC]pdfmark=/ANN,Subtype=/Widget,Raw=/TU (Large Magellanic cloud\textCR(\pc@goptd@deadline)) /T (tooltip zref@58) /C [ ] /FT/Btn /F 768 /Ff 65536 /H/N /BS ¡¡ /W 0 ¿¿ ), they interpreted the break in the power-law shape of the spectral correlation function as the boundary of the gas mass distribution and velocity field. The method has been since then applied to derive scale-height estimates of the warm and cold dust. In the \HyColor@XZeroOneThreeFour\pc@goptd@color\pc@hyenc@colorpdfcommentcolor\HyColor@XZeroOneThreeFour\pc@goptd@fontcolor\pc@hyenc@fontcolorpdfcommentcolor\HyColor@XZeroOneThreeFour\pc@goptd@icolor\pc@hyenc@icolorpdfcommentcolor\pdfmark[LMC]pdfmark=/ANN,Subtype=/Widget,Raw=/TU (Large Magellanic cloud\textCR(\pc@goptd@deadline)) /T (tooltip zref@59) /C [ ] /FT/Btn /F 768 /Ff 65536 /H/N /BS ¡¡ /W 0 ¿¿ , Block et al. (2010) found that the break in the power spectrum is occurring on scales of pc in the \HyColor@XZeroOneThreeFour\pc@goptd@color\pc@hyenc@colorpdfcommentcolor\HyColor@XZeroOneThreeFour\pc@goptd@fontcolor\pc@hyenc@fontcolorpdfcommentcolor\HyColor@XZeroOneThreeFour\pc@goptd@icolor\pc@hyenc@icolorpdfcommentcolor\pdfmark[FIR]pdfmark=/ANN,Subtype=/Widget,Raw=/TU (Far-infrared\textCR(\pc@goptd@deadline)) /T (tooltip zref@60) /C [ ] /FT/Btn /F 768 /Ff 65536 /H/N /BS ¡¡ /W 0 ¿¿ . Combes et al. (2012) found similar scale-heights in M 33. The technique is limited by the resolution of the observations: artificial breaks can appear when the scale-height is too close to the resolution scale. Finally, radiative transfer codes are robust tools to model the absorption and re-emission by dust and derive structural parameters (cf. Section 3.2). The model of Baes et al. (2003), for instance, has been used to derive scale-lengths and scale-heights in edge-on galaxies (De Looze et al., 2012a; De Geyter et al., 2015; Viaene et al., 2015). The scale-heights derived in these studies typically range from to 200 pc.
3.1.2 The Dust Distribution in Irregular Galaxies
Irregular galaxies can contain large amounts of atomic gas that typically extend to twice their Holmberg radius (e.g. Huchtmeier, Seiradakis & Materne, 1981). They are also rich in dust, with very similar optical and \HyColor@XZeroOneThreeFour\pc@goptd@color\pc@hyenc@colorpdfcommentcolor\HyColor@XZeroOneThreeFour\pc@goptd@fontcolor\pc@hyenc@fontcolorpdfcommentcolor\HyColor@XZeroOneThreeFour\pc@goptd@icolor\pc@hyenc@icolorpdfcommentcolor\pdfmark[MIR]pdfmark=/ANN,Subtype=/Widget,Raw=/TU (Mid-infrared\textCR(\pc@goptd@deadline)) /T (tooltip zref@61) /C [ ] /FT/Btn /F 768 /Ff 65536 /H/N /BS ¡¡ /W 0 ¿¿ scale lengths (Hunter, Elmegreen & Martin, 2006). The dust emission in irregular galaxies is clumpy and warm, with a hot dust and \HyColor@XZeroOneThreeFour\pc@goptd@color\pc@hyenc@colorpdfcommentcolor\HyColor@XZeroOneThreeFour\pc@goptd@fontcolor\pc@hyenc@fontcolorpdfcommentcolor\HyColor@XZeroOneThreeFour\pc@goptd@icolor\pc@hyenc@icolorpdfcommentcolor\pdfmark[UIB]pdfmark=/ANN,Subtype=/Widget,Raw=/TU (Unidentified infrared band\textCR(\pc@goptd@deadline)) /T (tooltip zref@62) /C [ ] /FT/Btn /F 768 /Ff 65536 /H/N /BS ¡¡ /W 0 ¿¿ emission mostly observed towards bright H ii regions. This suggests that massive stars are a major source of heating in these environments (e.g. Hunter, Elmegreen & Martin, 2006).
3.1.3 The Dust Distribution in Dwarf Galaxies
One of the main characteristics of dwarf galaxies is their low metallicity (\HyColor@XZeroOneThreeFour\pc@goptd@color\pc@hyenc@colorpdfcommentcolor\HyColor@XZeroOneThreeFour\pc@goptd@fontcolor\pc@hyenc@fontcolorpdfcommentcolor\HyColor@XZeroOneThreeFour\pc@goptd@icolor\pc@hyenc@icolorpdfcommentcolor\pdfmark[]pdfmark=/ANN,Subtype=/Widget,Raw=/TU (Metallicity\textCR(\pc@goptd@deadline)) /T (tooltip zref@63) /C [ ] /FT/Btn /F 768 /Ff 65536 /H/N /BS ¡¡ /W 0 ¿¿ ). As we will see in Section 9.3.2, the dust-to-gas ratio scales roughly with \HyColor@XZeroOneThreeFour\pc@goptd@color\pc@hyenc@colorpdfcommentcolor\HyColor@XZeroOneThreeFour\pc@goptd@fontcolor\pc@hyenc@fontcolorpdfcommentcolor\HyColor@XZeroOneThreeFour\pc@goptd@icolor\pc@hyenc@icolorpdfcommentcolor\pdfmark[]pdfmark=/ANN,Subtype=/Widget,Raw=/TU (Metallicity\textCR(\pc@goptd@deadline)) /T (tooltip zref@64) /C [ ] /FT/Btn /F 768 /Ff 65536 /H/N /BS ¡¡ /W 0 ¿¿ . The \HyColor@XZeroOneThreeFour\pc@goptd@color\pc@hyenc@colorpdfcommentcolor\HyColor@XZeroOneThreeFour\pc@goptd@fontcolor\pc@hyenc@fontcolorpdfcommentcolor\HyColor@XZeroOneThreeFour\pc@goptd@icolor\pc@hyenc@icolorpdfcommentcolor\pdfmark[ISM]pdfmark=/ANN,Subtype=/Widget,Raw=/TU (Interstellar medium\textCR(\pc@goptd@deadline)) /T (tooltip zref@65) /C [ ] /FT/Btn /F 768 /Ff 65536 /H/N /BS ¡¡ /W 0 ¿¿ in these objects is less dusty and thus, more transparent. Similarly to irregular galaxies, massive stars are a major source of heating in these objects (e.g. Walter et al., 2007), and they are permeated by SuperNova (\HyColor@XZeroOneThreeFour\pc@goptd@color\pc@hyenc@colorpdfcommentcolor\HyColor@XZeroOneThreeFour\pc@goptd@fontcolor\pc@hyenc@fontcolorpdfcommentcolor\HyColor@XZeroOneThreeFour\pc@goptd@icolor\pc@hyenc@icolorpdfcommentcolor\pdfmark[SN]pdfmark=/ANN,Subtype=/Widget,Raw=/TU (Supernova\textCR(\pc@goptd@deadline)) /T (tooltip zref@66) /C [ ] /FT/Btn /F 768 /Ff 65536 /H/N /BS ¡¡ /W 0 ¿¿ )-triggered shock waves (e.g. Oey, 1996). Finally, these galaxies exhibit large H i envelopes. The \HyColor@XZeroOneThreeFour\pc@goptd@color\pc@hyenc@colorpdfcommentcolor\HyColor@XZeroOneThreeFour\pc@goptd@fontcolor\pc@hyenc@fontcolorpdfcommentcolor\HyColor@XZeroOneThreeFour\pc@goptd@icolor\pc@hyenc@icolorpdfcommentcolor\pdfmark[IR]pdfmark=/ANN,Subtype=/Widget,Raw=/TU (Infrared\textCR(\pc@goptd@deadline)) /T (tooltip zref@67) /C [ ] /FT/Btn /F 768 /Ff 65536 /H/N /BS ¡¡ /W 0 ¿¿ emitting region can correspond to only of the total mass of the system (e.g. Walter et al., 2007).
3.1.4 The Dust Distribution in Elliptical Galaxies
Elliptical galaxies possess very little dust: the average dust-to-stellar mass ratio is times lower than that of spiral galaxies (Smith et al., 2012). Dust-lanes are, however, commonly detected in elliptical galaxies (Sadler & Gerhard, 1985). Jura et al. (1987) for instance found that half of nearby ellipticals are detected at \HyColor@XZeroOneThreeFour\pc@goptd@color\pc@hyenc@colorpdfcommentcolor\HyColor@XZeroOneThreeFour\pc@goptd@fontcolor\pc@hyenc@fontcolorpdfcommentcolor\HyColor@XZeroOneThreeFour\pc@goptd@icolor\pc@hyenc@icolorpdfcommentcolor\pdfmark[IRAS]pdfmark=/ANN,Subtype=/Widget,Raw=/TU (Infrared astronomical satellite (12-100 microns; 1983)\textCR(\pc@goptd@deadline)) /T (tooltip zref@68) /C [ ] /FT/Btn /F 768 /Ff 65536 /H/N /BS ¡¡ /W 0 ¿¿ wavelengths. (Smith et al., 2012) found that the elliptical galaxies detected at tend to have higher X-ray luminosities. Their dust may be heated in part by electron collisions (Goudfrooij & de Jong, 1995). ††margin: \entry IRASInfraRed Astronomical Satellite (; 1983).
3.1.5 The Dust Distribution in Galactic Superwinds
Dust at high latitudes or in galactic haloes can be explained as resulting from various mechanisms, among which stellar feedback, transport via cosmic-ray driven winds or radiation pressure on the grains (Bocchio et al., 2016). The latter mechanism could also partly contribute to drive the galactic superwinds in star-forming galaxies even if several studies have shown that it is insufficient to be the only mechanism (Hopkins, Quataert & Murray, 2012; Contursi et al., 2013). Contursi et al. (2013) showed that, in the outflow of M 82, dust is slower than the ionized and molecular gas, indicating that dust grains are kinematically decoupled from the gas in the superwind. Most of this dust is not fast enough to escape and may fall back into the galaxy disk.
3.1.6 Dust Heating Sources Probed With Infrared Colours
Dust emits in the \HyColor@XZeroOneThreeFour\pc@goptd@color\pc@hyenc@colorpdfcommentcolor\HyColor@XZeroOneThreeFour\pc@goptd@fontcolor\pc@hyenc@fontcolorpdfcommentcolor\HyColor@XZeroOneThreeFour\pc@goptd@icolor\pc@hyenc@icolorpdfcommentcolor\pdfmark[IR]pdfmark=/ANN,Subtype=/Widget,Raw=/TU (Infrared\textCR(\pc@goptd@deadline)) /T (tooltip zref@69) /C [ ] /FT/Btn /F 768 /Ff 65536 /H/N /BS ¡¡ /W 0 ¿¿ –\HyColor@XZeroOneThreeFour\pc@goptd@color\pc@hyenc@colorpdfcommentcolor\HyColor@XZeroOneThreeFour\pc@goptd@fontcolor\pc@hyenc@fontcolorpdfcommentcolor\HyColor@XZeroOneThreeFour\pc@goptd@icolor\pc@hyenc@icolorpdfcommentcolor\pdfmark[submm]pdfmark=/ANN,Subtype=/Widget,Raw=/TU (Submillimeter\textCR(\pc@goptd@deadline)) /T (tooltip zref@70) /C [ ] /FT/Btn /F 768 /Ff 65536 /H/N /BS ¡¡ /W 0 ¿¿ . In this regime, the ratio of two fluxes (or colour) provides information on the grains, the same way optical colours provide information on the stars. These colours are widely used to understand the sources of heating of \HyColor@XZeroOneThreeFour\pc@goptd@color\pc@hyenc@colorpdfcommentcolor\HyColor@XZeroOneThreeFour\pc@goptd@fontcolor\pc@hyenc@fontcolorpdfcommentcolor\HyColor@XZeroOneThreeFour\pc@goptd@icolor\pc@hyenc@icolorpdfcommentcolor\pdfmark[ISM]pdfmark=/ANN,Subtype=/Widget,Raw=/TU (Interstellar medium\textCR(\pc@goptd@deadline)) /T (tooltip zref@71) /C [ ] /FT/Btn /F 768 /Ff 65536 /H/N /BS ¡¡ /W 0 ¿¿ dust. From \HyColor@XZeroOneThreeFour\pc@goptd@color\pc@hyenc@colorpdfcommentcolor\HyColor@XZeroOneThreeFour\pc@goptd@fontcolor\pc@hyenc@fontcolorpdfcommentcolor\HyColor@XZeroOneThreeFour\pc@goptd@icolor\pc@hyenc@icolorpdfcommentcolor\pdfmark[IRAS]pdfmark=/ANN,Subtype=/Widget,Raw=/TU (Infrared astronomical satellite (12-100 microns; 1983)\textCR(\pc@goptd@deadline)) /T (tooltip zref@72) /C [ ] /FT/Btn /F 768 /Ff 65536 /H/N /BS ¡¡ /W 0 ¿¿ observations, Lonsdale Persson & Helou (1987) were among the first ones to use the correlation of the \HyColor@XZeroOneThreeFour\pc@goptd@color\pc@hyenc@colorpdfcommentcolor\HyColor@XZeroOneThreeFour\pc@goptd@fontcolor\pc@hyenc@fontcolorpdfcommentcolor\HyColor@XZeroOneThreeFour\pc@goptd@icolor\pc@hyenc@icolorpdfcommentcolor\pdfmark[]pdfmark=/ANN,Subtype=/Widget,Raw=/TU (Monochromatic luminosity at 60 microns (Lsun/Hz)\textCR(\pc@goptd@deadline)) /T (tooltip zref@73) /C [ ] /FT/Btn /F 768 /Ff 65536 /H/N /BS ¡¡ /W 0 ¿¿ /\HyColor@XZeroOneThreeFour\pc@goptd@color\pc@hyenc@colorpdfcommentcolor\HyColor@XZeroOneThreeFour\pc@goptd@fontcolor\pc@hyenc@fontcolorpdfcommentcolor\HyColor@XZeroOneThreeFour\pc@goptd@icolor\pc@hyenc@icolorpdfcommentcolor\pdfmark[]pdfmark=/ANN,Subtype=/Widget,Raw=/TU (Monochromatic luminosity at 100 microns (Lsun/Hz)\textCR(\pc@goptd@deadline)) /T (tooltip zref@74) /C [ ] /FT/Btn /F 768 /Ff 65536 /H/N /BS ¡¡ /W 0 ¿¿ colour temperature with tracers of the old stars, to study their heating contribution. With \HyColor@XZeroOneThreeFour\pc@goptd@color\pc@hyenc@colorpdfcommentcolor\HyColor@XZeroOneThreeFour\pc@goptd@fontcolor\pc@hyenc@fontcolorpdfcommentcolor\HyColor@XZeroOneThreeFour\pc@goptd@icolor\pc@hyenc@icolorpdfcommentcolor\pdfmark[Spitzer]pdfmark=/ANN,Subtype=/Widget,Raw=/TU (Spitzer space telescope (3-160 microns; 2003-2009)\textCR(\pc@goptd@deadline)) /T (tooltip zref@75) /C [ ] /FT/Btn /F 768 /Ff 65536 /H/N /BS ¡¡ /W 0 ¿¿ observations, global \HyColor@XZeroOneThreeFour\pc@goptd@color\pc@hyenc@colorpdfcommentcolor\HyColor@XZeroOneThreeFour\pc@goptd@fontcolor\pc@hyenc@fontcolorpdfcommentcolor\HyColor@XZeroOneThreeFour\pc@goptd@icolor\pc@hyenc@icolorpdfcommentcolor\pdfmark[]pdfmark=/ANN,Subtype=/Widget,Raw=/TU (Monochromatic luminosity at 8 microns (Lsun/Hz)\textCR(\pc@goptd@deadline)) /T (tooltip zref@76) /C [ ] /FT/Btn /F 768 /Ff 65536 /H/N /BS ¡¡ /W 0 ¿¿ /\HyColor@XZeroOneThreeFour\pc@goptd@color\pc@hyenc@colorpdfcommentcolor\HyColor@XZeroOneThreeFour\pc@goptd@fontcolor\pc@hyenc@fontcolorpdfcommentcolor\HyColor@XZeroOneThreeFour\pc@goptd@icolor\pc@hyenc@icolorpdfcommentcolor\pdfmark[]pdfmark=/ANN,Subtype=/Widget,Raw=/TU (Monochromatic luminosity at 160 microns (Lsun/Hz)\textCR(\pc@goptd@deadline)) /T (tooltip zref@77) /C [ ] /FT/Btn /F 768 /Ff 65536 /H/N /BS ¡¡ /W 0 ¿¿ ratios were then used to probe the origin of the \HyColor@XZeroOneThreeFour\pc@goptd@color\pc@hyenc@colorpdfcommentcolor\HyColor@XZeroOneThreeFour\pc@goptd@fontcolor\pc@hyenc@fontcolorpdfcommentcolor\HyColor@XZeroOneThreeFour\pc@goptd@icolor\pc@hyenc@icolorpdfcommentcolor\pdfmark[UIB]pdfmark=/ANN,Subtype=/Widget,Raw=/TU (Unidentified infrared band\textCR(\pc@goptd@deadline)) /T (tooltip zref@78) /C [ ] /FT/Btn /F 768 /Ff 65536 /H/N /BS ¡¡ /W 0 ¿¿ s (cf. Section 6.1.2) and to show that their emission correlates surprisingly well with that of the diffuse, cold dust (e.g. Bendo et al., 2008). Resolved observations later showed that enhancements in the \HyColor@XZeroOneThreeFour\pc@goptd@color\pc@hyenc@colorpdfcommentcolor\HyColor@XZeroOneThreeFour\pc@goptd@fontcolor\pc@hyenc@fontcolorpdfcommentcolor\HyColor@XZeroOneThreeFour\pc@goptd@icolor\pc@hyenc@icolorpdfcommentcolor\pdfmark[]pdfmark=/ANN,Subtype=/Widget,Raw=/TU (Monochromatic luminosity at 8 microns (Lsun/Hz)\textCR(\pc@goptd@deadline)) /T (tooltip zref@79) /C [ ] /FT/Btn /F 768 /Ff 65536 /H/N /BS ¡¡ /W 0 ¿¿ /\HyColor@XZeroOneThreeFour\pc@goptd@color\pc@hyenc@colorpdfcommentcolor\HyColor@XZeroOneThreeFour\pc@goptd@fontcolor\pc@hyenc@fontcolorpdfcommentcolor\HyColor@XZeroOneThreeFour\pc@goptd@icolor\pc@hyenc@icolorpdfcommentcolor\pdfmark[]pdfmark=/ANN,Subtype=/Widget,Raw=/TU (Monochromatic luminosity at 160 microns (Lsun/Hz)\textCR(\pc@goptd@deadline)) /T (tooltip zref@80) /C [ ] /FT/Btn /F 768 /Ff 65536 /H/N /BS ¡¡ /W 0 ¿¿ ratio are spatially offset relative to the star forming regions, suggesting that the \HyColor@XZeroOneThreeFour\pc@goptd@color\pc@hyenc@colorpdfcommentcolor\HyColor@XZeroOneThreeFour\pc@goptd@fontcolor\pc@hyenc@fontcolorpdfcommentcolor\HyColor@XZeroOneThreeFour\pc@goptd@icolor\pc@hyenc@icolorpdfcommentcolor\pdfmark[UIB]pdfmark=/ANN,Subtype=/Widget,Raw=/TU (Unidentified infrared band\textCR(\pc@goptd@deadline)) /T (tooltip zref@81) /C [ ] /FT/Btn /F 768 /Ff 65536 /H/N /BS ¡¡ /W 0 ¿¿ s could be partly excited by photons leaking out of star forming regions (Jones et al., 2015) by up to (Crocker et al., 2013). ††margin: \entry Monochromatic luminositywe note , the monochromatic luminosity (), at wavelength ().
With the arrival of \HyColor@XZeroOneThreeFour\pc@goptd@color\pc@hyenc@colorpdfcommentcolor\HyColor@XZeroOneThreeFour\pc@goptd@fontcolor\pc@hyenc@fontcolorpdfcommentcolor\HyColor@XZeroOneThreeFour\pc@goptd@icolor\pc@hyenc@icolorpdfcommentcolor\pdfmark[Herschel]pdfmark=/ANN,Subtype=/Widget,Raw=/TU (Herschel space observatory (55-672 microns; 2009-2013)\textCR(\pc@goptd@deadline)) /T (tooltip zref@82) /C [ ] /FT/Btn /F 768 /Ff 65536 /H/N /BS ¡¡ /W 0 ¿¿ , the study was pushed towards longer wavelengths, tracing dust at lower temperatures. \HyColor@XZeroOneThreeFour\pc@goptd@color\pc@hyenc@colorpdfcommentcolor\HyColor@XZeroOneThreeFour\pc@goptd@fontcolor\pc@hyenc@fontcolorpdfcommentcolor\HyColor@XZeroOneThreeFour\pc@goptd@icolor\pc@hyenc@icolorpdfcommentcolor\pdfmark[Herschel]pdfmark=/ANN,Subtype=/Widget,Raw=/TU (Herschel space observatory (55-672 microns; 2009-2013)\textCR(\pc@goptd@deadline)) /T (tooltip zref@83) /C [ ] /FT/Btn /F 768 /Ff 65536 /H/N /BS ¡¡ /W 0 ¿¿ ratios have been extensively correlated with both stellar surface brightnesses and star formation rate tracers. These analyses usually find a strong correlation of the \HyColor@XZeroOneThreeFour\pc@goptd@color\pc@hyenc@colorpdfcommentcolor\HyColor@XZeroOneThreeFour\pc@goptd@fontcolor\pc@hyenc@fontcolorpdfcommentcolor\HyColor@XZeroOneThreeFour\pc@goptd@icolor\pc@hyenc@icolorpdfcommentcolor\pdfmark[]pdfmark=/ANN,Subtype=/Widget,Raw=/TU (Monochromatic luminosity at 250 microns (Lsun/Hz)\textCR(\pc@goptd@deadline)) /T (tooltip zref@84) /C [ ] /FT/Btn /F 768 /Ff 65536 /H/N /BS ¡¡ /W 0 ¿¿ /\HyColor@XZeroOneThreeFour\pc@goptd@color\pc@hyenc@colorpdfcommentcolor\HyColor@XZeroOneThreeFour\pc@goptd@fontcolor\pc@hyenc@fontcolorpdfcommentcolor\HyColor@XZeroOneThreeFour\pc@goptd@icolor\pc@hyenc@icolorpdfcommentcolor\pdfmark[]pdfmark=/ANN,Subtype=/Widget,Raw=/TU (Monochromatic luminosity at 350 microns (Lsun/Hz)\textCR(\pc@goptd@deadline)) /T (tooltip zref@85) /C [ ] /FT/Btn /F 768 /Ff 65536 /H/N /BS ¡¡ /W 0 ¿¿ and \HyColor@XZeroOneThreeFour\pc@goptd@color\pc@hyenc@colorpdfcommentcolor\HyColor@XZeroOneThreeFour\pc@goptd@fontcolor\pc@hyenc@fontcolorpdfcommentcolor\HyColor@XZeroOneThreeFour\pc@goptd@icolor\pc@hyenc@icolorpdfcommentcolor\pdfmark[]pdfmark=/ANN,Subtype=/Widget,Raw=/TU (Monochromatic luminosity at 350 microns (Lsun/Hz)\textCR(\pc@goptd@deadline)) /T (tooltip zref@86) /C [ ] /FT/Btn /F 768 /Ff 65536 /H/N /BS ¡¡ /W 0 ¿¿ /\HyColor@XZeroOneThreeFour\pc@goptd@color\pc@hyenc@colorpdfcommentcolor\HyColor@XZeroOneThreeFour\pc@goptd@fontcolor\pc@hyenc@fontcolorpdfcommentcolor\HyColor@XZeroOneThreeFour\pc@goptd@icolor\pc@hyenc@icolorpdfcommentcolor\pdfmark[]pdfmark=/ANN,Subtype=/Widget,Raw=/TU (Monochromatic luminosity at 500 microns (Lsun/Hz)\textCR(\pc@goptd@deadline)) /T (tooltip zref@87) /C [ ] /FT/Btn /F 768 /Ff 65536 /H/N /BS ¡¡ /W 0 ¿¿ ratios with the local stellar mass, showing the importance of the lower-mass stellar populations as a heating source of the coldest dust population (Bendo et al., 2010; Boquien et al., 2011). By correlating the \HyColor@XZeroOneThreeFour\pc@goptd@color\pc@hyenc@colorpdfcommentcolor\HyColor@XZeroOneThreeFour\pc@goptd@fontcolor\pc@hyenc@fontcolorpdfcommentcolor\HyColor@XZeroOneThreeFour\pc@goptd@icolor\pc@hyenc@icolorpdfcommentcolor\pdfmark[submm]pdfmark=/ANN,Subtype=/Widget,Raw=/TU (Submillimeter\textCR(\pc@goptd@deadline)) /T (tooltip zref@88) /C [ ] /FT/Btn /F 768 /Ff 65536 /H/N /BS ¡¡ /W 0 ¿¿ ratios with a linear combination of tracers of the total stellar population () and of the star forming regions (H), Bendo et al. (2012) could segregate the two different heating sources and found that of the heating of cold dust is assured by lower-mass stars, in disk galaxies. Ratios at shorter wavelength, such as \HyColor@XZeroOneThreeFour\pc@goptd@color\pc@hyenc@colorpdfcommentcolor\HyColor@XZeroOneThreeFour\pc@goptd@fontcolor\pc@hyenc@fontcolorpdfcommentcolor\HyColor@XZeroOneThreeFour\pc@goptd@icolor\pc@hyenc@icolorpdfcommentcolor\pdfmark[]pdfmark=/ANN,Subtype=/Widget,Raw=/TU (Monochromatic luminosity at 70 microns (Lsun/Hz)\textCR(\pc@goptd@deadline)) /T (tooltip zref@89) /C [ ] /FT/Btn /F 768 /Ff 65536 /H/N /BS ¡¡ /W 0 ¿¿ /\HyColor@XZeroOneThreeFour\pc@goptd@color\pc@hyenc@colorpdfcommentcolor\HyColor@XZeroOneThreeFour\pc@goptd@fontcolor\pc@hyenc@fontcolorpdfcommentcolor\HyColor@XZeroOneThreeFour\pc@goptd@icolor\pc@hyenc@icolorpdfcommentcolor\pdfmark[]pdfmark=/ANN,Subtype=/Widget,Raw=/TU (Monochromatic luminosity at 160 microns (Lsun/Hz)\textCR(\pc@goptd@deadline)) /T (tooltip zref@90) /C [ ] /FT/Btn /F 768 /Ff 65536 /H/N /BS ¡¡ /W 0 ¿¿ or \HyColor@XZeroOneThreeFour\pc@goptd@color\pc@hyenc@colorpdfcommentcolor\HyColor@XZeroOneThreeFour\pc@goptd@fontcolor\pc@hyenc@fontcolorpdfcommentcolor\HyColor@XZeroOneThreeFour\pc@goptd@icolor\pc@hyenc@icolorpdfcommentcolor\pdfmark[]pdfmark=/ANN,Subtype=/Widget,Raw=/TU (Monochromatic luminosity at 160 microns (Lsun/Hz)\textCR(\pc@goptd@deadline)) /T (tooltip zref@91) /C [ ] /FT/Btn /F 768 /Ff 65536 /H/N /BS ¡¡ /W 0 ¿¿ /\HyColor@XZeroOneThreeFour\pc@goptd@color\pc@hyenc@colorpdfcommentcolor\HyColor@XZeroOneThreeFour\pc@goptd@fontcolor\pc@hyenc@fontcolorpdfcommentcolor\HyColor@XZeroOneThreeFour\pc@goptd@icolor\pc@hyenc@icolorpdfcommentcolor\pdfmark[]pdfmark=/ANN,Subtype=/Widget,Raw=/TU (Monochromatic luminosity at 250 microns (Lsun/Hz)\textCR(\pc@goptd@deadline)) /T (tooltip zref@92) /C [ ] /FT/Btn /F 768 /Ff 65536 /H/N /BS ¡¡ /W 0 ¿¿ , are less correlated with radius and more strongly correlated with the Star Formation Rate (\HyColor@XZeroOneThreeFour\pc@goptd@color\pc@hyenc@colorpdfcommentcolor\HyColor@XZeroOneThreeFour\pc@goptd@fontcolor\pc@hyenc@fontcolorpdfcommentcolor\HyColor@XZeroOneThreeFour\pc@goptd@icolor\pc@hyenc@icolorpdfcommentcolor\pdfmark[SFR]pdfmark=/ANN,Subtype=/Widget,Raw=/TU (Star formation rate\textCR(\pc@goptd@deadline)) /T (tooltip zref@93) /C [ ] /FT/Btn /F 768 /Ff 65536 /H/N /BS ¡¡ /W 0 ¿¿ ). Boselli et al. (2010) and Boquien et al. (2011) found similar results, showing in particular that the warm dust temperature as measured by the \HyColor@XZeroOneThreeFour\pc@goptd@color\pc@hyenc@colorpdfcommentcolor\HyColor@XZeroOneThreeFour\pc@goptd@fontcolor\pc@hyenc@fontcolorpdfcommentcolor\HyColor@XZeroOneThreeFour\pc@goptd@icolor\pc@hyenc@icolorpdfcommentcolor\pdfmark[]pdfmark=/ANN,Subtype=/Widget,Raw=/TU (Monochromatic luminosity at 60 microns (Lsun/Hz)\textCR(\pc@goptd@deadline)) /T (tooltip zref@94) /C [ ] /FT/Btn /F 768 /Ff 65536 /H/N /BS ¡¡ /W 0 ¿¿ /\HyColor@XZeroOneThreeFour\pc@goptd@color\pc@hyenc@colorpdfcommentcolor\HyColor@XZeroOneThreeFour\pc@goptd@fontcolor\pc@hyenc@fontcolorpdfcommentcolor\HyColor@XZeroOneThreeFour\pc@goptd@icolor\pc@hyenc@icolorpdfcommentcolor\pdfmark[]pdfmark=/ANN,Subtype=/Widget,Raw=/TU (Monochromatic luminosity at 100 microns (Lsun/Hz)\textCR(\pc@goptd@deadline)) /T (tooltip zref@95) /C [ ] /FT/Btn /F 768 /Ff 65536 /H/N /BS ¡¡ /W 0 ¿¿ ratio seems to increase with the birthrate parameter, , whereas the cold dust temperature, (measured by the \HyColor@XZeroOneThreeFour\pc@goptd@color\pc@hyenc@colorpdfcommentcolor\HyColor@XZeroOneThreeFour\pc@goptd@fontcolor\pc@hyenc@fontcolorpdfcommentcolor\HyColor@XZeroOneThreeFour\pc@goptd@icolor\pc@hyenc@icolorpdfcommentcolor\pdfmark[]pdfmark=/ANN,Subtype=/Widget,Raw=/TU (Monochromatic luminosity at 350 microns (Lsun/Hz)\textCR(\pc@goptd@deadline)) /T (tooltip zref@96) /C [ ] /FT/Btn /F 768 /Ff 65536 /H/N /BS ¡¡ /W 0 ¿¿ /\HyColor@XZeroOneThreeFour\pc@goptd@color\pc@hyenc@colorpdfcommentcolor\HyColor@XZeroOneThreeFour\pc@goptd@fontcolor\pc@hyenc@fontcolorpdfcommentcolor\HyColor@XZeroOneThreeFour\pc@goptd@icolor\pc@hyenc@icolorpdfcommentcolor\pdfmark[]pdfmark=/ANN,Subtype=/Widget,Raw=/TU (Monochromatic luminosity at 500 microns (Lsun/Hz)\textCR(\pc@goptd@deadline)) /T (tooltip zref@97) /C [ ] /FT/Btn /F 768 /Ff 65536 /H/N /BS ¡¡ /W 0 ¿¿ ratio) seems to be anti-correlated with . However, the old stellar population probably continues to also play a role in the heating of the warm dust, with a contribution that seems to correlate with the galaxy evolutionary stage (for instance significant global contribution of the bulge stars in early-type galaxies like M 81; Bendo et al., 2012). On the other hand, Rémy-Ruyer et al. (2013) showed a trend of colour temperature with metallicity, suggesting that low-\HyColor@XZeroOneThreeFour\pc@goptd@color\pc@hyenc@colorpdfcommentcolor\HyColor@XZeroOneThreeFour\pc@goptd@fontcolor\pc@hyenc@fontcolorpdfcommentcolor\HyColor@XZeroOneThreeFour\pc@goptd@icolor\pc@hyenc@icolorpdfcommentcolor\pdfmark[]pdfmark=/ANN,Subtype=/Widget,Raw=/TU (Metallicity\textCR(\pc@goptd@deadline)) /T (tooltip zref@98) /C [ ] /FT/Btn /F 768 /Ff 65536 /H/N /BS ¡¡ /W 0 ¿¿ systems are on average hotter (see also Melisse & Israel, 1994). This is conjectured to be due to the enhanced contribution of young star heating at low-\HyColor@XZeroOneThreeFour\pc@goptd@color\pc@hyenc@colorpdfcommentcolor\HyColor@XZeroOneThreeFour\pc@goptd@fontcolor\pc@hyenc@fontcolorpdfcommentcolor\HyColor@XZeroOneThreeFour\pc@goptd@icolor\pc@hyenc@icolorpdfcommentcolor\pdfmark[]pdfmark=/ANN,Subtype=/Widget,Raw=/TU (Metallicity\textCR(\pc@goptd@deadline)) /T (tooltip zref@99) /C [ ] /FT/Btn /F 768 /Ff 65536 /H/N /BS ¡¡ /W 0 ¿¿ . ††margin: \entry Birth rate parametercurrent \HyColor@XZeroOneThreeFour\pc@goptd@color\pc@hyenc@colorpdfcommentcolor\HyColor@XZeroOneThreeFour\pc@goptd@fontcolor\pc@hyenc@fontcolorpdfcommentcolor\HyColor@XZeroOneThreeFour\pc@goptd@icolor\pc@hyenc@icolorpdfcommentcolor\pdfmark[SFR]pdfmark=/ANN,Subtype=/Widget,Raw=/TU (Star formation rate\textCR(\pc@goptd@deadline)) /T (tooltip zref@100) /C [ ] /FT/Btn /F 768 /Ff 65536 /H/N /BS ¡¡ /W 0 ¿¿ divided by the mean \HyColor@XZeroOneThreeFour\pc@goptd@color\pc@hyenc@colorpdfcommentcolor\HyColor@XZeroOneThreeFour\pc@goptd@fontcolor\pc@hyenc@fontcolorpdfcommentcolor\HyColor@XZeroOneThreeFour\pc@goptd@icolor\pc@hyenc@icolorpdfcommentcolor\pdfmark[SFR]pdfmark=/ANN,Subtype=/Widget,Raw=/TU (Star formation rate\textCR(\pc@goptd@deadline)) /T (tooltip zref@101) /C [ ] /FT/Btn /F 768 /Ff 65536 /H/N /BS ¡¡ /W 0 ¿¿ over the lifetime of the galaxy.
New results from radiative transfer models (cf. Section 3.2) are now quantifying better the respective contributions of the different stellar populations to dust heating. In M 31, Viaene et al. (2017) showed that of the dust could be heated by the lower-mass stellar populations (see their Fig. 8). Further detailed analysis would be necessary to quantify more robustly the contribution as a function of the galaxy type.
3.2 The Radiative Transfer Approach
[h]
4 WHAT ARE THE SPATIAL SCALES RELEVANT TO DUST HEATING?
The dust physical conditions vary on spatial scales of the order of the mean free path of a \HyColor@XZeroOneThreeFour\pc@goptd@color\pc@hyenc@colorpdfcommentcolor\HyColor@XZeroOneThreeFour\pc@goptd@fontcolor\pc@hyenc@fontcolorpdfcommentcolor\HyColor@XZeroOneThreeFour\pc@goptd@icolor\pc@hyenc@icolorpdfcommentcolor\pdfmark[-band]pdfmark=/ANN,Subtype=/Widget,Raw=/TU (560 nm\textCR(\pc@goptd@deadline)) /T (tooltip zref@102) /C [ ] /FT/Btn /F 768 /Ff 65536 /H/N /BS ¡¡ /W 0 ¿¿ photon:
| (1) |
For a diffuse region (), pc, while for a dense region (), pc. Thus, to resolve dust temperature variations, in an edge-on cloud, we would need to resolve structures of pc, which translates into for the \HyColor@XZeroOneThreeFour\pc@goptd@color\pc@hyenc@colorpdfcommentcolor\HyColor@XZeroOneThreeFour\pc@goptd@fontcolor\pc@hyenc@fontcolorpdfcommentcolor\HyColor@XZeroOneThreeFour\pc@goptd@icolor\pc@hyenc@icolorpdfcommentcolor\pdfmark[LMC]pdfmark=/ANN,Subtype=/Widget,Raw=/TU (Large Magellanic cloud\textCR(\pc@goptd@deadline)) /T (tooltip zref@103) /C [ ] /FT/Btn /F 768 /Ff 65536 /H/N /BS ¡¡ /W 0 ¿¿ (typical \HyColor@XZeroOneThreeFour\pc@goptd@color\pc@hyenc@colorpdfcommentcolor\HyColor@XZeroOneThreeFour\pc@goptd@fontcolor\pc@hyenc@fontcolorpdfcommentcolor\HyColor@XZeroOneThreeFour\pc@goptd@icolor\pc@hyenc@icolorpdfcommentcolor\pdfmark[ALMA]pdfmark=/ANN,Subtype=/Widget,Raw=/TU (Atacama large millimeter array (300 microns-1 cm; 2011)\textCR(\pc@goptd@deadline)) /T (tooltip zref@104) /C [ ] /FT/Btn /F 768 /Ff 65536 /H/N /BS ¡¡ /W 0 ¿¿ & \HyColor@XZeroOneThreeFour\pc@goptd@color\pc@hyenc@colorpdfcommentcolor\HyColor@XZeroOneThreeFour\pc@goptd@fontcolor\pc@hyenc@fontcolorpdfcommentcolor\HyColor@XZeroOneThreeFour\pc@goptd@icolor\pc@hyenc@icolorpdfcommentcolor\pdfmark[JWST]pdfmark=/ANN,Subtype=/Widget,Raw=/TU (James Webb Space Telescope (0.6-27 microns; 2018-)\textCR(\pc@goptd@deadline)) /T (tooltip zref@105) /C [ ] /FT/Btn /F 768 /Ff 65536 /H/N /BS ¡¡ /W 0 ¿¿ resolution) and in M 31 (currently inaccessible). For a face-on cloud, there will be mixing along the line of sight, in any case.
4.0.1 Radiative Transfer Models
The most rigorous way to understand the effects of dust extinction and emission on \HyColor@XZeroOneThreeFour\pc@goptd@color\pc@hyenc@colorpdfcommentcolor\HyColor@XZeroOneThreeFour\pc@goptd@fontcolor\pc@hyenc@fontcolorpdfcommentcolor\HyColor@XZeroOneThreeFour\pc@goptd@icolor\pc@hyenc@icolorpdfcommentcolor\pdfmark[UV]pdfmark=/ANN,Subtype=/Widget,Raw=/TU (Ultraviolet\textCR(\pc@goptd@deadline)) /T (tooltip zref@106) /C [ ] /FT/Btn /F 768 /Ff 65536 /H/N /BS ¡¡ /W 0 ¿¿ -to-mm observations of galaxies is to model the Radiative Transfer (\HyColor@XZeroOneThreeFour\pc@goptd@color\pc@hyenc@colorpdfcommentcolor\HyColor@XZeroOneThreeFour\pc@goptd@fontcolor\pc@hyenc@fontcolorpdfcommentcolor\HyColor@XZeroOneThreeFour\pc@goptd@icolor\pc@hyenc@icolorpdfcommentcolor\pdfmark[RT]pdfmark=/ANN,Subtype=/Widget,Raw=/TU (Radiative transfer\textCR(\pc@goptd@deadline)) /T (tooltip zref@107) /C [ ] /FT/Btn /F 768 /Ff 65536 /H/N /BS ¡¡ /W 0 ¿¿ ) of the starlight through their dusty \HyColor@XZeroOneThreeFour\pc@goptd@color\pc@hyenc@colorpdfcommentcolor\HyColor@XZeroOneThreeFour\pc@goptd@fontcolor\pc@hyenc@fontcolorpdfcommentcolor\HyColor@XZeroOneThreeFour\pc@goptd@icolor\pc@hyenc@icolorpdfcommentcolor\pdfmark[ISM]pdfmark=/ANN,Subtype=/Widget,Raw=/TU (Interstellar medium\textCR(\pc@goptd@deadline)) /T (tooltip zref@108) /C [ ] /FT/Btn /F 768 /Ff 65536 /H/N /BS ¡¡ /W 0 ¿¿ , in a realistic 3D geometry. Several teams have developed such codes for disk galaxies (e.g. Baes et al., 2003; Bianchi, 2008; Popescu et al., 2011). These codes solve the \HyColor@XZeroOneThreeFour\pc@goptd@color\pc@hyenc@colorpdfcommentcolor\HyColor@XZeroOneThreeFour\pc@goptd@fontcolor\pc@hyenc@fontcolorpdfcommentcolor\HyColor@XZeroOneThreeFour\pc@goptd@icolor\pc@hyenc@icolorpdfcommentcolor\pdfmark[RT]pdfmark=/ANN,Subtype=/Widget,Raw=/TU (Radiative transfer\textCR(\pc@goptd@deadline)) /T (tooltip zref@109) /C [ ] /FT/Btn /F 768 /Ff 65536 /H/N /BS ¡¡ /W 0 ¿¿ equation, accounting for multiple anisotropic scattering, absorption, and dust and stellar emission. This type of computation is numerically intensive. Most models implement a Monte Carlo method, with various refinements and heavy parallelization.
4.0.2 Application to Galaxies
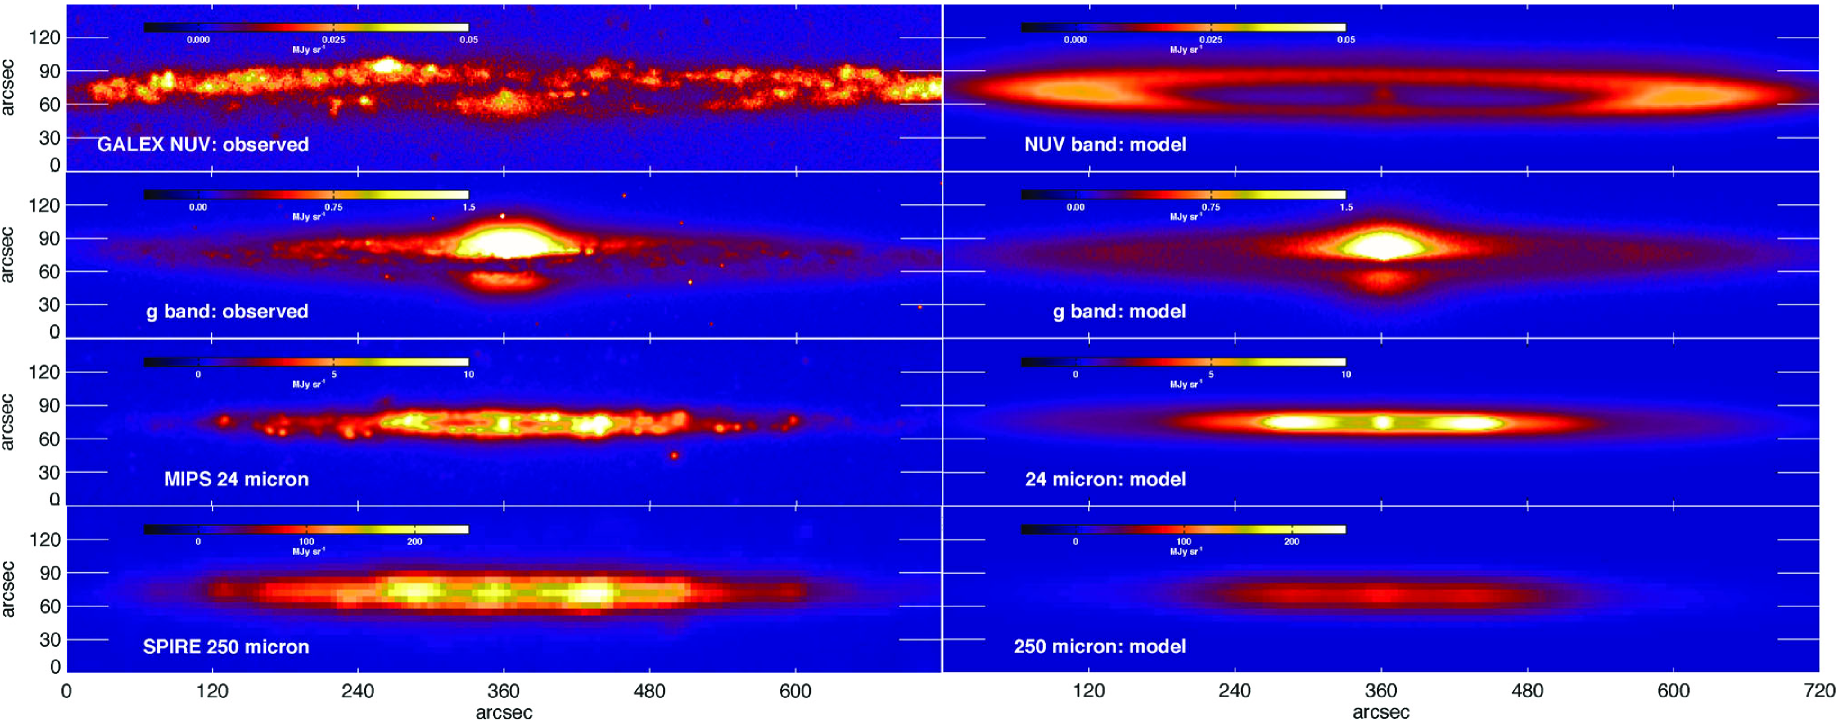
Applying 3D \HyColor@XZeroOneThreeFour\pc@goptd@color\pc@hyenc@colorpdfcommentcolor\HyColor@XZeroOneThreeFour\pc@goptd@fontcolor\pc@hyenc@fontcolorpdfcommentcolor\HyColor@XZeroOneThreeFour\pc@goptd@icolor\pc@hyenc@icolorpdfcommentcolor\pdfmark[RT]pdfmark=/ANN,Subtype=/Widget,Raw=/TU (Radiative transfer\textCR(\pc@goptd@deadline)) /T (tooltip zref@112) /C [ ] /FT/Btn /F 768 /Ff 65536 /H/N /BS ¡¡ /W 0 ¿¿ models to reproduce the spatial flux distribution of galaxies, in all wavebands, is not straightforward. Indeed, the observations provide only 2D projected constraints. This is why most studies favor edge-on galaxies, as the images of such objects provide constraints on both the radial and azimuthal distributions, assuming axisymmetry (Figure 2). Several studies have modelled the effect of extinction on the optical data of disk galaxies using such codes (e.g. Xilouris et al., 1999; Alton et al., 2004; Bianchi, 2007). They were able to answer the recurring question about the optical thickness of disk galaxies (Disney, Davies & Phillipps, 1989). In particular, Xilouris et al. (1999) found that the face-on optical depth of typical spiral galaxies is less than one in all optical bands. These studies also provide a more comprehensive answer to the nature of the dust heating sources and on the scale-length and scale-height (cf. Sections 3.1.6 and 3.1.1.3). Finally, these models account for the energy balance between the escaping \HyColor@XZeroOneThreeFour\pc@goptd@color\pc@hyenc@colorpdfcommentcolor\HyColor@XZeroOneThreeFour\pc@goptd@fontcolor\pc@hyenc@fontcolorpdfcommentcolor\HyColor@XZeroOneThreeFour\pc@goptd@icolor\pc@hyenc@icolorpdfcommentcolor\pdfmark[UV]pdfmark=/ANN,Subtype=/Widget,Raw=/TU (Ultraviolet\textCR(\pc@goptd@deadline)) /T (tooltip zref@113) /C [ ] /FT/Btn /F 768 /Ff 65536 /H/N /BS ¡¡ /W 0 ¿¿ -visible light and the re-emitted \HyColor@XZeroOneThreeFour\pc@goptd@color\pc@hyenc@colorpdfcommentcolor\HyColor@XZeroOneThreeFour\pc@goptd@fontcolor\pc@hyenc@fontcolorpdfcommentcolor\HyColor@XZeroOneThreeFour\pc@goptd@icolor\pc@hyenc@icolorpdfcommentcolor\pdfmark[IR]pdfmark=/ANN,Subtype=/Widget,Raw=/TU (Infrared\textCR(\pc@goptd@deadline)) /T (tooltip zref@114) /C [ ] /FT/Btn /F 768 /Ff 65536 /H/N /BS ¡¡ /W 0 ¿¿ -\HyColor@XZeroOneThreeFour\pc@goptd@color\pc@hyenc@colorpdfcommentcolor\HyColor@XZeroOneThreeFour\pc@goptd@fontcolor\pc@hyenc@fontcolorpdfcommentcolor\HyColor@XZeroOneThreeFour\pc@goptd@icolor\pc@hyenc@icolorpdfcommentcolor\pdfmark[submm]pdfmark=/ANN,Subtype=/Widget,Raw=/TU (Submillimeter\textCR(\pc@goptd@deadline)) /T (tooltip zref@115) /C [ ] /FT/Btn /F 768 /Ff 65536 /H/N /BS ¡¡ /W 0 ¿¿ radiation. Interestingly enough, several studies report a deficit of modelled \HyColor@XZeroOneThreeFour\pc@goptd@color\pc@hyenc@colorpdfcommentcolor\HyColor@XZeroOneThreeFour\pc@goptd@fontcolor\pc@hyenc@fontcolorpdfcommentcolor\HyColor@XZeroOneThreeFour\pc@goptd@icolor\pc@hyenc@icolorpdfcommentcolor\pdfmark[FIR]pdfmark=/ANN,Subtype=/Widget,Raw=/TU (Far-infrared\textCR(\pc@goptd@deadline)) /T (tooltip zref@116) /C [ ] /FT/Btn /F 768 /Ff 65536 /H/N /BS ¡¡ /W 0 ¿¿ emission by a factor , compared to the observations (Alton et al., 2000, 2004; Dasyra et al., 2005; De Looze et al., 2012a, b). This discrepancy is thought to reside in a lack of details in modelling the geometry. In particular, the presence of young stars, deeply embedded in molecular clouds, could compensate this deficit without significantly altering the extinction (e.g. Baes et al., 2010).
4.1 Phenomenological SED Modelling
4.1.1 The Mixing of Physical Conditions
Radiative transfer is impractical in most cases, as the geometry of the source is often poorly known. In addition, radiative transfer models of whole galaxies do not resolve spatial scales small enough (Equation 1). Hence, we are usually compelled to make approximations about the complex topology of the studied object.
4.1.1.1 The Isothermal approximation
To first order, one can ignore the variations of the physical conditions. The Modified Black Body (\HyColor@XZeroOneThreeFour\pc@goptd@color\pc@hyenc@colorpdfcommentcolor\HyColor@XZeroOneThreeFour\pc@goptd@fontcolor\pc@hyenc@fontcolorpdfcommentcolor\HyColor@XZeroOneThreeFour\pc@goptd@icolor\pc@hyenc@icolorpdfcommentcolor\pdfmark[MBB]pdfmark=/ANN,Subtype=/Widget,Raw=/TU (Modified black body\textCR(\pc@goptd@deadline)) /T (tooltip zref@117) /C [ ] /FT/Btn /F 768 /Ff 65536 /H/N /BS ¡¡ /W 0 ¿¿ ), the most widely used approximation, assumes that the \HyColor@XZeroOneThreeFour\pc@goptd@color\pc@hyenc@colorpdfcommentcolor\HyColor@XZeroOneThreeFour\pc@goptd@fontcolor\pc@hyenc@fontcolorpdfcommentcolor\HyColor@XZeroOneThreeFour\pc@goptd@icolor\pc@hyenc@icolorpdfcommentcolor\pdfmark[IR]pdfmark=/ANN,Subtype=/Widget,Raw=/TU (Infrared\textCR(\pc@goptd@deadline)) /T (tooltip zref@118) /C [ ] /FT/Btn /F 768 /Ff 65536 /H/N /BS ¡¡ /W 0 ¿¿ emission comes from identical grains, at a single temperature, , with a power-law, wavelength-dependent, dust mass absorption coefficient, or opacity:
| (2) |
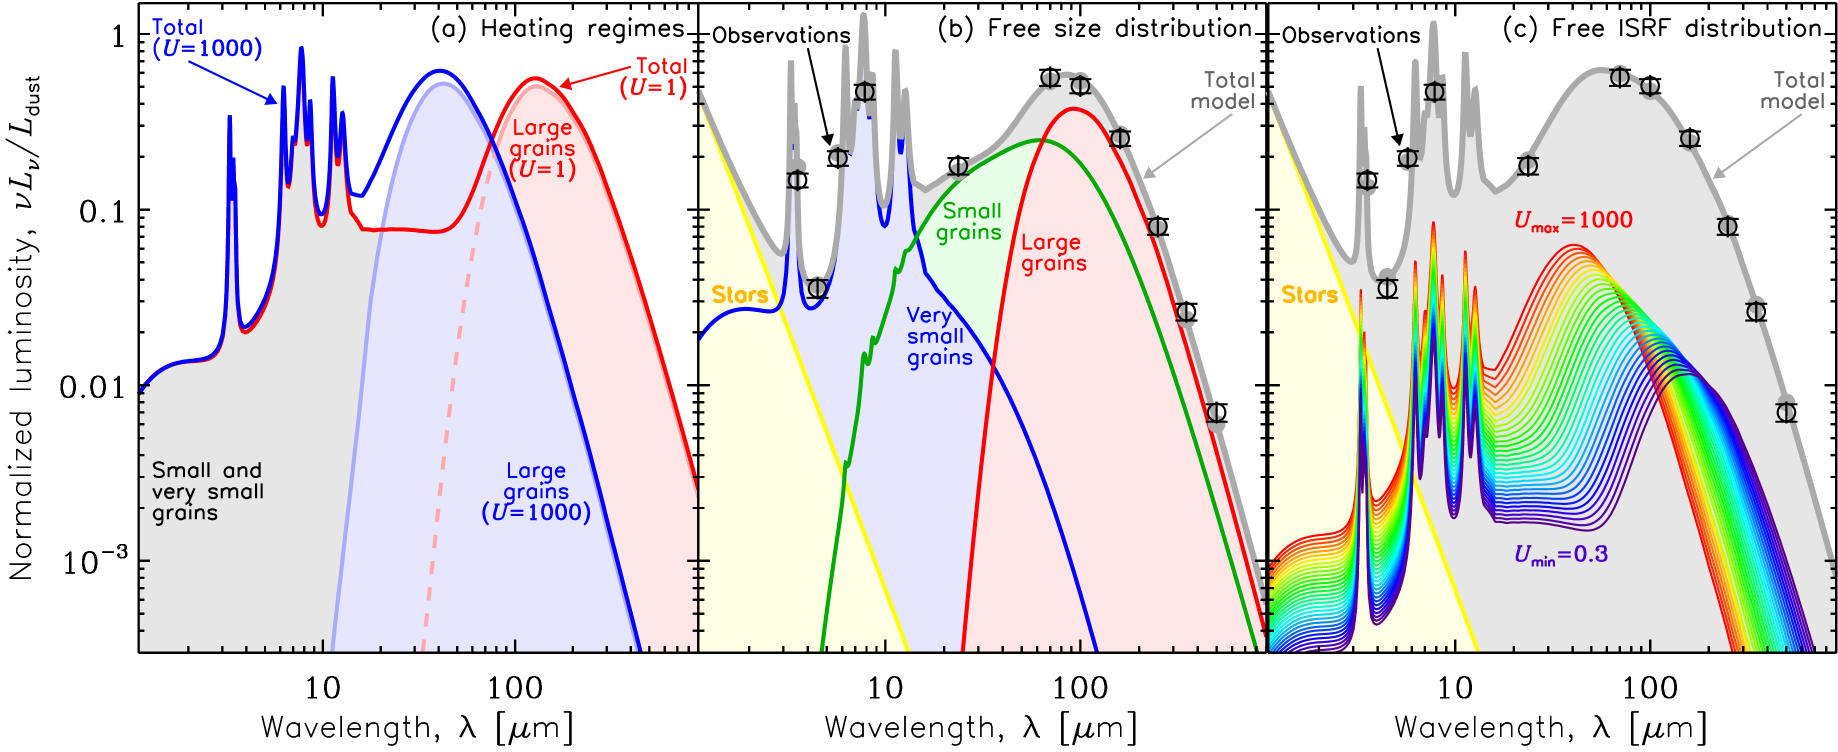
In principle, a fit of this model, varying , and \HyColor@XZeroOneThreeFour\pc@goptd@color\pc@hyenc@colorpdfcommentcolor\HyColor@XZeroOneThreeFour\pc@goptd@fontcolor\pc@hyenc@fontcolorpdfcommentcolor\HyColor@XZeroOneThreeFour\pc@goptd@icolor\pc@hyenc@icolorpdfcommentcolor\pdfmark[]pdfmark=/ANN,Subtype=/Widget,Raw=/TU (Emissivity index (power-law index of a modified black body)\textCR(\pc@goptd@deadline)) /T (tooltip zref@119) /C [ ] /FT/Btn /F 768 /Ff 65536 /H/N /BS ¡¡ /W 0 ¿¿ , provides constraints both on the grain physical conditions (through ), and on their composition (through \HyColor@XZeroOneThreeFour\pc@goptd@color\pc@hyenc@colorpdfcommentcolor\HyColor@XZeroOneThreeFour\pc@goptd@fontcolor\pc@hyenc@fontcolorpdfcommentcolor\HyColor@XZeroOneThreeFour\pc@goptd@icolor\pc@hyenc@icolorpdfcommentcolor\pdfmark[]pdfmark=/ANN,Subtype=/Widget,Raw=/TU (Emissivity index (power-law index of a modified black body)\textCR(\pc@goptd@deadline)) /T (tooltip zref@120) /C [ ] /FT/Btn /F 768 /Ff 65536 /H/N /BS ¡¡ /W 0 ¿¿ ). Indeed, different materials can have different \HyColor@XZeroOneThreeFour\pc@goptd@color\pc@hyenc@colorpdfcommentcolor\HyColor@XZeroOneThreeFour\pc@goptd@fontcolor\pc@hyenc@fontcolorpdfcommentcolor\HyColor@XZeroOneThreeFour\pc@goptd@icolor\pc@hyenc@icolorpdfcommentcolor\pdfmark[]pdfmark=/ANN,Subtype=/Widget,Raw=/TU (Emissivity index (power-law index of a modified black body)\textCR(\pc@goptd@deadline)) /T (tooltip zref@121) /C [ ] /FT/Btn /F 768 /Ff 65536 /H/N /BS ¡¡ /W 0 ¿¿ . An inverse relation is also observed on some laboratory analogs (e.g. Mennella et al., 1998; Boudet et al., 2005). However, a gradient of temperature tends to broaden the \HyColor@XZeroOneThreeFour\pc@goptd@color\pc@hyenc@colorpdfcommentcolor\HyColor@XZeroOneThreeFour\pc@goptd@fontcolor\pc@hyenc@fontcolorpdfcommentcolor\HyColor@XZeroOneThreeFour\pc@goptd@icolor\pc@hyenc@icolorpdfcommentcolor\pdfmark[SED]pdfmark=/ANN,Subtype=/Widget,Raw=/TU (Spectral energy distribution\textCR(\pc@goptd@deadline)) /T (tooltip zref@122) /C [ ] /FT/Btn /F 768 /Ff 65536 /H/N /BS ¡¡ /W 0 ¿¿ . The inherent mixing of physical conditions is thus enough to bias these estimates (e.g. Juvela & Ysard, 2012; Hunt et al., 2015). In addition, the contribution from out-of-equilibrium grains can be non negligible at (Figure 3-a). In that sense, the \HyColor@XZeroOneThreeFour\pc@goptd@color\pc@hyenc@colorpdfcommentcolor\HyColor@XZeroOneThreeFour\pc@goptd@fontcolor\pc@hyenc@fontcolorpdfcommentcolor\HyColor@XZeroOneThreeFour\pc@goptd@icolor\pc@hyenc@icolorpdfcommentcolor\pdfmark[MBB]pdfmark=/ANN,Subtype=/Widget,Raw=/TU (Modified black body\textCR(\pc@goptd@deadline)) /T (tooltip zref@123) /C [ ] /FT/Btn /F 768 /Ff 65536 /H/N /BS ¡¡ /W 0 ¿¿ derived parameters are ambiguous effective quantities (, ), which can be reliably interpreted in terms of intrinsic grain properties only: (1) in diffuse regions, where the \HyColor@XZeroOneThreeFour\pc@goptd@color\pc@hyenc@colorpdfcommentcolor\HyColor@XZeroOneThreeFour\pc@goptd@fontcolor\pc@hyenc@fontcolorpdfcommentcolor\HyColor@XZeroOneThreeFour\pc@goptd@icolor\pc@hyenc@icolorpdfcommentcolor\pdfmark[ISRF]pdfmark=/ANN,Subtype=/Widget,Raw=/TU (Interstellar radiation field\textCR(\pc@goptd@deadline)) /T (tooltip zref@124) /C [ ] /FT/Btn /F 768 /Ff 65536 /H/N /BS ¡¡ /W 0 ¿¿ is expected to be roughly uniform, or in cold cores; and (2) provided that the fit is constrained at long enough wavelengths (). ††margin: \entry ISRF intensity\HyColor@XZeroOneThreeFour\pc@goptd@color\pc@hyenc@colorpdfcommentcolor\HyColor@XZeroOneThreeFour\pc@goptd@fontcolor\pc@hyenc@fontcolorpdfcommentcolor\HyColor@XZeroOneThreeFour\pc@goptd@icolor\pc@hyenc@icolorpdfcommentcolor\pdfmark[]pdfmark=/ANN,Subtype=/Widget,Raw=/TU (Interstellar radiation field intensity\textCR(\pc@goptd@deadline)) /T (tooltip zref@125) /C [ ] /FT/Btn /F 768 /Ff 65536 /H/N /BS ¡¡ /W 0 ¿¿ is the \HyColor@XZeroOneThreeFour\pc@goptd@color\pc@hyenc@colorpdfcommentcolor\HyColor@XZeroOneThreeFour\pc@goptd@fontcolor\pc@hyenc@fontcolorpdfcommentcolor\HyColor@XZeroOneThreeFour\pc@goptd@icolor\pc@hyenc@icolorpdfcommentcolor\pdfmark[ISRF]pdfmark=/ANN,Subtype=/Widget,Raw=/TU (Interstellar radiation field\textCR(\pc@goptd@deadline)) /T (tooltip zref@126) /C [ ] /FT/Btn /F 768 /Ff 65536 /H/N /BS ¡¡ /W 0 ¿¿ intensity, integrated in . It is normalized so that in the solar neighborhood.
Alternatively, one can also fit an observed \HyColor@XZeroOneThreeFour\pc@goptd@color\pc@hyenc@colorpdfcommentcolor\HyColor@XZeroOneThreeFour\pc@goptd@fontcolor\pc@hyenc@fontcolorpdfcommentcolor\HyColor@XZeroOneThreeFour\pc@goptd@icolor\pc@hyenc@icolorpdfcommentcolor\pdfmark[SED]pdfmark=/ANN,Subtype=/Widget,Raw=/TU (Spectral energy distribution\textCR(\pc@goptd@deadline)) /T (tooltip zref@127) /C [ ] /FT/Btn /F 768 /Ff 65536 /H/N /BS ¡¡ /W 0 ¿¿ , with a full dust mixture (such as in Figure 3-a), varying the \HyColor@XZeroOneThreeFour\pc@goptd@color\pc@hyenc@colorpdfcommentcolor\HyColor@XZeroOneThreeFour\pc@goptd@fontcolor\pc@hyenc@fontcolorpdfcommentcolor\HyColor@XZeroOneThreeFour\pc@goptd@icolor\pc@hyenc@icolorpdfcommentcolor\pdfmark[ISRF]pdfmark=/ANN,Subtype=/Widget,Raw=/TU (Interstellar radiation field\textCR(\pc@goptd@deadline)) /T (tooltip zref@128) /C [ ] /FT/Btn /F 768 /Ff 65536 /H/N /BS ¡¡ /W 0 ¿¿ intensity, \HyColor@XZeroOneThreeFour\pc@goptd@color\pc@hyenc@colorpdfcommentcolor\HyColor@XZeroOneThreeFour\pc@goptd@fontcolor\pc@hyenc@fontcolorpdfcommentcolor\HyColor@XZeroOneThreeFour\pc@goptd@icolor\pc@hyenc@icolorpdfcommentcolor\pdfmark[]pdfmark=/ANN,Subtype=/Widget,Raw=/TU (Interstellar radiation field intensity\textCR(\pc@goptd@deadline)) /T (tooltip zref@129) /C [ ] /FT/Btn /F 768 /Ff 65536 /H/N /BS ¡¡ /W 0 ¿¿ , and the mass of each sub-components (Figure 3-b). With such an approach, the \HyColor@XZeroOneThreeFour\pc@goptd@color\pc@hyenc@colorpdfcommentcolor\HyColor@XZeroOneThreeFour\pc@goptd@fontcolor\pc@hyenc@fontcolorpdfcommentcolor\HyColor@XZeroOneThreeFour\pc@goptd@icolor\pc@hyenc@icolorpdfcommentcolor\pdfmark[MIR]pdfmark=/ANN,Subtype=/Widget,Raw=/TU (Mid-infrared\textCR(\pc@goptd@deadline)) /T (tooltip zref@130) /C [ ] /FT/Btn /F 768 /Ff 65536 /H/N /BS ¡¡ /W 0 ¿¿ wavelengths can be interpreted in terms of size distribution variations, provided that the \HyColor@XZeroOneThreeFour\pc@goptd@color\pc@hyenc@colorpdfcommentcolor\HyColor@XZeroOneThreeFour\pc@goptd@fontcolor\pc@hyenc@fontcolorpdfcommentcolor\HyColor@XZeroOneThreeFour\pc@goptd@icolor\pc@hyenc@icolorpdfcommentcolor\pdfmark[ISRF]pdfmark=/ANN,Subtype=/Widget,Raw=/TU (Interstellar radiation field\textCR(\pc@goptd@deadline)) /T (tooltip zref@131) /C [ ] /FT/Btn /F 768 /Ff 65536 /H/N /BS ¡¡ /W 0 ¿¿ is roughly uniform.
[h]
5 DUST HEATING REGIMES: EQUILIBRIUM OR STOCHASTIC?
5.0.1 Thermal Equilibrium
The enthalpy, , of grains with large enough radii () is, in most cases, significantly higher than the mean energy of the incident photons they absorb, . Therefore, a single photon event does not notably modify their temperature. They are at equilibrium with the radiation field. Their spectrum is proportional to a Planck function times a wavelength-dependent opacity (Figure 3-a).
5.0.2 Stochastic Heating
On the opposite, for small grains (), . A single photon event will cause temperature spikes at a few hundred K (depending on its size), followed by a significant cooling before the next absorption (Draine & Anderson, 1985). These temperature fluctuations result in a broad spectrum, extending down to the MIR (Figure 3-a). Such grains are out of thermal equilibrium.
5.0.2.1 Distributions of starlight intensities
It is possible to empirically account for the mixing of physical conditions, by parameterizing the \HyColor@XZeroOneThreeFour\pc@goptd@color\pc@hyenc@colorpdfcommentcolor\HyColor@XZeroOneThreeFour\pc@goptd@fontcolor\pc@hyenc@fontcolorpdfcommentcolor\HyColor@XZeroOneThreeFour\pc@goptd@icolor\pc@hyenc@icolorpdfcommentcolor\pdfmark[ISRF]pdfmark=/ANN,Subtype=/Widget,Raw=/TU (Interstellar radiation field\textCR(\pc@goptd@deadline)) /T (tooltip zref@148) /C [ ] /FT/Btn /F 768 /Ff 65536 /H/N /BS ¡¡ /W 0 ¿¿ intensity distribution. One of the most useful prescriptions is given by Dale et al. (2001). It assumes that the dust mass in different bins of \HyColor@XZeroOneThreeFour\pc@goptd@color\pc@hyenc@colorpdfcommentcolor\HyColor@XZeroOneThreeFour\pc@goptd@fontcolor\pc@hyenc@fontcolorpdfcommentcolor\HyColor@XZeroOneThreeFour\pc@goptd@icolor\pc@hyenc@icolorpdfcommentcolor\pdfmark[]pdfmark=/ANN,Subtype=/Widget,Raw=/TU (Interstellar radiation field intensity\textCR(\pc@goptd@deadline)) /T (tooltip zref@149) /C [ ] /FT/Btn /F 768 /Ff 65536 /H/N /BS ¡¡ /W 0 ¿¿ follows a power-law: for . This way, varying the parameters , and , an observed \HyColor@XZeroOneThreeFour\pc@goptd@color\pc@hyenc@colorpdfcommentcolor\HyColor@XZeroOneThreeFour\pc@goptd@fontcolor\pc@hyenc@fontcolorpdfcommentcolor\HyColor@XZeroOneThreeFour\pc@goptd@icolor\pc@hyenc@icolorpdfcommentcolor\pdfmark[SED]pdfmark=/ANN,Subtype=/Widget,Raw=/TU (Spectral energy distribution\textCR(\pc@goptd@deadline)) /T (tooltip zref@150) /C [ ] /FT/Btn /F 768 /Ff 65536 /H/N /BS ¡¡ /W 0 ¿¿ can be fit with a combination of physical conditions. This is demonstrated in Figure 3-c. One of the limitations of this approach is that it ignores the variations of the grain properties with environments. As will be discussed in Section 9.2, the carriers of the \HyColor@XZeroOneThreeFour\pc@goptd@color\pc@hyenc@colorpdfcommentcolor\HyColor@XZeroOneThreeFour\pc@goptd@fontcolor\pc@hyenc@fontcolorpdfcommentcolor\HyColor@XZeroOneThreeFour\pc@goptd@icolor\pc@hyenc@icolorpdfcommentcolor\pdfmark[UIB]pdfmark=/ANN,Subtype=/Widget,Raw=/TU (Unidentified infrared band\textCR(\pc@goptd@deadline)) /T (tooltip zref@151) /C [ ] /FT/Btn /F 768 /Ff 65536 /H/N /BS ¡¡ /W 0 ¿¿ s are usually destroyed in regions of high \HyColor@XZeroOneThreeFour\pc@goptd@color\pc@hyenc@colorpdfcommentcolor\HyColor@XZeroOneThreeFour\pc@goptd@fontcolor\pc@hyenc@fontcolorpdfcommentcolor\HyColor@XZeroOneThreeFour\pc@goptd@icolor\pc@hyenc@icolorpdfcommentcolor\pdfmark[]pdfmark=/ANN,Subtype=/Widget,Raw=/TU (Interstellar radiation field intensity\textCR(\pc@goptd@deadline)) /T (tooltip zref@152) /C [ ] /FT/Btn /F 768 /Ff 65536 /H/N /BS ¡¡ /W 0 ¿¿ . The \HyColor@XZeroOneThreeFour\pc@goptd@color\pc@hyenc@colorpdfcommentcolor\HyColor@XZeroOneThreeFour\pc@goptd@fontcolor\pc@hyenc@fontcolorpdfcommentcolor\HyColor@XZeroOneThreeFour\pc@goptd@icolor\pc@hyenc@icolorpdfcommentcolor\pdfmark[FIR]pdfmark=/ANN,Subtype=/Widget,Raw=/TU (Far-infrared\textCR(\pc@goptd@deadline)) /T (tooltip zref@153) /C [ ] /FT/Btn /F 768 /Ff 65536 /H/N /BS ¡¡ /W 0 ¿¿ emissivity will also change due to mantle processing and evaporation (cf. Section 9.2.1). In addition, there is a degeneracy between the \HyColor@XZeroOneThreeFour\pc@goptd@color\pc@hyenc@colorpdfcommentcolor\HyColor@XZeroOneThreeFour\pc@goptd@fontcolor\pc@hyenc@fontcolorpdfcommentcolor\HyColor@XZeroOneThreeFour\pc@goptd@icolor\pc@hyenc@icolorpdfcommentcolor\pdfmark[ISRF]pdfmark=/ANN,Subtype=/Widget,Raw=/TU (Interstellar radiation field\textCR(\pc@goptd@deadline)) /T (tooltip zref@154) /C [ ] /FT/Btn /F 768 /Ff 65536 /H/N /BS ¡¡ /W 0 ¿¿ distribution and the fraction of small grains. This is demonstrated in panels b and c of Figure 3. The same \HyColor@XZeroOneThreeFour\pc@goptd@color\pc@hyenc@colorpdfcommentcolor\HyColor@XZeroOneThreeFour\pc@goptd@fontcolor\pc@hyenc@fontcolorpdfcommentcolor\HyColor@XZeroOneThreeFour\pc@goptd@icolor\pc@hyenc@icolorpdfcommentcolor\pdfmark[SED]pdfmark=/ANN,Subtype=/Widget,Raw=/TU (Spectral energy distribution\textCR(\pc@goptd@deadline)) /T (tooltip zref@155) /C [ ] /FT/Btn /F 768 /Ff 65536 /H/N /BS ¡¡ /W 0 ¿¿ is fitted either with an isothermal model, accounting for the \HyColor@XZeroOneThreeFour\pc@goptd@color\pc@hyenc@colorpdfcommentcolor\HyColor@XZeroOneThreeFour\pc@goptd@fontcolor\pc@hyenc@fontcolorpdfcommentcolor\HyColor@XZeroOneThreeFour\pc@goptd@icolor\pc@hyenc@icolorpdfcommentcolor\pdfmark[MIR]pdfmark=/ANN,Subtype=/Widget,Raw=/TU (Mid-infrared\textCR(\pc@goptd@deadline)) /T (tooltip zref@156) /C [ ] /FT/Btn /F 768 /Ff 65536 /H/N /BS ¡¡ /W 0 ¿¿ fluxes by raising the fraction of small grains (b); or by adding hotter regions (c). Fortunately, the dust mass is dominated by the coldest large grains, and can thus be reasonably derived with this type of model. This type of model is superior to \HyColor@XZeroOneThreeFour\pc@goptd@color\pc@hyenc@colorpdfcommentcolor\HyColor@XZeroOneThreeFour\pc@goptd@fontcolor\pc@hyenc@fontcolorpdfcommentcolor\HyColor@XZeroOneThreeFour\pc@goptd@icolor\pc@hyenc@icolorpdfcommentcolor\pdfmark[MBB]pdfmark=/ANN,Subtype=/Widget,Raw=/TU (Modified black body\textCR(\pc@goptd@deadline)) /T (tooltip zref@157) /C [ ] /FT/Btn /F 768 /Ff 65536 /H/N /BS ¡¡ /W 0 ¿¿ , as the latter underestimates the mass by in rather diffuse regions, and down to a factor of , where there is a lot of mixing (e.g. Galliano et al., 2011; Galametz et al., 2012; Rémy-Ruyer et al., 2015).
More complex parameterizations of the \HyColor@XZeroOneThreeFour\pc@goptd@color\pc@hyenc@colorpdfcommentcolor\HyColor@XZeroOneThreeFour\pc@goptd@fontcolor\pc@hyenc@fontcolorpdfcommentcolor\HyColor@XZeroOneThreeFour\pc@goptd@icolor\pc@hyenc@icolorpdfcommentcolor\pdfmark[ISRF]pdfmark=/ANN,Subtype=/Widget,Raw=/TU (Interstellar radiation field\textCR(\pc@goptd@deadline)) /T (tooltip zref@158) /C [ ] /FT/Btn /F 768 /Ff 65536 /H/N /BS ¡¡ /W 0 ¿¿ distribution are possible (e.g. DL07, ). It is also possible to build multi-component models, where the phase composition is linked to the star formation history (e.g. da Cunha, Charlot & Elbaz, 2008).
5.0.2.2 A Matriochka effect
A consequence of the mixing of physical conditions is that the derived dust mass depends on the spatial resolution. Indeed, cold regions have a weak luminosity, but can be massive. When a large region is integrated, the cold components can be hidden, while they can be accounted for in smaller resolution elements. In practice, the derived dust mass is always higher (up to ), when estimated at high spatial resolution, than on integrated fluxes (Galliano et al., 2011; Galametz et al., 2012; Roman-Duval et al., 2014). The estimate at high resolution is thought to be more accurate. This result depends on the environment, on the maximum resolution and on the parameterization of the \HyColor@XZeroOneThreeFour\pc@goptd@color\pc@hyenc@colorpdfcommentcolor\HyColor@XZeroOneThreeFour\pc@goptd@fontcolor\pc@hyenc@fontcolorpdfcommentcolor\HyColor@XZeroOneThreeFour\pc@goptd@icolor\pc@hyenc@icolorpdfcommentcolor\pdfmark[ISRF]pdfmark=/ANN,Subtype=/Widget,Raw=/TU (Interstellar radiation field\textCR(\pc@goptd@deadline)) /T (tooltip zref@159) /C [ ] /FT/Btn /F 768 /Ff 65536 /H/N /BS ¡¡ /W 0 ¿¿ distribution. It is not always seen (e.g. Aniano et al., 2012).
5.0.3 Fitting Methodologies
@goptd@color\pc@hyenc@colorpdfcommentcolor\HyColor@XZeroOneThreeFour\pc@goptd@fontcolor\pc@hyenc@fontcolorpdfcommentcolor\HyColor@XZeroOneThreeFour\pc@goptd@icolor\pc@hyenc@icolorpdfcommentcolor\pdfmark[SED]pdfmark=/ANN,Subtype=/Widget,Raw=/TU (Spectral energy distribution\textCR(\pc@goptd@deadline)) /T (tooltip zref@160) /C [ ] /FT/Btn /F 768 /Ff 65536 /H/N /BS ¡¡ /W 0 ¿¿ fitting is a technical matter. First, the contribution to the broadband fluxes of several non-dust-related processes, need to be subtracted, or at least accounted for in the uncertainties (Figure 1): (1) the free-free and synchrotron radio continuum; (2) ionic, \HyColor@XZeroOneThreeFour\pc@goptd@color\pc@hyenc@colorpdfcommentcolor\HyColor@XZeroOneThreeFour\pc@goptd@fontcolor\pc@hyenc@fontcolorpdfcommentcolor\HyColor@XZeroOneThreeFour\pc@goptd@icolor\pc@hyenc@icolorpdfcommentcolor\pdfmark[PDR]pdfmark=/ANN,Subtype=/Widget,Raw=/TU (Photodissociation region\textCR(\pc@goptd@deadline)) /T (tooltip zref@161) /C [ ] /FT/Btn /F 768 /Ff 65536 /H/N /BS ¡¡ /W 0 ¿¿ and molecular lines; (3) foreground Galactic and zodiacal emission; (4) background galaxies. Second, finding the best model parameters is not straightforward. The least-squares method is the most widely used approach to fit an \HyColor@XZeroOneThreeFour\pc@goptd@color\pc@hyenc@colorpdfcommentcolor\HyColor@XZeroOneThreeFour\pc@goptd@fontcolor\pc@hyenc@fontcolorpdfcommentcolor\HyColor@XZeroOneThreeFour\pc@goptd@icolor\pc@hyenc@icolorpdfcommentcolor\pdfmark[SED]pdfmark=/ANN,Subtype=/Widget,Raw=/TU (Spectral energy distribution\textCR(\pc@goptd@deadline)) /T (tooltip zref@162) /C [ ] /FT/Btn /F 768 /Ff 65536 /H/N /BS ¡¡ /W 0 ¿¿ model to \HyColor@XZeroOneThreeFour\pc@goptd@color\pc@hyenc@colorpdfcommentcolor\HyColor@XZeroOneThreeFour\pc@goptd@fontcolor\pc@hyenc@fontcolorpdfcommentcolor\HyColor@XZeroOneThreeFour\pc@goptd@icolor\pc@hyenc@icolorpdfcommentcolor\pdfmark[IR]pdfmark=/ANN,Subtype=/Widget,Raw=/TU (Infrared\textCR(\pc@goptd@deadline)) /T (tooltip zref@163) /C [ ] /FT/Btn /F 768 /Ff 65536 /H/N /BS ¡¡ /W 0 ¿¿ observations. However, Shetty et al. (2009) have shown that this approach leads to a noise-induced false anticorrelation between and \HyColor@XZeroOneThreeFour\pc@goptd@color\pc@hyenc@colorpdfcommentcolor\HyColor@XZeroOneThreeFour\pc@goptd@fontcolor\pc@hyenc@fontcolorpdfcommentcolor\HyColor@XZeroOneThreeFour\pc@goptd@icolor\pc@hyenc@icolorpdfcommentcolor\pdfmark[]pdfmark=/ANN,Subtype=/Widget,Raw=/TU (Emissivity index (power-law index of a modified black body)\textCR(\pc@goptd@deadline)) /T (tooltip zref@164) /C [ ] /FT/Btn /F 768 /Ff 65536 /H/N /BS ¡¡ /W 0 ¿¿ , in the case of a \HyColor@XZeroOneThreeFour\pc@goptd@color\pc@hyenc@colorpdfcommentcolor\HyColor@XZeroOneThreeFour\pc@goptd@fontcolor\pc@hyenc@fontcolorpdfcommentcolor\HyColor@XZeroOneThreeFour\pc@goptd@icolor\pc@hyenc@icolorpdfcommentcolor\pdfmark[MBB]pdfmark=/ANN,Subtype=/Widget,Raw=/TU (Modified black body\textCR(\pc@goptd@deadline)) /T (tooltip zref@165) /C [ ] /FT/Btn /F 768 /Ff 65536 /H/N /BS ¡¡ /W 0 ¿¿ . It makes the determination of the possible real relation (Section 4.1.1.1) difficult. Galliano (submitted; hereafter G18) showed that similar noise-induced correlations are found between most parameters, when using full dust models with an \HyColor@XZeroOneThreeFour\pc@goptd@color\pc@hyenc@colorpdfcommentcolor\HyColor@XZeroOneThreeFour\pc@goptd@fontcolor\pc@hyenc@fontcolorpdfcommentcolor\HyColor@XZeroOneThreeFour\pc@goptd@icolor\pc@hyenc@icolorpdfcommentcolor\pdfmark[ISRF]pdfmark=/ANN,Subtype=/Widget,Raw=/TU (Interstellar radiation field\textCR(\pc@goptd@deadline)) /T (tooltip zref@166) /C [ ] /FT/Btn /F 768 /Ff 65536 /H/N /BS ¡¡ /W 0 ¿¿ distribution.
Bayesian inference is becoming increasingly popular with the development of powerful computers. Several \HyColor@XZeroOneThreeFour\pc@goptd@color\pc@hyenc@colorpdfcommentcolor\HyColor@XZeroOneThreeFour\pc@goptd@fontcolor\pc@hyenc@fontcolorpdfcommentcolor\HyColor@XZeroOneThreeFour\pc@goptd@icolor\pc@hyenc@icolorpdfcommentcolor\pdfmark[SED]pdfmark=/ANN,Subtype=/Widget,Raw=/TU (Spectral energy distribution\textCR(\pc@goptd@deadline)) /T (tooltip zref@167) /C [ ] /FT/Btn /F 768 /Ff 65536 /H/N /BS ¡¡ /W 0 ¿¿ models implement it to provide rigorous uncertainty estimates of the derived parameters. However, G18 has shown that this approach is not sufficient to solve the noise-induced correlations. In fact, Kelly et al. (2012) have demonstrated, in the case of a \HyColor@XZeroOneThreeFour\pc@goptd@color\pc@hyenc@colorpdfcommentcolor\HyColor@XZeroOneThreeFour\pc@goptd@fontcolor\pc@hyenc@fontcolorpdfcommentcolor\HyColor@XZeroOneThreeFour\pc@goptd@icolor\pc@hyenc@icolorpdfcommentcolor\pdfmark[MBB]pdfmark=/ANN,Subtype=/Widget,Raw=/TU (Modified black body\textCR(\pc@goptd@deadline)) /T (tooltip zref@168) /C [ ] /FT/Btn /F 768 /Ff 65536 /H/N /BS ¡¡ /W 0 ¿¿ , that it is necessary to use the more complex hierarchical Bayesian inference to achieve this goal. G18 has extended this technique to full dust models with \HyColor@XZeroOneThreeFour\pc@goptd@color\pc@hyenc@colorpdfcommentcolor\HyColor@XZeroOneThreeFour\pc@goptd@fontcolor\pc@hyenc@fontcolorpdfcommentcolor\HyColor@XZeroOneThreeFour\pc@goptd@icolor\pc@hyenc@icolorpdfcommentcolor\pdfmark[ISRF]pdfmark=/ANN,Subtype=/Widget,Raw=/TU (Interstellar radiation field\textCR(\pc@goptd@deadline)) /T (tooltip zref@169) /C [ ] /FT/Btn /F 768 /Ff 65536 /H/N /BS ¡¡ /W 0 ¿¿ distributions, and has shown that it leads to significant improvements in the recovery of the dust parameters and of their intrinsic correlations.
5.1 The Grains in Relation with the Gas and the Stars: Diagnostic Tools
5.1.1 Dust-Related Star Formation Rate Indicators
The \HyColor@XZeroOneThreeFour\pc@goptd@color\pc@hyenc@colorpdfcommentcolor\HyColor@XZeroOneThreeFour\pc@goptd@fontcolor\pc@hyenc@fontcolorpdfcommentcolor\HyColor@XZeroOneThreeFour\pc@goptd@icolor\pc@hyenc@icolorpdfcommentcolor\pdfmark[SFR]pdfmark=/ANN,Subtype=/Widget,Raw=/TU (Star formation rate\textCR(\pc@goptd@deadline)) /T (tooltip zref@170) /C [ ] /FT/Btn /F 768 /Ff 65536 /H/N /BS ¡¡ /W 0 ¿¿ is a crucial quantity for galaxy evolution studies. Several dust-related \HyColor@XZeroOneThreeFour\pc@goptd@color\pc@hyenc@colorpdfcommentcolor\HyColor@XZeroOneThreeFour\pc@goptd@fontcolor\pc@hyenc@fontcolorpdfcommentcolor\HyColor@XZeroOneThreeFour\pc@goptd@icolor\pc@hyenc@icolorpdfcommentcolor\pdfmark[SFR]pdfmark=/ANN,Subtype=/Widget,Raw=/TU (Star formation rate\textCR(\pc@goptd@deadline)) /T (tooltip zref@171) /C [ ] /FT/Btn /F 768 /Ff 65536 /H/N /BS ¡¡ /W 0 ¿¿ tracers have been empirically calibrated using observations of resolved star forming regions in nearby galaxies. They rely on the fact that young stars are extremely luminous and are enshrouded with dust. If the clouds are optically thick and if their covering factor is unity, the OB star luminosity is: . Contrary to a common misconception, this is independent of dust properties. Assuming a typical Initial Mass Function (\HyColor@XZeroOneThreeFour\pc@goptd@color\pc@hyenc@colorpdfcommentcolor\HyColor@XZeroOneThreeFour\pc@goptd@fontcolor\pc@hyenc@fontcolorpdfcommentcolor\HyColor@XZeroOneThreeFour\pc@goptd@icolor\pc@hyenc@icolorpdfcommentcolor\pdfmark[IMF]pdfmark=/ANN,Subtype=/Widget,Raw=/TU (Initial mass function\textCR(\pc@goptd@deadline)) /T (tooltip zref@172) /C [ ] /FT/Btn /F 768 /Ff 65536 /H/N /BS ¡¡ /W 0 ¿¿ ), burst age and metallicity, can be converted to: . The contribution of old stars to is negligible for high enough \HyColor@XZeroOneThreeFour\pc@goptd@color\pc@hyenc@colorpdfcommentcolor\HyColor@XZeroOneThreeFour\pc@goptd@fontcolor\pc@hyenc@fontcolorpdfcommentcolor\HyColor@XZeroOneThreeFour\pc@goptd@icolor\pc@hyenc@icolorpdfcommentcolor\pdfmark[SFR]pdfmark=/ANN,Subtype=/Widget,Raw=/TU (Star formation rate\textCR(\pc@goptd@deadline)) /T (tooltip zref@173) /C [ ] /FT/Btn /F 768 /Ff 65536 /H/N /BS ¡¡ /W 0 ¿¿ s. Alternatively, monochromatic \HyColor@XZeroOneThreeFour\pc@goptd@color\pc@hyenc@colorpdfcommentcolor\HyColor@XZeroOneThreeFour\pc@goptd@fontcolor\pc@hyenc@fontcolorpdfcommentcolor\HyColor@XZeroOneThreeFour\pc@goptd@icolor\pc@hyenc@icolorpdfcommentcolor\pdfmark[SFR]pdfmark=/ANN,Subtype=/Widget,Raw=/TU (Star formation rate\textCR(\pc@goptd@deadline)) /T (tooltip zref@174) /C [ ] /FT/Btn /F 768 /Ff 65536 /H/N /BS ¡¡ /W 0 ¿¿ indicators have been proposed. Calzetti et al. (2007) and Li et al. (2010) found that the 24 and monochromatic luminosities were good local \HyColor@XZeroOneThreeFour\pc@goptd@color\pc@hyenc@colorpdfcommentcolor\HyColor@XZeroOneThreeFour\pc@goptd@fontcolor\pc@hyenc@fontcolorpdfcommentcolor\HyColor@XZeroOneThreeFour\pc@goptd@icolor\pc@hyenc@icolorpdfcommentcolor\pdfmark[SFR]pdfmark=/ANN,Subtype=/Widget,Raw=/TU (Star formation rate\textCR(\pc@goptd@deadline)) /T (tooltip zref@175) /C [ ] /FT/Btn /F 768 /Ff 65536 /H/N /BS ¡¡ /W 0 ¿¿ indicators (on spatial scales of kpc): \pdfmark[L_ν(24)]pdfmark=/ANN,Subtype=/Widget,Raw=/TU (Monochromatic luminosity at 24 microns (Lsun/Hz)\textCR(\pc@goptd@deadline)) /T (tooltip zref@176) /C [ ] /FT/Btn /F 768 /Ff 65536 /H/N /BS ¡¡ /W 0 ¿¿ /(L_⊙/Hz)]^0.885SFR/(M_⊙/yr)≃1547×\HyColor@XZeroOneThreeFour\pc@goptd@color\pc@hyenc@colorpdfcommentcolor\HyColor@XZeroOneThreeFour\pc@goptd@fontcolor\pc@hyenc@fontcolorpdfcommentcolor\HyColor@XZeroOneThreeFour\pc@goptd@icolor\pc@hyenc@icolorpdfcommentcolor\pdfmark[L_ν(70)]pdfmark=/ANN,Subtype=/Widget,Raw=/TU (Monochromatic luminosity at 70 microns (Lsun/Hz)\textCR(\pc@goptd@deadline)) /T (tooltip zref@177) /C [ ] /FT/Btn /F 768 /Ff 65536 /H/N /BS ¡¡ /W 0 ¿¿ /(L_⊙/Hz)6.2 μm\pdfmark[UIB]pdfmark=/ANN,Subtype=/Widget,Raw=/TU (Unidentified infrared band\textCR(\pc@goptd@deadline)) /T (tooltip zref@178) /C [ ] /FT/Btn /F 768 /Ff 65536 /H/N /BS ¡¡ /W 0 ¿¿ correlates with \HyColor@XZeroOneThreeFour\pc@goptd@color\pc@hyenc@colorpdfcommentcolor\HyColor@XZeroOneThreeFour\pc@goptd@fontcolor\pc@hyenc@fontcolorpdfcommentcolor\HyColor@XZeroOneThreeFour\pc@goptd@icolor\pc@hyenc@icolorpdfcommentcolor\pdfmark[SFR]pdfmark=/ANN,Subtype=/Widget,Raw=/TU (Star formation rate\textCR(\pc@goptd@deadline)) /T (tooltip zref@179) /C [ ] /FT/Btn /F 768 /Ff 65536 /H/N /BS ¡¡ /W 0 ¿¿ , it is probably a better B star tracer. Moreover, the \HyColor@XZeroOneThreeFour\pc@goptd@color\pc@hyenc@colorpdfcommentcolor\HyColor@XZeroOneThreeFour\pc@goptd@fontcolor\pc@hyenc@fontcolorpdfcommentcolor\HyColor@XZeroOneThreeFour\pc@goptd@icolor\pc@hyenc@icolorpdfcommentcolor\pdfmark[UIB]pdfmark=/ANN,Subtype=/Widget,Raw=/TU (Unidentified infrared band\textCR(\pc@goptd@deadline)) /T (tooltip zref@180) /C [ ] /FT/Btn /F 768 /Ff 65536 /H/N /BS ¡¡ /W 0 ¿¿ strength is strongly metallicity dependent (Section 9.3.4). Finally, several composite indicators have been calibrated (Hao et al., 2011). By combining Far-\HyColor@XZeroOneThreeFour\pc@goptd@color\pc@hyenc@colorpdfcommentcolor\HyColor@XZeroOneThreeFour\pc@goptd@fontcolor\pc@hyenc@fontcolorpdfcommentcolor\HyColor@XZeroOneThreeFour\pc@goptd@icolor\pc@hyenc@icolorpdfcommentcolor\pdfmark[UV]pdfmark=/ANN,Subtype=/Widget,Raw=/TU (Ultraviolet\textCR(\pc@goptd@deadline)) /T (tooltip zref@181) /C [ ] /FT/Btn /F 768 /Ff 65536 /H/N /BS ¡¡ /W 0 ¿¿ (\HyColor@XZeroOneThreeFour\pc@goptd@color\pc@hyenc@colorpdfcommentcolor\HyColor@XZeroOneThreeFour\pc@goptd@fontcolor\pc@hyenc@fontcolorpdfcommentcolor\HyColor@XZeroOneThreeFour\pc@goptd@icolor\pc@hyenc@icolorpdfcommentcolor\pdfmark[FUV]pdfmark=/ANN,Subtype=/Widget,Raw=/TU (Far-ultraviolet\textCR(\pc@goptd@deadline)) /T (tooltip zref@182) /C [ ] /FT/Btn /F 768 /Ff 65536 /H/N /BS ¡¡ /W 0 ¿¿ ) or H measurements with the or \HyColor@XZeroOneThreeFour\pc@goptd@color\pc@hyenc@colorpdfcommentcolor\HyColor@XZeroOneThreeFour\pc@goptd@fontcolor\pc@hyenc@fontcolorpdfcommentcolor\HyColor@XZeroOneThreeFour\pc@goptd@icolor\pc@hyenc@icolorpdfcommentcolor\pdfmark[TIR]pdfmark=/ANN,Subtype=/Widget,Raw=/TU (Total infrared\textCR(\pc@goptd@deadline)) /T (tooltip zref@183) /C [ ] /FT/Btn /F 768 /Ff 65536 /H/N /BS ¡¡ /W 0 ¿¿ indicators, they account for the fact that star forming regions are not completely opaque. ††margin: \entry TIRtotal infrared (). is the integrated power in this range.
5.1.2 Estimating the Total Gas Mass
The complexity of the \HyColor@XZeroOneThreeFour\pc@goptd@color\pc@hyenc@colorpdfcommentcolor\HyColor@XZeroOneThreeFour\pc@goptd@fontcolor\pc@hyenc@fontcolorpdfcommentcolor\HyColor@XZeroOneThreeFour\pc@goptd@icolor\pc@hyenc@icolorpdfcommentcolor\pdfmark[ISM]pdfmark=/ANN,Subtype=/Widget,Raw=/TU (Interstellar medium\textCR(\pc@goptd@deadline)) /T (tooltip zref@184) /C [ ] /FT/Btn /F 768 /Ff 65536 /H/N /BS ¡¡ /W 0 ¿¿ phase mixing makes the total gas mass difficult to estimate. The ionized, neutral atomic and molecular phases, require each one an independent tracer. And even when these tracers are available, some notable biases question the reliability of these estimates: (1) the [H i] emission can be saturated at high optical depth, leading to a possible underestimate of by a factor up to (e.g. in the local \HyColor@XZeroOneThreeFour\pc@goptd@color\pc@hyenc@colorpdfcommentcolor\HyColor@XZeroOneThreeFour\pc@goptd@fontcolor\pc@hyenc@fontcolorpdfcommentcolor\HyColor@XZeroOneThreeFour\pc@goptd@icolor\pc@hyenc@icolorpdfcommentcolor\pdfmark[ISM]pdfmark=/ANN,Subtype=/Widget,Raw=/TU (Interstellar medium\textCR(\pc@goptd@deadline)) /T (tooltip zref@185) /C [ ] /FT/Btn /F 768 /Ff 65536 /H/N /BS ¡¡ /W 0 ¿¿ ; Fukui et al., 2015); (2) the 12CO(J10)2.6mm, used to estimate , can be biased by the selective photodissociation of CO in translucent H2 clouds, leading to a possible underestimate of by a factor up to (e.g. in low-\HyColor@XZeroOneThreeFour\pc@goptd@color\pc@hyenc@colorpdfcommentcolor\HyColor@XZeroOneThreeFour\pc@goptd@fontcolor\pc@hyenc@fontcolorpdfcommentcolor\HyColor@XZeroOneThreeFour\pc@goptd@icolor\pc@hyenc@icolorpdfcommentcolor\pdfmark[]pdfmark=/ANN,Subtype=/Widget,Raw=/TU (Metallicity\textCR(\pc@goptd@deadline)) /T (tooltip zref@186) /C [ ] /FT/Btn /F 768 /Ff 65536 /H/N /BS ¡¡ /W 0 ¿¿ systems; Madden et al., 1997). There is thus a reservoir of dark gas, unaccounted for by these tracers. \HyColor@XZeroOneThreeFour\pc@goptd@color\pc@hyenc@colorpdfcommentcolor\HyColor@XZeroOneThreeFour\pc@goptd@fontcolor\pc@hyenc@fontcolorpdfcommentcolor\HyColor@XZeroOneThreeFour\pc@goptd@icolor\pc@hyenc@icolorpdfcommentcolor\pdfmark[UV]pdfmark=/ANN,Subtype=/Widget,Raw=/TU (Ultraviolet\textCR(\pc@goptd@deadline)) /T (tooltip zref@187) /C [ ] /FT/Btn /F 768 /Ff 65536 /H/N /BS ¡¡ /W 0 ¿¿ H i and H2 absorption lines are less biased, but are difficult to observe.
Whether observed in extinction or in emission, dust has been used as an indirect gas tracer for several decades (Hildebrand, 1983; Devereux & Young, 1990). Neglecting the ionized gas, and assuming that the H i surface density, , has been corrected for optical thickness, the dust surface density can be expressed as: , where is the conversion factor between the CO intensity, , and the H2 surface density. Israel (1997) pioneered in deriving in nearby galaxies, using the \HyColor@XZeroOneThreeFour\pc@goptd@color\pc@hyenc@colorpdfcommentcolor\HyColor@XZeroOneThreeFour\pc@goptd@fontcolor\pc@hyenc@fontcolorpdfcommentcolor\HyColor@XZeroOneThreeFour\pc@goptd@icolor\pc@hyenc@icolorpdfcommentcolor\pdfmark[FIR]pdfmark=/ANN,Subtype=/Widget,Raw=/TU (Far-infrared\textCR(\pc@goptd@deadline)) /T (tooltip zref@188) /C [ ] /FT/Btn /F 768 /Ff 65536 /H/N /BS ¡¡ /W 0 ¿¿ dust emission. Leroy et al. (2011) designed a method to solve both for \HyColor@XZeroOneThreeFour\pc@goptd@color\pc@hyenc@colorpdfcommentcolor\HyColor@XZeroOneThreeFour\pc@goptd@fontcolor\pc@hyenc@fontcolorpdfcommentcolor\HyColor@XZeroOneThreeFour\pc@goptd@icolor\pc@hyenc@icolorpdfcommentcolor\pdfmark[]pdfmark=/ANN,Subtype=/Widget,Raw=/TU (Dust-to-gas mass ratio\textCR(\pc@goptd@deadline)) /T (tooltip zref@189) /C [ ] /FT/Btn /F 768 /Ff 65536 /H/N /BS ¡¡ /W 0 ¿¿ and , assuming a homogenous grain constitution and a constant \HyColor@XZeroOneThreeFour\pc@goptd@color\pc@hyenc@colorpdfcommentcolor\HyColor@XZeroOneThreeFour\pc@goptd@fontcolor\pc@hyenc@fontcolorpdfcommentcolor\HyColor@XZeroOneThreeFour\pc@goptd@icolor\pc@hyenc@icolorpdfcommentcolor\pdfmark[]pdfmark=/ANN,Subtype=/Widget,Raw=/TU (Dust-to-gas mass ratio\textCR(\pc@goptd@deadline)) /T (tooltip zref@190) /C [ ] /FT/Btn /F 768 /Ff 65536 /H/N /BS ¡¡ /W 0 ¿¿ in each one of the objects they studied. They confirmed that low-\HyColor@XZeroOneThreeFour\pc@goptd@color\pc@hyenc@colorpdfcommentcolor\HyColor@XZeroOneThreeFour\pc@goptd@fontcolor\pc@hyenc@fontcolorpdfcommentcolor\HyColor@XZeroOneThreeFour\pc@goptd@icolor\pc@hyenc@icolorpdfcommentcolor\pdfmark[]pdfmark=/ANN,Subtype=/Widget,Raw=/TU (Metallicity\textCR(\pc@goptd@deadline)) /T (tooltip zref@191) /C [ ] /FT/Btn /F 768 /Ff 65536 /H/N /BS ¡¡ /W 0 ¿¿ galaxies have larger than the \HyColor@XZeroOneThreeFour\pc@goptd@color\pc@hyenc@colorpdfcommentcolor\HyColor@XZeroOneThreeFour\pc@goptd@fontcolor\pc@hyenc@fontcolorpdfcommentcolor\HyColor@XZeroOneThreeFour\pc@goptd@icolor\pc@hyenc@icolorpdfcommentcolor\pdfmark[MW]pdfmark=/ANN,Subtype=/Widget,Raw=/TU (Milky Way\textCR(\pc@goptd@deadline)) /T (tooltip zref@192) /C [ ] /FT/Btn /F 768 /Ff 65536 /H/N /BS ¡¡ /W 0 ¿¿ (up to a factor of ). This well-established fact is believed to originate in the enhanced photodissociation of CO in an \HyColor@XZeroOneThreeFour\pc@goptd@color\pc@hyenc@colorpdfcommentcolor\HyColor@XZeroOneThreeFour\pc@goptd@fontcolor\pc@hyenc@fontcolorpdfcommentcolor\HyColor@XZeroOneThreeFour\pc@goptd@icolor\pc@hyenc@icolorpdfcommentcolor\pdfmark[ISM]pdfmark=/ANN,Subtype=/Widget,Raw=/TU (Interstellar medium\textCR(\pc@goptd@deadline)) /T (tooltip zref@193) /C [ ] /FT/Btn /F 768 /Ff 65536 /H/N /BS ¡¡ /W 0 ¿¿ less dusty, thus less opaque (cf. Section 9.3.2), while H2 remains self-shielded. Similar studies have been done in extinction (e.g. in the \HyColor@XZeroOneThreeFour\pc@goptd@color\pc@hyenc@colorpdfcommentcolor\HyColor@XZeroOneThreeFour\pc@goptd@fontcolor\pc@hyenc@fontcolorpdfcommentcolor\HyColor@XZeroOneThreeFour\pc@goptd@icolor\pc@hyenc@icolorpdfcommentcolor\pdfmark[LMC]pdfmark=/ANN,Subtype=/Widget,Raw=/TU (Large Magellanic cloud\textCR(\pc@goptd@deadline)) /T (tooltip zref@194) /C [ ] /FT/Btn /F 768 /Ff 65536 /H/N /BS ¡¡ /W 0 ¿¿ ; Dobashi et al., 2008). ††margin: \entry Dust-to-gas mass rationoted \HyColor@XZeroOneThreeFour\pc@goptd@color\pc@hyenc@colorpdfcommentcolor\HyColor@XZeroOneThreeFour\pc@goptd@fontcolor\pc@hyenc@fontcolorpdfcommentcolor\HyColor@XZeroOneThreeFour\pc@goptd@icolor\pc@hyenc@icolorpdfcommentcolor\pdfmark[]pdfmark=/ANN,Subtype=/Widget,Raw=/TU (Dust-to-gas mass ratio\textCR(\pc@goptd@deadline)) /T (tooltip zref@195) /C [ ] /FT/Btn /F 768 /Ff 65536 /H/N /BS ¡¡ /W 0 ¿¿ , defined as \pdfmark[Z_dust]pdfmark=/ANN,Subtype=/Widget,Raw=/TU (Dust-to-gas mass ratio\textCR(\pc@goptd@deadline)) /T (tooltip zref@196) /C [ ] /FT/Btn /F 768 /Ff 65536 /H/N /BS ¡¡ /W 0 ¿¿ =Σ_dust/Σ_gasΣ_gas _2
5.1.3 Constraints for Photodissociation Models
In \HyColor@XZeroOneThreeFour\pc@goptd@color\pc@hyenc@colorpdfcommentcolor\HyColor@XZeroOneThreeFour\pc@goptd@fontcolor\pc@hyenc@fontcolorpdfcommentcolor\HyColor@XZeroOneThreeFour\pc@goptd@icolor\pc@hyenc@icolorpdfcommentcolor\pdfmark[PDR]pdfmark=/ANN,Subtype=/Widget,Raw=/TU (Photodissociation region\textCR(\pc@goptd@deadline)) /T (tooltip zref@197) /C [ ] /FT/Btn /F 768 /Ff 65536 /H/N /BS ¡¡ /W 0 ¿¿ s, the gas is primarily heated by photoelectrons ejected from the grains (Draine, 1978). The \HyColor@XZeroOneThreeFour\pc@goptd@color\pc@hyenc@colorpdfcommentcolor\HyColor@XZeroOneThreeFour\pc@goptd@fontcolor\pc@hyenc@fontcolorpdfcommentcolor\HyColor@XZeroOneThreeFour\pc@goptd@icolor\pc@hyenc@icolorpdfcommentcolor\pdfmark[PE]pdfmark=/ANN,Subtype=/Widget,Raw=/TU (Photoelectric\textCR(\pc@goptd@deadline)) /T (tooltip zref@198) /C [ ] /FT/Btn /F 768 /Ff 65536 /H/N /BS ¡¡ /W 0 ¿¿ heating is more efficient for the smallest sizes, in particular, for the carriers of the \HyColor@XZeroOneThreeFour\pc@goptd@color\pc@hyenc@colorpdfcommentcolor\HyColor@XZeroOneThreeFour\pc@goptd@fontcolor\pc@hyenc@fontcolorpdfcommentcolor\HyColor@XZeroOneThreeFour\pc@goptd@icolor\pc@hyenc@icolorpdfcommentcolor\pdfmark[UIB]pdfmark=/ANN,Subtype=/Widget,Raw=/TU (Unidentified infrared band\textCR(\pc@goptd@deadline)) /T (tooltip zref@199) /C [ ] /FT/Btn /F 768 /Ff 65536 /H/N /BS ¡¡ /W 0 ¿¿ s (e.g. Weingartner & Draine, 2001). This heating efficiency therefore depends on the dust properties, and thus on the environment. Assuming that [C ii]158μm is the main gas coolant, the \HyColor@XZeroOneThreeFour\pc@goptd@color\pc@hyenc@colorpdfcommentcolor\HyColor@XZeroOneThreeFour\pc@goptd@fontcolor\pc@hyenc@fontcolorpdfcommentcolor\HyColor@XZeroOneThreeFour\pc@goptd@icolor\pc@hyenc@icolorpdfcommentcolor\pdfmark[PE]pdfmark=/ANN,Subtype=/Widget,Raw=/TU (Photoelectric\textCR(\pc@goptd@deadline)) /T (tooltip zref@200) /C [ ] /FT/Btn /F 768 /Ff 65536 /H/N /BS ¡¡ /W 0 ¿¿ efficiency, , can be approximated by the gas-to-dust cooling ratio: . Detailed studies usually add other lines to the gas cooling rate, like [O i]63μm, to have a more complete estimate (e.g. Cormier et al., 2015). Overall, Smith et al. (2017) found that , with an average of , in a sample of 54 nearby galaxies. It appears that is lower when the dust temperature is higher (Rubin et al., 2009; Croxall et al., 2012). This is not likely the result of the destruction of the \HyColor@XZeroOneThreeFour\pc@goptd@color\pc@hyenc@colorpdfcommentcolor\HyColor@XZeroOneThreeFour\pc@goptd@fontcolor\pc@hyenc@fontcolorpdfcommentcolor\HyColor@XZeroOneThreeFour\pc@goptd@icolor\pc@hyenc@icolorpdfcommentcolor\pdfmark[UIB]pdfmark=/ANN,Subtype=/Widget,Raw=/TU (Unidentified infrared band\textCR(\pc@goptd@deadline)) /T (tooltip zref@201) /C [ ] /FT/Btn /F 768 /Ff 65536 /H/N /BS ¡¡ /W 0 ¿¿ carriers, as their intensity correlates the best with the [C ii]158μm emission (e.g. Helou et al., 2001). It is rather conjectured to be due to the saturation of grain charging in \HyColor@XZeroOneThreeFour\pc@goptd@color\pc@hyenc@colorpdfcommentcolor\HyColor@XZeroOneThreeFour\pc@goptd@fontcolor\pc@hyenc@fontcolorpdfcommentcolor\HyColor@XZeroOneThreeFour\pc@goptd@icolor\pc@hyenc@icolorpdfcommentcolor\pdfmark[UV]pdfmark=/ANN,Subtype=/Widget,Raw=/TU (Ultraviolet\textCR(\pc@goptd@deadline)) /T (tooltip zref@202) /C [ ] /FT/Btn /F 768 /Ff 65536 /H/N /BS ¡¡ /W 0 ¿¿ -bright regions. The shape of the \HyColor@XZeroOneThreeFour\pc@goptd@color\pc@hyenc@colorpdfcommentcolor\HyColor@XZeroOneThreeFour\pc@goptd@fontcolor\pc@hyenc@fontcolorpdfcommentcolor\HyColor@XZeroOneThreeFour\pc@goptd@icolor\pc@hyenc@icolorpdfcommentcolor\pdfmark[ISRF]pdfmark=/ANN,Subtype=/Widget,Raw=/TU (Interstellar radiation field\textCR(\pc@goptd@deadline)) /T (tooltip zref@203) /C [ ] /FT/Btn /F 768 /Ff 65536 /H/N /BS ¡¡ /W 0 ¿¿ also has a consequence on the accuracy with which represents the true \HyColor@XZeroOneThreeFour\pc@goptd@color\pc@hyenc@colorpdfcommentcolor\HyColor@XZeroOneThreeFour\pc@goptd@fontcolor\pc@hyenc@fontcolorpdfcommentcolor\HyColor@XZeroOneThreeFour\pc@goptd@icolor\pc@hyenc@icolorpdfcommentcolor\pdfmark[UV]pdfmark=/ANN,Subtype=/Widget,Raw=/TU (Ultraviolet\textCR(\pc@goptd@deadline)) /T (tooltip zref@204) /C [ ] /FT/Btn /F 768 /Ff 65536 /H/N /BS ¡¡ /W 0 ¿¿ , \HyColor@XZeroOneThreeFour\pc@goptd@color\pc@hyenc@colorpdfcommentcolor\HyColor@XZeroOneThreeFour\pc@goptd@fontcolor\pc@hyenc@fontcolorpdfcommentcolor\HyColor@XZeroOneThreeFour\pc@goptd@icolor\pc@hyenc@icolorpdfcommentcolor\pdfmark[PE]pdfmark=/ANN,Subtype=/Widget,Raw=/TU (Photoelectric\textCR(\pc@goptd@deadline)) /T (tooltip zref@205) /C [ ] /FT/Btn /F 768 /Ff 65536 /H/N /BS ¡¡ /W 0 ¿¿ -efficient flux. Indeed, Kapala et al. (2017) showed that the variations of in M 31 could be explained by the contribution of old stars to . Finally, one of the most puzzling features is that is higher at low metallicity (Poglitsch et al., 1995; Madden et al., 1997; Cormier et al., 2015; Smith et al., 2017), while the \HyColor@XZeroOneThreeFour\pc@goptd@color\pc@hyenc@colorpdfcommentcolor\HyColor@XZeroOneThreeFour\pc@goptd@fontcolor\pc@hyenc@fontcolorpdfcommentcolor\HyColor@XZeroOneThreeFour\pc@goptd@icolor\pc@hyenc@icolorpdfcommentcolor\pdfmark[UIB]pdfmark=/ANN,Subtype=/Widget,Raw=/TU (Unidentified infrared band\textCR(\pc@goptd@deadline)) /T (tooltip zref@206) /C [ ] /FT/Btn /F 768 /Ff 65536 /H/N /BS ¡¡ /W 0 ¿¿ strength drops in these systems (Section 9.3.4). This is currently poorly understood. However, in the extreme case of I Zw 18 (), where no \HyColor@XZeroOneThreeFour\pc@goptd@color\pc@hyenc@colorpdfcommentcolor\HyColor@XZeroOneThreeFour\pc@goptd@fontcolor\pc@hyenc@fontcolorpdfcommentcolor\HyColor@XZeroOneThreeFour\pc@goptd@icolor\pc@hyenc@icolorpdfcommentcolor\pdfmark[UIB]pdfmark=/ANN,Subtype=/Widget,Raw=/TU (Unidentified infrared band\textCR(\pc@goptd@deadline)) /T (tooltip zref@207) /C [ ] /FT/Btn /F 768 /Ff 65536 /H/N /BS ¡¡ /W 0 ¿¿ is detected and the \HyColor@XZeroOneThreeFour\pc@goptd@color\pc@hyenc@colorpdfcommentcolor\HyColor@XZeroOneThreeFour\pc@goptd@fontcolor\pc@hyenc@fontcolorpdfcommentcolor\HyColor@XZeroOneThreeFour\pc@goptd@icolor\pc@hyenc@icolorpdfcommentcolor\pdfmark[PE]pdfmark=/ANN,Subtype=/Widget,Raw=/TU (Photoelectric\textCR(\pc@goptd@deadline)) /T (tooltip zref@208) /C [ ] /FT/Btn /F 768 /Ff 65536 /H/N /BS ¡¡ /W 0 ¿¿ heating is estimated to be negligible, the gas-cooling-to-\HyColor@XZeroOneThreeFour\pc@goptd@color\pc@hyenc@colorpdfcommentcolor\HyColor@XZeroOneThreeFour\pc@goptd@fontcolor\pc@hyenc@fontcolorpdfcommentcolor\HyColor@XZeroOneThreeFour\pc@goptd@icolor\pc@hyenc@icolorpdfcommentcolor\pdfmark[TIR]pdfmark=/ANN,Subtype=/Widget,Raw=/TU (Total infrared\textCR(\pc@goptd@deadline)) /T (tooltip zref@209) /C [ ] /FT/Btn /F 768 /Ff 65536 /H/N /BS ¡¡ /W 0 ¿¿ ratio is still (Lebouteiller et al., 2017). In this instance, the gas could be heated by X-rays.
Now, studies focusing on the gas properties usually run \HyColor@XZeroOneThreeFour\pc@goptd@color\pc@hyenc@colorpdfcommentcolor\HyColor@XZeroOneThreeFour\pc@goptd@fontcolor\pc@hyenc@fontcolorpdfcommentcolor\HyColor@XZeroOneThreeFour\pc@goptd@icolor\pc@hyenc@icolorpdfcommentcolor\pdfmark[PDR]pdfmark=/ANN,Subtype=/Widget,Raw=/TU (Photodissociation region\textCR(\pc@goptd@deadline)) /T (tooltip zref@210) /C [ ] /FT/Btn /F 768 /Ff 65536 /H/N /BS ¡¡ /W 0 ¿¿ models with build-in \HyColor@XZeroOneThreeFour\pc@goptd@color\pc@hyenc@colorpdfcommentcolor\HyColor@XZeroOneThreeFour\pc@goptd@fontcolor\pc@hyenc@fontcolorpdfcommentcolor\HyColor@XZeroOneThreeFour\pc@goptd@icolor\pc@hyenc@icolorpdfcommentcolor\pdfmark[PE]pdfmark=/ANN,Subtype=/Widget,Raw=/TU (Photoelectric\textCR(\pc@goptd@deadline)) /T (tooltip zref@211) /C [ ] /FT/Btn /F 768 /Ff 65536 /H/N /BS ¡¡ /W 0 ¿¿ -efficiency (e.g. Le Petit et al., 2006). In this case, dust parameters such as , the visual attenuation or the \HyColor@XZeroOneThreeFour\pc@goptd@color\pc@hyenc@colorpdfcommentcolor\HyColor@XZeroOneThreeFour\pc@goptd@fontcolor\pc@hyenc@fontcolorpdfcommentcolor\HyColor@XZeroOneThreeFour\pc@goptd@icolor\pc@hyenc@icolorpdfcommentcolor\pdfmark[UIB]pdfmark=/ANN,Subtype=/Widget,Raw=/TU (Unidentified infrared band\textCR(\pc@goptd@deadline)) /T (tooltip zref@212) /C [ ] /FT/Btn /F 768 /Ff 65536 /H/N /BS ¡¡ /W 0 ¿¿ strength help refine the gas modelling (e.g. Chevance et al., 2016).
6 CONSTRAINTS ON THE MICROSCOPIC DUST PROPERTIES
6.1 The Infrared Emission
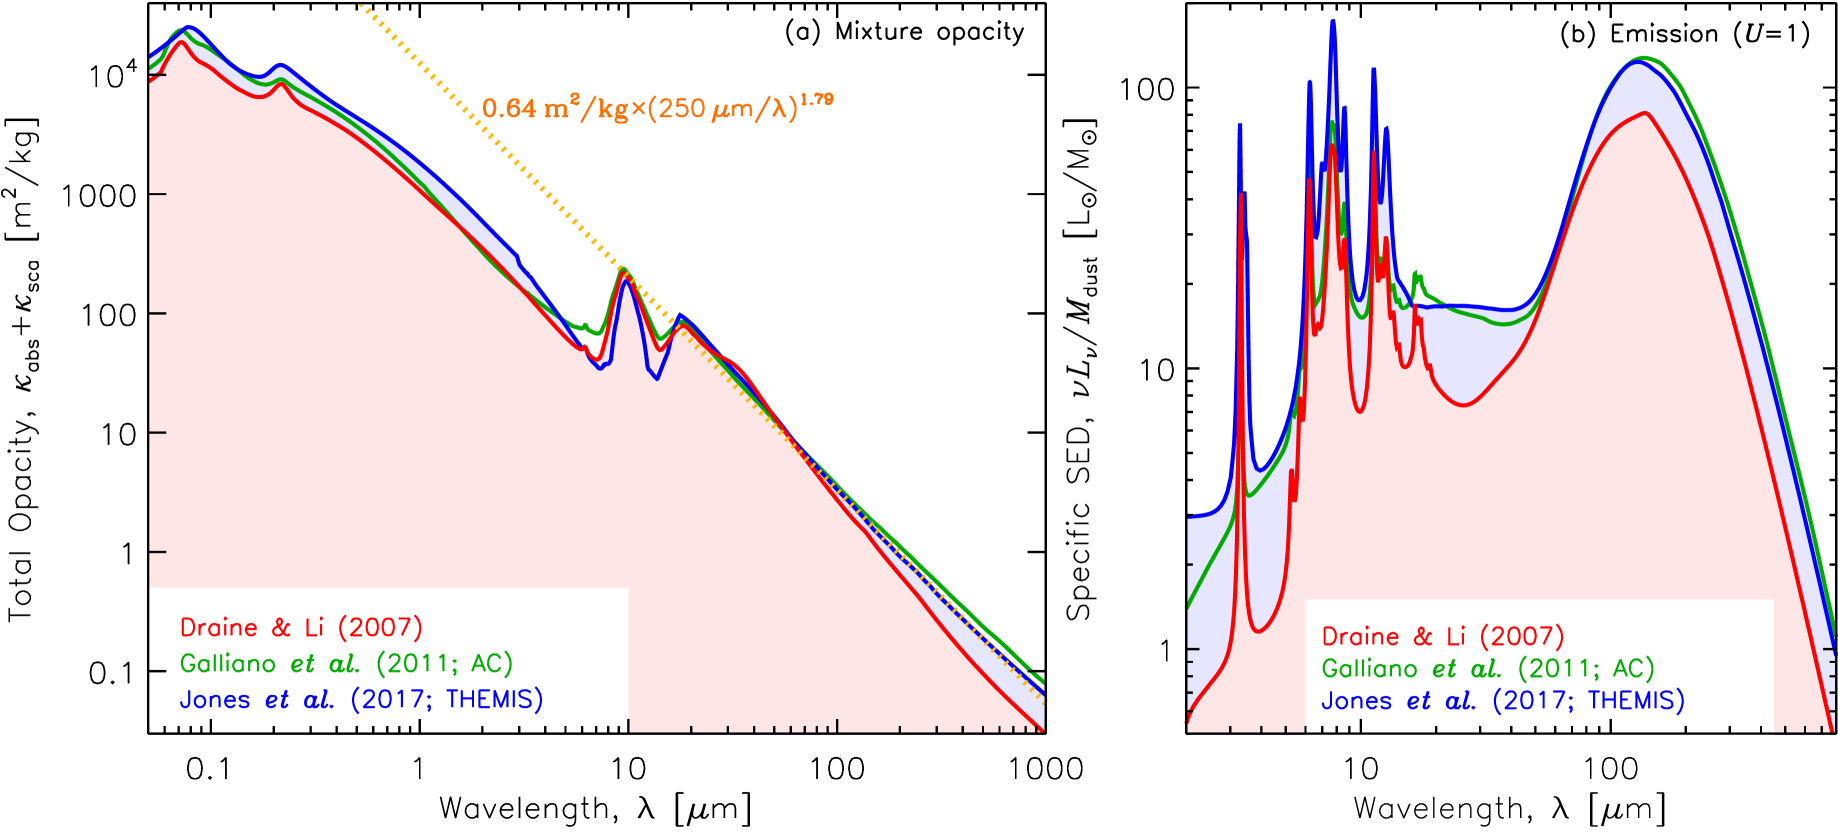
6.1.1 Constraints on the FIR Grain Opacity
The dust mass and excitation derived from fits of the \HyColor@XZeroOneThreeFour\pc@goptd@color\pc@hyenc@colorpdfcommentcolor\HyColor@XZeroOneThreeFour\pc@goptd@fontcolor\pc@hyenc@fontcolorpdfcommentcolor\HyColor@XZeroOneThreeFour\pc@goptd@icolor\pc@hyenc@icolorpdfcommentcolor\pdfmark[SED]pdfmark=/ANN,Subtype=/Widget,Raw=/TU (Spectral energy distribution\textCR(\pc@goptd@deadline)) /T (tooltip zref@213) /C [ ] /FT/Btn /F 768 /Ff 65536 /H/N /BS ¡¡ /W 0 ¿¿ depend directly on the assumed grain opacity. To first order, it can be approximated by a power-law, in the \HyColor@XZeroOneThreeFour\pc@goptd@color\pc@hyenc@colorpdfcommentcolor\HyColor@XZeroOneThreeFour\pc@goptd@fontcolor\pc@hyenc@fontcolorpdfcommentcolor\HyColor@XZeroOneThreeFour\pc@goptd@icolor\pc@hyenc@icolorpdfcommentcolor\pdfmark[FIR]pdfmark=/ANN,Subtype=/Widget,Raw=/TU (Far-infrared\textCR(\pc@goptd@deadline)) /T (tooltip zref@214) /C [ ] /FT/Btn /F 768 /Ff 65536 /H/N /BS ¡¡ /W 0 ¿¿ /\HyColor@XZeroOneThreeFour\pc@goptd@color\pc@hyenc@colorpdfcommentcolor\HyColor@XZeroOneThreeFour\pc@goptd@fontcolor\pc@hyenc@fontcolorpdfcommentcolor\HyColor@XZeroOneThreeFour\pc@goptd@icolor\pc@hyenc@icolorpdfcommentcolor\pdfmark[submm]pdfmark=/ANN,Subtype=/Widget,Raw=/TU (Submillimeter\textCR(\pc@goptd@deadline)) /T (tooltip zref@215) /C [ ] /FT/Btn /F 768 /Ff 65536 /H/N /BS ¡¡ /W 0 ¿¿ (Figure 4a). Most studies assume a fixed absolute opacity, , and explore the variations of the emissivity index, \HyColor@XZeroOneThreeFour\pc@goptd@color\pc@hyenc@colorpdfcommentcolor\HyColor@XZeroOneThreeFour\pc@goptd@fontcolor\pc@hyenc@fontcolorpdfcommentcolor\HyColor@XZeroOneThreeFour\pc@goptd@icolor\pc@hyenc@icolorpdfcommentcolor\pdfmark[]pdfmark=/ANN,Subtype=/Widget,Raw=/TU (Emissivity index (power-law index of a modified black body)\textCR(\pc@goptd@deadline)) /T (tooltip zref@216) /C [ ] /FT/Btn /F 768 /Ff 65536 /H/N /BS ¡¡ /W 0 ¿¿ .
| Milky Way | M 31 | LMC | SMC | |
|---|---|---|---|---|
| K | K | K | K | |
| Reference | Planck () | Planck () | Planck () | Planck () |
6.1.1.1 Studies of the emissivity index
There are numerous publications presenting \HyColor@XZeroOneThreeFour\pc@goptd@color\pc@hyenc@colorpdfcommentcolor\HyColor@XZeroOneThreeFour\pc@goptd@fontcolor\pc@hyenc@fontcolorpdfcommentcolor\HyColor@XZeroOneThreeFour\pc@goptd@icolor\pc@hyenc@icolorpdfcommentcolor\pdfmark[MBB]pdfmark=/ANN,Subtype=/Widget,Raw=/TU (Modified black body\textCR(\pc@goptd@deadline)) /T (tooltip zref@217) /C [ ] /FT/Btn /F 768 /Ff 65536 /H/N /BS ¡¡ /W 0 ¿¿ fits of nearby galaxies. However, as discussed in Section 4.1.1, the derived \HyColor@XZeroOneThreeFour\pc@goptd@color\pc@hyenc@colorpdfcommentcolor\HyColor@XZeroOneThreeFour\pc@goptd@fontcolor\pc@hyenc@fontcolorpdfcommentcolor\HyColor@XZeroOneThreeFour\pc@goptd@icolor\pc@hyenc@icolorpdfcommentcolor\pdfmark[]pdfmark=/ANN,Subtype=/Widget,Raw=/TU (Effective emissivity index (fitted value of beta)\textCR(\pc@goptd@deadline)) /T (tooltip zref@218) /C [ ] /FT/Btn /F 768 /Ff 65536 /H/N /BS ¡¡ /W 0 ¿¿ is degenerate with temperature mixing. The best constraints on the intrinsic \HyColor@XZeroOneThreeFour\pc@goptd@color\pc@hyenc@colorpdfcommentcolor\HyColor@XZeroOneThreeFour\pc@goptd@fontcolor\pc@hyenc@fontcolorpdfcommentcolor\HyColor@XZeroOneThreeFour\pc@goptd@icolor\pc@hyenc@icolorpdfcommentcolor\pdfmark[]pdfmark=/ANN,Subtype=/Widget,Raw=/TU (Emissivity index (power-law index of a modified black body)\textCR(\pc@goptd@deadline)) /T (tooltip zref@219) /C [ ] /FT/Btn /F 768 /Ff 65536 /H/N /BS ¡¡ /W 0 ¿¿ are obtained in the submm regime, where only massive amounts of very cold dust ( K) could bias the value. Table 1 lists \HyColor@XZeroOneThreeFour\pc@goptd@color\pc@hyenc@colorpdfcommentcolor\HyColor@XZeroOneThreeFour\pc@goptd@fontcolor\pc@hyenc@fontcolorpdfcommentcolor\HyColor@XZeroOneThreeFour\pc@goptd@icolor\pc@hyenc@icolorpdfcommentcolor\pdfmark[]pdfmark=/ANN,Subtype=/Widget,Raw=/TU (Effective emissivity index (fitted value of beta)\textCR(\pc@goptd@deadline)) /T (tooltip zref@220) /C [ ] /FT/Btn /F 768 /Ff 65536 /H/N /BS ¡¡ /W 0 ¿¿ for several objects, obtained with \HyColor@XZeroOneThreeFour\pc@goptd@color\pc@hyenc@colorpdfcommentcolor\HyColor@XZeroOneThreeFour\pc@goptd@fontcolor\pc@hyenc@fontcolorpdfcommentcolor\HyColor@XZeroOneThreeFour\pc@goptd@icolor\pc@hyenc@icolorpdfcommentcolor\pdfmark[Planck]pdfmark=/ANN,Subtype=/Widget,Raw=/TU (Planck space observatory (300 microns-1 cm; 2009-2013)\textCR(\pc@goptd@deadline)) /T (tooltip zref@221) /C [ ] /FT/Btn /F 768 /Ff 65536 /H/N /BS ¡¡ /W 0 ¿¿ , with constraints up to . It appears that all the values are lower than 2, and that low-\HyColor@XZeroOneThreeFour\pc@goptd@color\pc@hyenc@colorpdfcommentcolor\HyColor@XZeroOneThreeFour\pc@goptd@fontcolor\pc@hyenc@fontcolorpdfcommentcolor\HyColor@XZeroOneThreeFour\pc@goptd@icolor\pc@hyenc@icolorpdfcommentcolor\pdfmark[]pdfmark=/ANN,Subtype=/Widget,Raw=/TU (Metallicity\textCR(\pc@goptd@deadline)) /T (tooltip zref@222) /C [ ] /FT/Btn /F 768 /Ff 65536 /H/N /BS ¡¡ /W 0 ¿¿ systems have a lower \HyColor@XZeroOneThreeFour\pc@goptd@color\pc@hyenc@colorpdfcommentcolor\HyColor@XZeroOneThreeFour\pc@goptd@fontcolor\pc@hyenc@fontcolorpdfcommentcolor\HyColor@XZeroOneThreeFour\pc@goptd@icolor\pc@hyenc@icolorpdfcommentcolor\pdfmark[]pdfmark=/ANN,Subtype=/Widget,Raw=/TU (Effective emissivity index (fitted value of beta)\textCR(\pc@goptd@deadline)) /T (tooltip zref@223) /C [ ] /FT/Btn /F 768 /Ff 65536 /H/N /BS ¡¡ /W 0 ¿¿ than higher \HyColor@XZeroOneThreeFour\pc@goptd@color\pc@hyenc@colorpdfcommentcolor\HyColor@XZeroOneThreeFour\pc@goptd@fontcolor\pc@hyenc@fontcolorpdfcommentcolor\HyColor@XZeroOneThreeFour\pc@goptd@icolor\pc@hyenc@icolorpdfcommentcolor\pdfmark[]pdfmark=/ANN,Subtype=/Widget,Raw=/TU (Metallicity\textCR(\pc@goptd@deadline)) /T (tooltip zref@224) /C [ ] /FT/Btn /F 768 /Ff 65536 /H/N /BS ¡¡ /W 0 ¿¿ galaxies. Boselli et al. (2012) studying a volume-limited sample with \HyColor@XZeroOneThreeFour\pc@goptd@color\pc@hyenc@colorpdfcommentcolor\HyColor@XZeroOneThreeFour\pc@goptd@fontcolor\pc@hyenc@fontcolorpdfcommentcolor\HyColor@XZeroOneThreeFour\pc@goptd@icolor\pc@hyenc@icolorpdfcommentcolor\pdfmark[Herschel]pdfmark=/ANN,Subtype=/Widget,Raw=/TU (Herschel space observatory (55-672 microns; 2009-2013)\textCR(\pc@goptd@deadline)) /T (tooltip zref@225) /C [ ] /FT/Btn /F 768 /Ff 65536 /H/N /BS ¡¡ /W 0 ¿¿ (up to ) also found an average , and hinted that low-\HyColor@XZeroOneThreeFour\pc@goptd@color\pc@hyenc@colorpdfcommentcolor\HyColor@XZeroOneThreeFour\pc@goptd@fontcolor\pc@hyenc@fontcolorpdfcommentcolor\HyColor@XZeroOneThreeFour\pc@goptd@icolor\pc@hyenc@icolorpdfcommentcolor\pdfmark[]pdfmark=/ANN,Subtype=/Widget,Raw=/TU (Metallicity\textCR(\pc@goptd@deadline)) /T (tooltip zref@226) /C [ ] /FT/Btn /F 768 /Ff 65536 /H/N /BS ¡¡ /W 0 ¿¿ objects tends to have . In M 33, \HyColor@XZeroOneThreeFour\pc@goptd@color\pc@hyenc@colorpdfcommentcolor\HyColor@XZeroOneThreeFour\pc@goptd@fontcolor\pc@hyenc@fontcolorpdfcommentcolor\HyColor@XZeroOneThreeFour\pc@goptd@icolor\pc@hyenc@icolorpdfcommentcolor\pdfmark[]pdfmark=/ANN,Subtype=/Widget,Raw=/TU (Effective emissivity index (fitted value of beta)\textCR(\pc@goptd@deadline)) /T (tooltip zref@227) /C [ ] /FT/Btn /F 768 /Ff 65536 /H/N /BS ¡¡ /W 0 ¿¿ derived from Herschel observations is around 2 in the center and decreases down to 1.3 in the outer parts (Tabatabaei et al., 2014). On the other hand, the outer regions of M 31 exhibit a steeper slope () than in its center (Draine et al., 2014). This contradictory behaviour does not appear to originate in fit biases, as both increasing and decreasing trends of \HyColor@XZeroOneThreeFour\pc@goptd@color\pc@hyenc@colorpdfcommentcolor\HyColor@XZeroOneThreeFour\pc@goptd@fontcolor\pc@hyenc@fontcolorpdfcommentcolor\HyColor@XZeroOneThreeFour\pc@goptd@icolor\pc@hyenc@icolorpdfcommentcolor\pdfmark[]pdfmark=/ANN,Subtype=/Widget,Raw=/TU (Effective emissivity index (fitted value of beta)\textCR(\pc@goptd@deadline)) /T (tooltip zref@228) /C [ ] /FT/Btn /F 768 /Ff 65536 /H/N /BS ¡¡ /W 0 ¿¿ with radius are found in the sample of Hunt et al. (2015). ††margin: \entry Planck\HyColor@XZeroOneThreeFour\pc@goptd@color\pc@hyenc@colorpdfcommentcolor\HyColor@XZeroOneThreeFour\pc@goptd@fontcolor\pc@hyenc@fontcolorpdfcommentcolor\HyColor@XZeroOneThreeFour\pc@goptd@icolor\pc@hyenc@icolorpdfcommentcolor\pdfmark[FIR]pdfmark=/ANN,Subtype=/Widget,Raw=/TU (Far-infrared\textCR(\pc@goptd@deadline)) /T (tooltip zref@229) /C [ ] /FT/Btn /F 768 /Ff 65536 /H/N /BS ¡¡ /W 0 ¿¿ –cm space telescope (cm; ).
6.1.1.2 Constraints on the absolute opacity
The absolute opacity, , is totally degenerate with (Equation 2). The only way to constrain this quantity is to have an independent estimate of . For instance, Galliano et al. (2011) modelled the IR emission of a strip covering 1/4 of the \HyColor@XZeroOneThreeFour\pc@goptd@color\pc@hyenc@colorpdfcommentcolor\HyColor@XZeroOneThreeFour\pc@goptd@fontcolor\pc@hyenc@fontcolorpdfcommentcolor\HyColor@XZeroOneThreeFour\pc@goptd@icolor\pc@hyenc@icolorpdfcommentcolor\pdfmark[LMC]pdfmark=/ANN,Subtype=/Widget,Raw=/TU (Large Magellanic cloud\textCR(\pc@goptd@deadline)) /T (tooltip zref@230) /C [ ] /FT/Btn /F 768 /Ff 65536 /H/N /BS ¡¡ /W 0 ¿¿ , using optical properties similar to Draine & Li (2007, hereafter DL07). The resulting dust-to-gas mass ratio was higher than the maximum number of elements that could be locked-up in grains. It led them to propose a more emissive mixture (Figure 4) that could solve this inconsistency. The constraint on the elemental depletions was thus used to show should be a factor of higher. Quite similarly, Planck Collaboration et al. (2016) modelled the all sky dust emission using the DL07 model. However, the estimated along the sightlines of quasars was systematically lower than their dust-emission-derived . Their comparison of emission and extinction thus indicates that the Galactic opacity should also be a factor of higher. Finally, in M 31, Dalcanton et al. (2015) derived a high spatial resolution map of . As in the Galaxy, the emission-derived map (Draine et al., 2014) is found to be a factor of higher. We emphasize that, although each of these studies found evidence of local variations of the emissivity as a function of the density (cf. Section 9.2.1), the overall opacity seems to be scaled up compared to DL07. There is growing evidence that the dust opacities might be, in general, more emissive than standard uncoated compact silicate-graphite mixtures.
6.1.2 The Aromatic Feature Spectrum
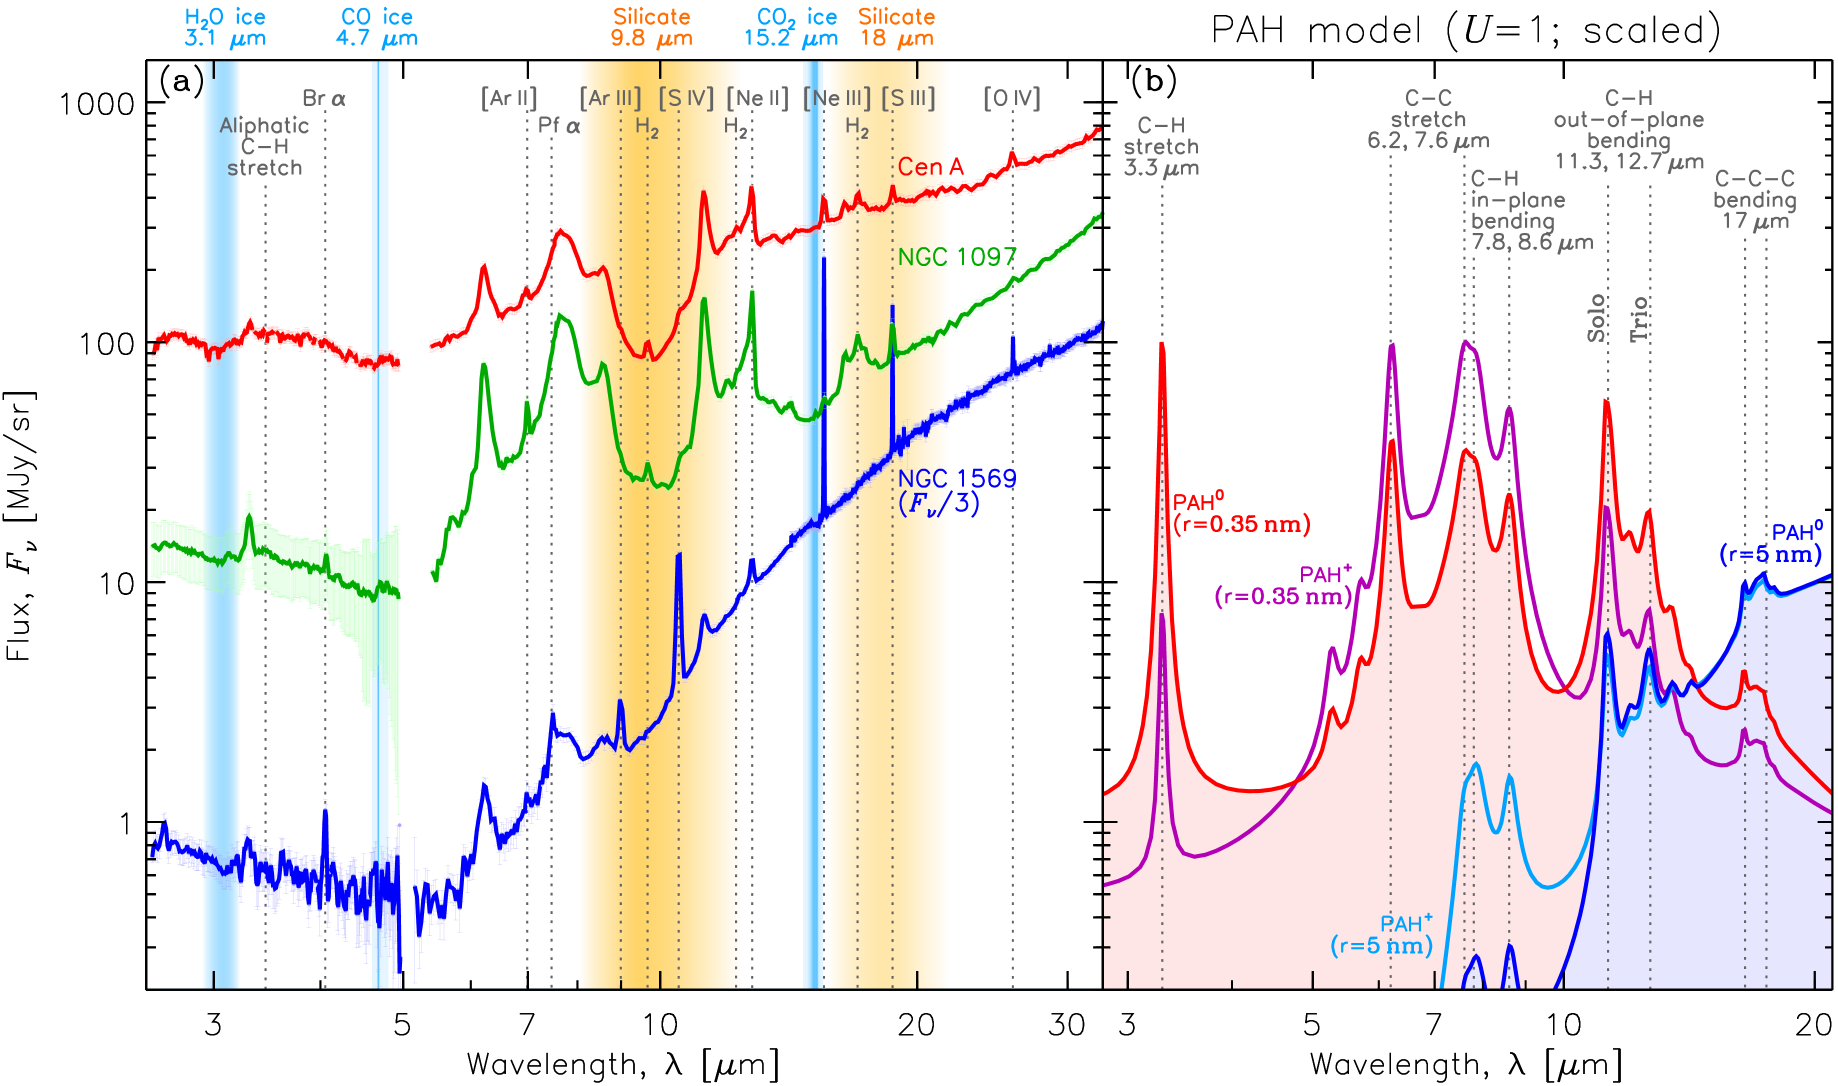
The \HyColor@XZeroOneThreeFour\pc@goptd@color\pc@hyenc@colorpdfcommentcolor\HyColor@XZeroOneThreeFour\pc@goptd@fontcolor\pc@hyenc@fontcolorpdfcommentcolor\HyColor@XZeroOneThreeFour\pc@goptd@icolor\pc@hyenc@icolorpdfcommentcolor\pdfmark[MIR]pdfmark=/ANN,Subtype=/Widget,Raw=/TU (Mid-infrared\textCR(\pc@goptd@deadline)) /T (tooltip zref@235) /C [ ] /FT/Btn /F 768 /Ff 65536 /H/N /BS ¡¡ /W 0 ¿¿ range exhibits a complex spectrum of ubiquitous emission bands, that were originally labeled as \HyColor@XZeroOneThreeFour\pc@goptd@color\pc@hyenc@colorpdfcommentcolor\HyColor@XZeroOneThreeFour\pc@goptd@fontcolor\pc@hyenc@fontcolorpdfcommentcolor\HyColor@XZeroOneThreeFour\pc@goptd@icolor\pc@hyenc@icolorpdfcommentcolor\pdfmark[UIB]pdfmark=/ANN,Subtype=/Widget,Raw=/TU (Unidentified infrared band\textCR(\pc@goptd@deadline)) /T (tooltip zref@236) /C [ ] /FT/Btn /F 768 /Ff 65536 /H/N /BS ¡¡ /W 0 ¿¿ s (Figure 5). These bands are found in almost every environment. They were first detected in Galactic planetary nebulae (Gillett, Forrest & Merrill, 1973). Their relative intensity appeared independent of position in reflection nebulae, leading to the conclusion that they were carried by very small, stochastically heated particles (Sellgren, 1984). ††margin: \entry Akarispace telescope (; ).
6.1.2.1 Candidate materials
It is consensual, nowadays, that the \HyColor@XZeroOneThreeFour\pc@goptd@color\pc@hyenc@colorpdfcommentcolor\HyColor@XZeroOneThreeFour\pc@goptd@fontcolor\pc@hyenc@fontcolorpdfcommentcolor\HyColor@XZeroOneThreeFour\pc@goptd@icolor\pc@hyenc@icolorpdfcommentcolor\pdfmark[UIB]pdfmark=/ANN,Subtype=/Widget,Raw=/TU (Unidentified infrared band\textCR(\pc@goptd@deadline)) /T (tooltip zref@237) /C [ ] /FT/Btn /F 768 /Ff 65536 /H/N /BS ¡¡ /W 0 ¿¿ s arise from the vibrational spectrum of a collection of aromatic bonds in a hydrocarbon matrix (the weak feature is attributed to aliphatic bonds; Duley & Williams, 1981). \HyColor@XZeroOneThreeFour\pc@goptd@color\pc@hyenc@colorpdfcommentcolor\HyColor@XZeroOneThreeFour\pc@goptd@fontcolor\pc@hyenc@fontcolorpdfcommentcolor\HyColor@XZeroOneThreeFour\pc@goptd@icolor\pc@hyenc@icolorpdfcommentcolor\pdfmark[PAH]pdfmark=/ANN,Subtype=/Widget,Raw=/TU (Polycyclic aromatic hydrocarbon\textCR(\pc@goptd@deadline)) /T (tooltip zref@238) /C [ ] /FT/Btn /F 768 /Ff 65536 /H/N /BS ¡¡ /W 0 ¿¿ s were proposed by Léger & Puget (1984) and Allamandola, Tielens & Barker (1985). The \HyColor@XZeroOneThreeFour\pc@goptd@color\pc@hyenc@colorpdfcommentcolor\HyColor@XZeroOneThreeFour\pc@goptd@fontcolor\pc@hyenc@fontcolorpdfcommentcolor\HyColor@XZeroOneThreeFour\pc@goptd@icolor\pc@hyenc@icolorpdfcommentcolor\pdfmark[UIB]pdfmark=/ANN,Subtype=/Widget,Raw=/TU (Unidentified infrared band\textCR(\pc@goptd@deadline)) /T (tooltip zref@239) /C [ ] /FT/Btn /F 768 /Ff 65536 /H/N /BS ¡¡ /W 0 ¿¿ s likely arise from a statistical mixing of \HyColor@XZeroOneThreeFour\pc@goptd@color\pc@hyenc@colorpdfcommentcolor\HyColor@XZeroOneThreeFour\pc@goptd@fontcolor\pc@hyenc@fontcolorpdfcommentcolor\HyColor@XZeroOneThreeFour\pc@goptd@icolor\pc@hyenc@icolorpdfcommentcolor\pdfmark[PAH]pdfmark=/ANN,Subtype=/Widget,Raw=/TU (Polycyclic aromatic hydrocarbon\textCR(\pc@goptd@deadline)) /T (tooltip zref@240) /C [ ] /FT/Btn /F 768 /Ff 65536 /H/N /BS ¡¡ /W 0 ¿¿ s of different sizes and structure, averaging out drastic variations of the band profiles. Most studies interpret their \HyColor@XZeroOneThreeFour\pc@goptd@color\pc@hyenc@colorpdfcommentcolor\HyColor@XZeroOneThreeFour\pc@goptd@fontcolor\pc@hyenc@fontcolorpdfcommentcolor\HyColor@XZeroOneThreeFour\pc@goptd@icolor\pc@hyenc@icolorpdfcommentcolor\pdfmark[MIR]pdfmark=/ANN,Subtype=/Widget,Raw=/TU (Mid-infrared\textCR(\pc@goptd@deadline)) /T (tooltip zref@241) /C [ ] /FT/Btn /F 768 /Ff 65536 /H/N /BS ¡¡ /W 0 ¿¿ spectra, in light of this class of molecules. The main physical processes controlling the shape of the \HyColor@XZeroOneThreeFour\pc@goptd@color\pc@hyenc@colorpdfcommentcolor\HyColor@XZeroOneThreeFour\pc@goptd@fontcolor\pc@hyenc@fontcolorpdfcommentcolor\HyColor@XZeroOneThreeFour\pc@goptd@icolor\pc@hyenc@icolorpdfcommentcolor\pdfmark[PAH]pdfmark=/ANN,Subtype=/Widget,Raw=/TU (Polycyclic aromatic hydrocarbon\textCR(\pc@goptd@deadline)) /T (tooltip zref@242) /C [ ] /FT/Btn /F 768 /Ff 65536 /H/N /BS ¡¡ /W 0 ¿¿ spectrum are the following.
- Charge.
-
\HyColor@XZeroOneThreeFour\pc
@goptd@color\pc@hyenc@colorpdfcommentcolor\HyColor@XZeroOneThreeFour\pc@goptd@fontcolor\pc@hyenc@fontcolorpdfcommentcolor\HyColor@XZeroOneThreeFour\pc@goptd@icolor\pc@hyenc@icolorpdfcommentcolor\pdfmark[PAH]pdfmark=/ANN,Subtype=/Widget,Raw=/TU (Polycyclic aromatic hydrocarbon\textCR(\pc@goptd@deadline)) /T (tooltip zref@243) /C [ ] /FT/Btn /F 768 /Ff 65536 /H/N /BS ¡¡ /W 0 ¿¿ + have brighter features than \HyColor@XZeroOneThreeFour\pc@goptd@color\pc@hyenc@colorpdfcommentcolor\HyColor@XZeroOneThreeFour\pc@goptd@fontcolor\pc@hyenc@fontcolorpdfcommentcolor\HyColor@XZeroOneThreeFour\pc@goptd@icolor\pc@hyenc@icolorpdfcommentcolor\pdfmark[PAH]pdfmark=/ANN,Subtype=/Widget,Raw=/TU (Polycyclic aromatic hydrocarbon\textCR(\pc@goptd@deadline)) /T (tooltip zref@244) /C [ ] /FT/Btn /F 768 /Ff 65536 /H/N /BS ¡¡ /W 0 ¿¿ 0, and inversely for the other bands (Figure 5-b). Select band ratios, such as \HyColor@XZeroOneThreeFour\pc@goptd@color\pc@hyenc@colorpdfcommentcolor\HyColor@XZeroOneThreeFour\pc@goptd@fontcolor\pc@hyenc@fontcolorpdfcommentcolor\HyColor@XZeroOneThreeFour\pc@goptd@icolor\pc@hyenc@icolorpdfcommentcolor\pdfmark[]pdfmark=/ANN,Subtype=/Widget,Raw=/TU (Integrated luminosity of the 7.7 micron feature (Lsun)\textCR(\pc@goptd@deadline)) /T (tooltip zref@245) /C [ ] /FT/Btn /F 768 /Ff 65536 /H/N /BS ¡¡ /W 0 ¿¿ /\HyColor@XZeroOneThreeFour\pc@goptd@color\pc@hyenc@colorpdfcommentcolor\HyColor@XZeroOneThreeFour\pc@goptd@fontcolor\pc@hyenc@fontcolorpdfcommentcolor\HyColor@XZeroOneThreeFour\pc@goptd@icolor\pc@hyenc@icolorpdfcommentcolor\pdfmark[]pdfmark=/ANN,Subtype=/Widget,Raw=/TU (Integrated luminosity of the 11.3 micron feature (Lsun)\textCR(\pc@goptd@deadline)) /T (tooltip zref@246) /C [ ] /FT/Btn /F 768 /Ff 65536 /H/N /BS ¡¡ /W 0 ¿¿ , increase with the charge.
- Size distribution.
-
Small \HyColor@XZeroOneThreeFour\pc@goptd@color\pc@hyenc@colorpdfcommentcolor\HyColor@XZeroOneThreeFour\pc@goptd@fontcolor\pc@hyenc@fontcolorpdfcommentcolor\HyColor@XZeroOneThreeFour\pc@goptd@icolor\pc@hyenc@icolorpdfcommentcolor\pdfmark[PAH]pdfmark=/ANN,Subtype=/Widget,Raw=/TU (Polycyclic aromatic hydrocarbon\textCR(\pc@goptd@deadline)) /T (tooltip zref@247) /C [ ] /FT/Btn /F 768 /Ff 65536 /H/N /BS ¡¡ /W 0 ¿¿ s fluctuate up to temperatures higher than the large ones. Short wavelength bands are therefore more pumped in small \HyColor@XZeroOneThreeFour\pc@goptd@color\pc@hyenc@colorpdfcommentcolor\HyColor@XZeroOneThreeFour\pc@goptd@fontcolor\pc@hyenc@fontcolorpdfcommentcolor\HyColor@XZeroOneThreeFour\pc@goptd@icolor\pc@hyenc@icolorpdfcommentcolor\pdfmark[PAH]pdfmark=/ANN,Subtype=/Widget,Raw=/TU (Polycyclic aromatic hydrocarbon\textCR(\pc@goptd@deadline)) /T (tooltip zref@248) /C [ ] /FT/Btn /F 768 /Ff 65536 /H/N /BS ¡¡ /W 0 ¿¿ s, while large \HyColor@XZeroOneThreeFour\pc@goptd@color\pc@hyenc@colorpdfcommentcolor\HyColor@XZeroOneThreeFour\pc@goptd@fontcolor\pc@hyenc@fontcolorpdfcommentcolor\HyColor@XZeroOneThreeFour\pc@goptd@icolor\pc@hyenc@icolorpdfcommentcolor\pdfmark[PAH]pdfmark=/ANN,Subtype=/Widget,Raw=/TU (Polycyclic aromatic hydrocarbon\textCR(\pc@goptd@deadline)) /T (tooltip zref@249) /C [ ] /FT/Btn /F 768 /Ff 65536 /H/N /BS ¡¡ /W 0 ¿¿ s emit predominantly long wavelength features (Figure 5-b).
- ISRF hardness.
-
The hardness of the \HyColor@XZeroOneThreeFour\pc@goptd@color\pc@hyenc@colorpdfcommentcolor\HyColor@XZeroOneThreeFour\pc@goptd@fontcolor\pc@hyenc@fontcolorpdfcommentcolor\HyColor@XZeroOneThreeFour\pc@goptd@icolor\pc@hyenc@icolorpdfcommentcolor\pdfmark[ISRF]pdfmark=/ANN,Subtype=/Widget,Raw=/TU (Interstellar radiation field\textCR(\pc@goptd@deadline)) /T (tooltip zref@250) /C [ ] /FT/Btn /F 768 /Ff 65536 /H/N /BS ¡¡ /W 0 ¿¿ has an effect similar to the size, as a higher mean photon energy causes the grain to fluctuate up to higher temperatures (e.g. Galliano et al., 2008, hereafter G08b).
- Molecular structure.
-
C–H out-of-plane bending modes have different frequencies, depending on the number of H atom per aromatic cycle. The band corresponds to a solo H, found on straight molecular edges, while the one corresponds to a trio, found on corners of the molecules (Figure 5-b). The solo/trio \HyColor@XZeroOneThreeFour\pc@goptd@color\pc@hyenc@colorpdfcommentcolor\HyColor@XZeroOneThreeFour\pc@goptd@fontcolor\pc@hyenc@fontcolorpdfcommentcolor\HyColor@XZeroOneThreeFour\pc@goptd@icolor\pc@hyenc@icolorpdfcommentcolor\pdfmark[]pdfmark=/ANN,Subtype=/Widget,Raw=/TU (Integrated luminosity of the 11.3 micron feature (Lsun)\textCR(\pc@goptd@deadline)) /T (tooltip zref@251) /C [ ] /FT/Btn /F 768 /Ff 65536 /H/N /BS ¡¡ /W 0 ¿¿ /\HyColor@XZeroOneThreeFour\pc@goptd@color\pc@hyenc@colorpdfcommentcolor\HyColor@XZeroOneThreeFour\pc@goptd@fontcolor\pc@hyenc@fontcolorpdfcommentcolor\HyColor@XZeroOneThreeFour\pc@goptd@icolor\pc@hyenc@icolorpdfcommentcolor\pdfmark[]pdfmark=/ANN,Subtype=/Widget,Raw=/TU (Integrated luminosity of the 12.7 micron feature (Lsun)\textCR(\pc@goptd@deadline)) /T (tooltip zref@252) /C [ ] /FT/Btn /F 768 /Ff 65536 /H/N /BS ¡¡ /W 0 ¿¿ ratio is thus an indicator of \HyColor@XZeroOneThreeFour\pc@goptd@color\pc@hyenc@colorpdfcommentcolor\HyColor@XZeroOneThreeFour\pc@goptd@fontcolor\pc@hyenc@fontcolorpdfcommentcolor\HyColor@XZeroOneThreeFour\pc@goptd@icolor\pc@hyenc@icolorpdfcommentcolor\pdfmark[PAH]pdfmark=/ANN,Subtype=/Widget,Raw=/TU (Polycyclic aromatic hydrocarbon\textCR(\pc@goptd@deadline)) /T (tooltip zref@253) /C [ ] /FT/Btn /F 768 /Ff 65536 /H/N /BS ¡¡ /W 0 ¿¿ compactness (e.g. Hony et al., 2001).
- Foreground extinction.
-
The wings of the silicate absorption feature at selectively extinct more the 8.6 and band than the other features (Figure 5-a).
- Dehydrogenation.
-
It has a similar effect to ionization. However, for \HyColor@XZeroOneThreeFour\pc@goptd@color\pc@hyenc@colorpdfcommentcolor\HyColor@XZeroOneThreeFour\pc@goptd@fontcolor\pc@hyenc@fontcolorpdfcommentcolor\HyColor@XZeroOneThreeFour\pc@goptd@icolor\pc@hyenc@icolorpdfcommentcolor\pdfmark[PAH]pdfmark=/ANN,Subtype=/Widget,Raw=/TU (Polycyclic aromatic hydrocarbon\textCR(\pc@goptd@deadline)) /T (tooltip zref@254) /C [ ] /FT/Btn /F 768 /Ff 65536 /H/N /BS ¡¡ /W 0 ¿¿ s larger than , hydrogenation through reactions with abundant atomic H is more important than H loss through unimolecular dissociation (e.g. Hony et al., 2001). Thus, dehydrogenation does not have a detectable effect on the \HyColor@XZeroOneThreeFour\pc@goptd@color\pc@hyenc@colorpdfcommentcolor\HyColor@XZeroOneThreeFour\pc@goptd@fontcolor\pc@hyenc@fontcolorpdfcommentcolor\HyColor@XZeroOneThreeFour\pc@goptd@icolor\pc@hyenc@icolorpdfcommentcolor\pdfmark[UIB]pdfmark=/ANN,Subtype=/Widget,Raw=/TU (Unidentified infrared band\textCR(\pc@goptd@deadline)) /T (tooltip zref@255) /C [ ] /FT/Btn /F 768 /Ff 65536 /H/N /BS ¡¡ /W 0 ¿¿ spectrum.
However, a mix of fully aromatic and/or partially hydrogenated molecules does not appear to give a completely satisfactory fit to the wavelength position and shape of the observed interstellar emission bands in the region (e.g., Fig. 3 in Sandford, Bernstein & Materese, 2013). Alternatively, the J17 model \HyColor@XZeroOneThreeFour\pc@goptd@color\pc@hyenc@colorpdfcommentcolor\HyColor@XZeroOneThreeFour\pc@goptd@fontcolor\pc@hyenc@fontcolorpdfcommentcolor\HyColor@XZeroOneThreeFour\pc@goptd@icolor\pc@hyenc@icolorpdfcommentcolor\pdfmark[a-C(:H)]pdfmark=/ANN,Subtype=/Widget,Raw=/TU ((hydrogenated) amorphous carbon\textCR(\pc@goptd@deadline)) /T (tooltip zref@256) /C [ ] /FT/Btn /F 768 /Ff 65536 /H/N /BS ¡¡ /W 0 ¿¿ nanoparticles could provide a physically-viable alternative to the interstellar \HyColor@XZeroOneThreeFour\pc@goptd@color\pc@hyenc@colorpdfcommentcolor\HyColor@XZeroOneThreeFour\pc@goptd@fontcolor\pc@hyenc@fontcolorpdfcommentcolor\HyColor@XZeroOneThreeFour\pc@goptd@icolor\pc@hyenc@icolorpdfcommentcolor\pdfmark[PAH]pdfmark=/ANN,Subtype=/Widget,Raw=/TU (Polycyclic aromatic hydrocarbon\textCR(\pc@goptd@deadline)) /T (tooltip zref@257) /C [ ] /FT/Btn /F 768 /Ff 65536 /H/N /BS ¡¡ /W 0 ¿¿ hypothesis for the carriers of the \HyColor@XZeroOneThreeFour\pc@goptd@color\pc@hyenc@colorpdfcommentcolor\HyColor@XZeroOneThreeFour\pc@goptd@fontcolor\pc@hyenc@fontcolorpdfcommentcolor\HyColor@XZeroOneThreeFour\pc@goptd@icolor\pc@hyenc@icolorpdfcommentcolor\pdfmark[UIB]pdfmark=/ANN,Subtype=/Widget,Raw=/TU (Unidentified infrared band\textCR(\pc@goptd@deadline)) /T (tooltip zref@258) /C [ ] /FT/Btn /F 768 /Ff 65536 /H/N /BS ¡¡ /W 0 ¿¿ s. To date, the J17 interstellar dust model appears to be the only one that is consistent with the presence of the emission bands at and and the associated sub-bands at . In this model, these bands are due to \HyColor@XZeroOneThreeFour\pc@goptd@color\pc@hyenc@colorpdfcommentcolor\HyColor@XZeroOneThreeFour\pc@goptd@fontcolor\pc@hyenc@fontcolorpdfcommentcolor\HyColor@XZeroOneThreeFour\pc@goptd@icolor\pc@hyenc@icolorpdfcommentcolor\pdfmark[a-C(:H)]pdfmark=/ANN,Subtype=/Widget,Raw=/TU ((hydrogenated) amorphous carbon\textCR(\pc@goptd@deadline)) /T (tooltip zref@259) /C [ ] /FT/Btn /F 768 /Ff 65536 /H/N /BS ¡¡ /W 0 ¿¿ nano-grains, of mixed aromatic, olefinic and aliphatic composition, with size-dependent optical properties (Jones et al., 2013). Further, and within the framework of J17, variations in the band ratios in the region can be explained by \HyColor@XZeroOneThreeFour\pc@goptd@color\pc@hyenc@colorpdfcommentcolor\HyColor@XZeroOneThreeFour\pc@goptd@fontcolor\pc@hyenc@fontcolorpdfcommentcolor\HyColor@XZeroOneThreeFour\pc@goptd@icolor\pc@hyenc@icolorpdfcommentcolor\pdfmark[a-C(:H)]pdfmark=/ANN,Subtype=/Widget,Raw=/TU ((hydrogenated) amorphous carbon\textCR(\pc@goptd@deadline)) /T (tooltip zref@260) /C [ ] /FT/Btn /F 768 /Ff 65536 /H/N /BS ¡¡ /W 0 ¿¿ compositional variations as the dust evolves in response to its environment. That is the reason why we adopt the generic acronym \HyColor@XZeroOneThreeFour\pc@goptd@color\pc@hyenc@colorpdfcommentcolor\HyColor@XZeroOneThreeFour\pc@goptd@fontcolor\pc@hyenc@fontcolorpdfcommentcolor\HyColor@XZeroOneThreeFour\pc@goptd@icolor\pc@hyenc@icolorpdfcommentcolor\pdfmark[UIB]pdfmark=/ANN,Subtype=/Widget,Raw=/TU (Unidentified infrared band\textCR(\pc@goptd@deadline)) /T (tooltip zref@261) /C [ ] /FT/Btn /F 768 /Ff 65536 /H/N /BS ¡¡ /W 0 ¿¿ . We refer to \HyColor@XZeroOneThreeFour\pc@goptd@color\pc@hyenc@colorpdfcommentcolor\HyColor@XZeroOneThreeFour\pc@goptd@fontcolor\pc@hyenc@fontcolorpdfcommentcolor\HyColor@XZeroOneThreeFour\pc@goptd@icolor\pc@hyenc@icolorpdfcommentcolor\pdfmark[PAH]pdfmark=/ANN,Subtype=/Widget,Raw=/TU (Polycyclic aromatic hydrocarbon\textCR(\pc@goptd@deadline)) /T (tooltip zref@262) /C [ ] /FT/Btn /F 768 /Ff 65536 /H/N /BS ¡¡ /W 0 ¿¿ s only when discussing results depending on the \HyColor@XZeroOneThreeFour\pc@goptd@color\pc@hyenc@colorpdfcommentcolor\HyColor@XZeroOneThreeFour\pc@goptd@fontcolor\pc@hyenc@fontcolorpdfcommentcolor\HyColor@XZeroOneThreeFour\pc@goptd@icolor\pc@hyenc@icolorpdfcommentcolor\pdfmark[PAH]pdfmark=/ANN,Subtype=/Widget,Raw=/TU (Polycyclic aromatic hydrocarbon\textCR(\pc@goptd@deadline)) /T (tooltip zref@263) /C [ ] /FT/Btn /F 768 /Ff 65536 /H/N /BS ¡¡ /W 0 ¿¿ hypothesis. ††margin: \entry PAHpolycyclic aromatic hydrocarbons. Molecules composed of several aromatic cycles, with peripheral H atoms. \entrya-C(:H)amorphous carbon with partial hydrogenation. Solids containing both aromatic and aliphatic bonds, in proportion depending on the H-fraction.
6.1.2.2 MIR spectrum fitting challenges
To study the properties of the \HyColor@XZeroOneThreeFour\pc@goptd@color\pc@hyenc@colorpdfcommentcolor\HyColor@XZeroOneThreeFour\pc@goptd@fontcolor\pc@hyenc@fontcolorpdfcommentcolor\HyColor@XZeroOneThreeFour\pc@goptd@icolor\pc@hyenc@icolorpdfcommentcolor\pdfmark[UIB]pdfmark=/ANN,Subtype=/Widget,Raw=/TU (Unidentified infrared band\textCR(\pc@goptd@deadline)) /T (tooltip zref@264) /C [ ] /FT/Btn /F 768 /Ff 65536 /H/N /BS ¡¡ /W 0 ¿¿ s, one needs to estimate the intensity of each band. Most studies perform least-squares spectral decompositions, with the linear combination of several components (e.g. Smith et al. 2007, hereafter S07; G08b): (1) \HyColor@XZeroOneThreeFour\pc@goptd@color\pc@hyenc@colorpdfcommentcolor\HyColor@XZeroOneThreeFour\pc@goptd@fontcolor\pc@hyenc@fontcolorpdfcommentcolor\HyColor@XZeroOneThreeFour\pc@goptd@icolor\pc@hyenc@icolorpdfcommentcolor\pdfmark[PAH]pdfmark=/ANN,Subtype=/Widget,Raw=/TU (Polycyclic aromatic hydrocarbon\textCR(\pc@goptd@deadline)) /T (tooltip zref@265) /C [ ] /FT/Btn /F 768 /Ff 65536 /H/N /BS ¡¡ /W 0 ¿¿ s: Lorentz or Drude profiles; (2) gas lines: Gauss profiles; (3) dust continuum: several \HyColor@XZeroOneThreeFour\pc@goptd@color\pc@hyenc@colorpdfcommentcolor\HyColor@XZeroOneThreeFour\pc@goptd@fontcolor\pc@hyenc@fontcolorpdfcommentcolor\HyColor@XZeroOneThreeFour\pc@goptd@icolor\pc@hyenc@icolorpdfcommentcolor\pdfmark[MBB]pdfmark=/ANN,Subtype=/Widget,Raw=/TU (Modified black body\textCR(\pc@goptd@deadline)) /T (tooltip zref@266) /C [ ] /FT/Btn /F 768 /Ff 65536 /H/N /BS ¡¡ /W 0 ¿¿ s; (4) a stellar continuum. In addition, (5) the extinction by silicate and ices can be parameterized by their optical depths. However, as can be seen on Figure 5-a, the wings of the \HyColor@XZeroOneThreeFour\pc@goptd@color\pc@hyenc@colorpdfcommentcolor\HyColor@XZeroOneThreeFour\pc@goptd@fontcolor\pc@hyenc@fontcolorpdfcommentcolor\HyColor@XZeroOneThreeFour\pc@goptd@icolor\pc@hyenc@icolorpdfcommentcolor\pdfmark[UIB]pdfmark=/ANN,Subtype=/Widget,Raw=/TU (Unidentified infrared band\textCR(\pc@goptd@deadline)) /T (tooltip zref@267) /C [ ] /FT/Btn /F 768 /Ff 65536 /H/N /BS ¡¡ /W 0 ¿¿ s can be difficult to distinguish from the dust continuum. In addition, several features are blended (e.g. the or complexes) and may present underlying broad plateaus. These bands can also be blended with ionic lines, at low spectral resolution (e.g. the and [Ne ii]12.81μm). This type of fit can thus lead to some biases and degeneracies in the following cases (G08b): (1) low signal-to-noise ratio; (2) low \HyColor@XZeroOneThreeFour\pc@goptd@color\pc@hyenc@colorpdfcommentcolor\HyColor@XZeroOneThreeFour\pc@goptd@fontcolor\pc@hyenc@fontcolorpdfcommentcolor\HyColor@XZeroOneThreeFour\pc@goptd@icolor\pc@hyenc@icolorpdfcommentcolor\pdfmark[UIB]pdfmark=/ANN,Subtype=/Widget,Raw=/TU (Unidentified infrared band\textCR(\pc@goptd@deadline)) /T (tooltip zref@268) /C [ ] /FT/Btn /F 768 /Ff 65536 /H/N /BS ¡¡ /W 0 ¿¿ -to-continuum ratio; (3) moderate extinction. The derived band intensities are also sensitive to the adopted \HyColor@XZeroOneThreeFour\pc@goptd@color\pc@hyenc@colorpdfcommentcolor\HyColor@XZeroOneThreeFour\pc@goptd@fontcolor\pc@hyenc@fontcolorpdfcommentcolor\HyColor@XZeroOneThreeFour\pc@goptd@icolor\pc@hyenc@icolorpdfcommentcolor\pdfmark[UIB]pdfmark=/ANN,Subtype=/Widget,Raw=/TU (Unidentified infrared band\textCR(\pc@goptd@deadline)) /T (tooltip zref@269) /C [ ] /FT/Btn /F 768 /Ff 65536 /H/N /BS ¡¡ /W 0 ¿¿ positions and widths, and on the nature and number of \HyColor@XZeroOneThreeFour\pc@goptd@color\pc@hyenc@colorpdfcommentcolor\HyColor@XZeroOneThreeFour\pc@goptd@fontcolor\pc@hyenc@fontcolorpdfcommentcolor\HyColor@XZeroOneThreeFour\pc@goptd@icolor\pc@hyenc@icolorpdfcommentcolor\pdfmark[MBB]pdfmark=/ANN,Subtype=/Widget,Raw=/TU (Modified black body\textCR(\pc@goptd@deadline)) /T (tooltip zref@270) /C [ ] /FT/Btn /F 768 /Ff 65536 /H/N /BS ¡¡ /W 0 ¿¿ components for the continuum.
6.1.2.3 Aromatic band ratios in nearby galaxies
G08b studied the 6.2, 7.7, 8.6 and \HyColor@XZeroOneThreeFour\pc@goptd@color\pc@hyenc@colorpdfcommentcolor\HyColor@XZeroOneThreeFour\pc@goptd@fontcolor\pc@hyenc@fontcolorpdfcommentcolor\HyColor@XZeroOneThreeFour\pc@goptd@icolor\pc@hyenc@icolorpdfcommentcolor\pdfmark[UIB]pdfmark=/ANN,Subtype=/Widget,Raw=/TU (Unidentified infrared band\textCR(\pc@goptd@deadline)) /T (tooltip zref@271) /C [ ] /FT/Btn /F 768 /Ff 65536 /H/N /BS ¡¡ /W 0 ¿¿ s, in a sample of nearby galaxies and Galactic regions. Several band ratios were used in order to solve the degeneracies between the effects of the charge, size distribution, \HyColor@XZeroOneThreeFour\pc@goptd@color\pc@hyenc@colorpdfcommentcolor\HyColor@XZeroOneThreeFour\pc@goptd@fontcolor\pc@hyenc@fontcolorpdfcommentcolor\HyColor@XZeroOneThreeFour\pc@goptd@icolor\pc@hyenc@icolorpdfcommentcolor\pdfmark[ISRF]pdfmark=/ANN,Subtype=/Widget,Raw=/TU (Interstellar radiation field\textCR(\pc@goptd@deadline)) /T (tooltip zref@272) /C [ ] /FT/Btn /F 768 /Ff 65536 /H/N /BS ¡¡ /W 0 ¿¿ hardness and extinction. The \HyColor@XZeroOneThreeFour\pc@goptd@color\pc@hyenc@colorpdfcommentcolor\HyColor@XZeroOneThreeFour\pc@goptd@fontcolor\pc@hyenc@fontcolorpdfcommentcolor\HyColor@XZeroOneThreeFour\pc@goptd@icolor\pc@hyenc@icolorpdfcommentcolor\pdfmark[]pdfmark=/ANN,Subtype=/Widget,Raw=/TU (Integrated luminosity of the 6.2 micron feature (Lsun)\textCR(\pc@goptd@deadline)) /T (tooltip zref@273) /C [ ] /FT/Btn /F 768 /Ff 65536 /H/N /BS ¡¡ /W 0 ¿¿ /\HyColor@XZeroOneThreeFour\pc@goptd@color\pc@hyenc@colorpdfcommentcolor\HyColor@XZeroOneThreeFour\pc@goptd@fontcolor\pc@hyenc@fontcolorpdfcommentcolor\HyColor@XZeroOneThreeFour\pc@goptd@icolor\pc@hyenc@icolorpdfcommentcolor\pdfmark[]pdfmark=/ANN,Subtype=/Widget,Raw=/TU (Integrated luminosity of the 11.3 micron feature (Lsun)\textCR(\pc@goptd@deadline)) /T (tooltip zref@274) /C [ ] /FT/Btn /F 768 /Ff 65536 /H/N /BS ¡¡ /W 0 ¿¿ and \HyColor@XZeroOneThreeFour\pc@goptd@color\pc@hyenc@colorpdfcommentcolor\HyColor@XZeroOneThreeFour\pc@goptd@fontcolor\pc@hyenc@fontcolorpdfcommentcolor\HyColor@XZeroOneThreeFour\pc@goptd@icolor\pc@hyenc@icolorpdfcommentcolor\pdfmark[]pdfmark=/ANN,Subtype=/Widget,Raw=/TU (Integrated luminosity of the 7.7 micron feature (Lsun)\textCR(\pc@goptd@deadline)) /T (tooltip zref@275) /C [ ] /FT/Btn /F 768 /Ff 65536 /H/N /BS ¡¡ /W 0 ¿¿ /\HyColor@XZeroOneThreeFour\pc@goptd@color\pc@hyenc@colorpdfcommentcolor\HyColor@XZeroOneThreeFour\pc@goptd@fontcolor\pc@hyenc@fontcolorpdfcommentcolor\HyColor@XZeroOneThreeFour\pc@goptd@icolor\pc@hyenc@icolorpdfcommentcolor\pdfmark[]pdfmark=/ANN,Subtype=/Widget,Raw=/TU (Integrated luminosity of the 11.3 micron feature (Lsun)\textCR(\pc@goptd@deadline)) /T (tooltip zref@276) /C [ ] /FT/Btn /F 768 /Ff 65536 /H/N /BS ¡¡ /W 0 ¿¿ ratios vary by a factor of . Among this sample, covering a large range of physical conditions and spatial resolutions, it appears that most of the variations of the band ratios arise from variations of the \HyColor@XZeroOneThreeFour\pc@goptd@color\pc@hyenc@colorpdfcommentcolor\HyColor@XZeroOneThreeFour\pc@goptd@fontcolor\pc@hyenc@fontcolorpdfcommentcolor\HyColor@XZeroOneThreeFour\pc@goptd@icolor\pc@hyenc@icolorpdfcommentcolor\pdfmark[PAH]pdfmark=/ANN,Subtype=/Widget,Raw=/TU (Polycyclic aromatic hydrocarbon\textCR(\pc@goptd@deadline)) /T (tooltip zref@277) /C [ ] /FT/Btn /F 768 /Ff 65536 /H/N /BS ¡¡ /W 0 ¿¿ charge. S07 also found large variations of the band ratios (by a factor of ) in central regions of starbursts and \HyColor@XZeroOneThreeFour\pc@goptd@color\pc@hyenc@colorpdfcommentcolor\HyColor@XZeroOneThreeFour\pc@goptd@fontcolor\pc@hyenc@fontcolorpdfcommentcolor\HyColor@XZeroOneThreeFour\pc@goptd@icolor\pc@hyenc@icolorpdfcommentcolor\pdfmark[AGN]pdfmark=/ANN,Subtype=/Widget,Raw=/TU (Active galactic nuclues\textCR(\pc@goptd@deadline)) /T (tooltip zref@278) /C [ ] /FT/Btn /F 768 /Ff 65536 /H/N /BS ¡¡ /W 0 ¿¿ s. However, they found that the presence of a low-luminosity \HyColor@XZeroOneThreeFour\pc@goptd@color\pc@hyenc@colorpdfcommentcolor\HyColor@XZeroOneThreeFour\pc@goptd@fontcolor\pc@hyenc@fontcolorpdfcommentcolor\HyColor@XZeroOneThreeFour\pc@goptd@icolor\pc@hyenc@icolorpdfcommentcolor\pdfmark[AGN]pdfmark=/ANN,Subtype=/Widget,Raw=/TU (Active galactic nuclues\textCR(\pc@goptd@deadline)) /T (tooltip zref@279) /C [ ] /FT/Btn /F 768 /Ff 65536 /H/N /BS ¡¡ /W 0 ¿¿ could alter the spectrum, by destroying the smallest \HyColor@XZeroOneThreeFour\pc@goptd@color\pc@hyenc@colorpdfcommentcolor\HyColor@XZeroOneThreeFour\pc@goptd@fontcolor\pc@hyenc@fontcolorpdfcommentcolor\HyColor@XZeroOneThreeFour\pc@goptd@icolor\pc@hyenc@icolorpdfcommentcolor\pdfmark[PAH]pdfmark=/ANN,Subtype=/Widget,Raw=/TU (Polycyclic aromatic hydrocarbon\textCR(\pc@goptd@deadline)) /T (tooltip zref@280) /C [ ] /FT/Btn /F 768 /Ff 65536 /H/N /BS ¡¡ /W 0 ¿¿ s (also confirmed by Sales, Pastoriza & Riffel, 2010). Harsh environments result in selective destruction of the smallest \HyColor@XZeroOneThreeFour\pc@goptd@color\pc@hyenc@colorpdfcommentcolor\HyColor@XZeroOneThreeFour\pc@goptd@fontcolor\pc@hyenc@fontcolorpdfcommentcolor\HyColor@XZeroOneThreeFour\pc@goptd@icolor\pc@hyenc@icolorpdfcommentcolor\pdfmark[PAH]pdfmark=/ANN,Subtype=/Widget,Raw=/TU (Polycyclic aromatic hydrocarbon\textCR(\pc@goptd@deadline)) /T (tooltip zref@281) /C [ ] /FT/Btn /F 768 /Ff 65536 /H/N /BS ¡¡ /W 0 ¿¿ s, like in elliptical galaxies (Kaneda, Onaka & Sakon, 2007; Vega et al., 2010), or in the superwind of M 82 (Beirão et al., 2015).
In low-metallicity systems, the variations can be more difficult to probe, as the band equivalent widths are lower (Figure 5-a; this point is discussed in Sections 9.2.3.1 and 9.3.4). In the \HyColor@XZeroOneThreeFour\pc@goptd@color\pc@hyenc@colorpdfcommentcolor\HyColor@XZeroOneThreeFour\pc@goptd@fontcolor\pc@hyenc@fontcolorpdfcommentcolor\HyColor@XZeroOneThreeFour\pc@goptd@icolor\pc@hyenc@icolorpdfcommentcolor\pdfmark[LMC]pdfmark=/ANN,Subtype=/Widget,Raw=/TU (Large Magellanic cloud\textCR(\pc@goptd@deadline)) /T (tooltip zref@282) /C [ ] /FT/Btn /F 768 /Ff 65536 /H/N /BS ¡¡ /W 0 ¿¿ , Mori et al. (2012) found different trends in neutral and ionized sightlines. Toward the latter, there are evidences that \HyColor@XZeroOneThreeFour\pc@goptd@color\pc@hyenc@colorpdfcommentcolor\HyColor@XZeroOneThreeFour\pc@goptd@fontcolor\pc@hyenc@fontcolorpdfcommentcolor\HyColor@XZeroOneThreeFour\pc@goptd@icolor\pc@hyenc@icolorpdfcommentcolor\pdfmark[PAH]pdfmark=/ANN,Subtype=/Widget,Raw=/TU (Polycyclic aromatic hydrocarbon\textCR(\pc@goptd@deadline)) /T (tooltip zref@283) /C [ ] /FT/Btn /F 768 /Ff 65536 /H/N /BS ¡¡ /W 0 ¿¿ s have a lower charge, as a consequence of the higher recombination rate, and are on average larger, due to the destruction of the smallest ones. In contrast, in the \HyColor@XZeroOneThreeFour\pc@goptd@color\pc@hyenc@colorpdfcommentcolor\HyColor@XZeroOneThreeFour\pc@goptd@fontcolor\pc@hyenc@fontcolorpdfcommentcolor\HyColor@XZeroOneThreeFour\pc@goptd@icolor\pc@hyenc@icolorpdfcommentcolor\pdfmark[SMC]pdfmark=/ANN,Subtype=/Widget,Raw=/TU (Small Magellanic cloud\textCR(\pc@goptd@deadline)) /T (tooltip zref@284) /C [ ] /FT/Btn /F 768 /Ff 65536 /H/N /BS ¡¡ /W 0 ¿¿ , Sandstrom et al. (2012) found very weak \HyColor@XZeroOneThreeFour\pc@goptd@color\pc@hyenc@colorpdfcommentcolor\HyColor@XZeroOneThreeFour\pc@goptd@fontcolor\pc@hyenc@fontcolorpdfcommentcolor\HyColor@XZeroOneThreeFour\pc@goptd@icolor\pc@hyenc@icolorpdfcommentcolor\pdfmark[]pdfmark=/ANN,Subtype=/Widget,Raw=/TU (Integrated luminosity of the 6-9 micron feature (Lsun)\textCR(\pc@goptd@deadline)) /T (tooltip zref@285) /C [ ] /FT/Btn /F 768 /Ff 65536 /H/N /BS ¡¡ /W 0 ¿¿ /\HyColor@XZeroOneThreeFour\pc@goptd@color\pc@hyenc@colorpdfcommentcolor\HyColor@XZeroOneThreeFour\pc@goptd@fontcolor\pc@hyenc@fontcolorpdfcommentcolor\HyColor@XZeroOneThreeFour\pc@goptd@icolor\pc@hyenc@icolorpdfcommentcolor\pdfmark[]pdfmark=/ANN,Subtype=/Widget,Raw=/TU (Integrated luminosity of the 11.3 micron feature (Lsun)\textCR(\pc@goptd@deadline)) /T (tooltip zref@286) /C [ ] /FT/Btn /F 768 /Ff 65536 /H/N /BS ¡¡ /W 0 ¿¿ ratios and weak 8.6 and bands, implying small weakly ionized \HyColor@XZeroOneThreeFour\pc@goptd@color\pc@hyenc@colorpdfcommentcolor\HyColor@XZeroOneThreeFour\pc@goptd@fontcolor\pc@hyenc@fontcolorpdfcommentcolor\HyColor@XZeroOneThreeFour\pc@goptd@icolor\pc@hyenc@icolorpdfcommentcolor\pdfmark[PAH]pdfmark=/ANN,Subtype=/Widget,Raw=/TU (Polycyclic aromatic hydrocarbon\textCR(\pc@goptd@deadline)) /T (tooltip zref@287) /C [ ] /FT/Btn /F 768 /Ff 65536 /H/N /BS ¡¡ /W 0 ¿¿ s. This last point is consistent with the trend of \HyColor@XZeroOneThreeFour\pc@goptd@color\pc@hyenc@colorpdfcommentcolor\HyColor@XZeroOneThreeFour\pc@goptd@fontcolor\pc@hyenc@fontcolorpdfcommentcolor\HyColor@XZeroOneThreeFour\pc@goptd@icolor\pc@hyenc@icolorpdfcommentcolor\pdfmark[]pdfmark=/ANN,Subtype=/Widget,Raw=/TU (Integrated luminosity of the 17 micron feature (Lsun)\textCR(\pc@goptd@deadline)) /T (tooltip zref@288) /C [ ] /FT/Btn /F 768 /Ff 65536 /H/N /BS ¡¡ /W 0 ¿¿ /\HyColor@XZeroOneThreeFour\pc@goptd@color\pc@hyenc@colorpdfcommentcolor\HyColor@XZeroOneThreeFour\pc@goptd@fontcolor\pc@hyenc@fontcolorpdfcommentcolor\HyColor@XZeroOneThreeFour\pc@goptd@icolor\pc@hyenc@icolorpdfcommentcolor\pdfmark[]pdfmark=/ANN,Subtype=/Widget,Raw=/TU (Integrated luminosity of the 11.3 micron feature (Lsun)\textCR(\pc@goptd@deadline)) /T (tooltip zref@289) /C [ ] /FT/Btn /F 768 /Ff 65536 /H/N /BS ¡¡ /W 0 ¿¿ with \HyColor@XZeroOneThreeFour\pc@goptd@color\pc@hyenc@colorpdfcommentcolor\HyColor@XZeroOneThreeFour\pc@goptd@fontcolor\pc@hyenc@fontcolorpdfcommentcolor\HyColor@XZeroOneThreeFour\pc@goptd@icolor\pc@hyenc@icolorpdfcommentcolor\pdfmark[]pdfmark=/ANN,Subtype=/Widget,Raw=/TU (Metallicity\textCR(\pc@goptd@deadline)) /T (tooltip zref@290) /C [ ] /FT/Btn /F 768 /Ff 65536 /H/N /BS ¡¡ /W 0 ¿¿ found by S07. However, Hunt et al. (2010) argued that Blue Compact Dwarf galaxies (\HyColor@XZeroOneThreeFour\pc@goptd@color\pc@hyenc@colorpdfcommentcolor\HyColor@XZeroOneThreeFour\pc@goptd@fontcolor\pc@hyenc@fontcolorpdfcommentcolor\HyColor@XZeroOneThreeFour\pc@goptd@icolor\pc@hyenc@icolorpdfcommentcolor\pdfmark[BCD]pdfmark=/ANN,Subtype=/Widget,Raw=/TU (Blue compact dwarf\textCR(\pc@goptd@deadline)) /T (tooltip zref@291) /C [ ] /FT/Btn /F 768 /Ff 65536 /H/N /BS ¡¡ /W 0 ¿¿ ) exhibit a deficit of small \HyColor@XZeroOneThreeFour\pc@goptd@color\pc@hyenc@colorpdfcommentcolor\HyColor@XZeroOneThreeFour\pc@goptd@fontcolor\pc@hyenc@fontcolorpdfcommentcolor\HyColor@XZeroOneThreeFour\pc@goptd@icolor\pc@hyenc@icolorpdfcommentcolor\pdfmark[PAH]pdfmark=/ANN,Subtype=/Widget,Raw=/TU (Polycyclic aromatic hydrocarbon\textCR(\pc@goptd@deadline)) /T (tooltip zref@292) /C [ ] /FT/Btn /F 768 /Ff 65536 /H/N /BS ¡¡ /W 0 ¿¿ s. If there is a smooth variation of \HyColor@XZeroOneThreeFour\pc@goptd@color\pc@hyenc@colorpdfcommentcolor\HyColor@XZeroOneThreeFour\pc@goptd@fontcolor\pc@hyenc@fontcolorpdfcommentcolor\HyColor@XZeroOneThreeFour\pc@goptd@icolor\pc@hyenc@icolorpdfcommentcolor\pdfmark[PAH]pdfmark=/ANN,Subtype=/Widget,Raw=/TU (Polycyclic aromatic hydrocarbon\textCR(\pc@goptd@deadline)) /T (tooltip zref@293) /C [ ] /FT/Btn /F 768 /Ff 65536 /H/N /BS ¡¡ /W 0 ¿¿ size distribution with \HyColor@XZeroOneThreeFour\pc@goptd@color\pc@hyenc@colorpdfcommentcolor\HyColor@XZeroOneThreeFour\pc@goptd@fontcolor\pc@hyenc@fontcolorpdfcommentcolor\HyColor@XZeroOneThreeFour\pc@goptd@icolor\pc@hyenc@icolorpdfcommentcolor\pdfmark[]pdfmark=/ANN,Subtype=/Widget,Raw=/TU (Metallicity\textCR(\pc@goptd@deadline)) /T (tooltip zref@294) /C [ ] /FT/Btn /F 768 /Ff 65536 /H/N /BS ¡¡ /W 0 ¿¿ , these results are in contradiction. Sandstrom et al. (2012) noted that these \HyColor@XZeroOneThreeFour\pc@goptd@color\pc@hyenc@colorpdfcommentcolor\HyColor@XZeroOneThreeFour\pc@goptd@fontcolor\pc@hyenc@fontcolorpdfcommentcolor\HyColor@XZeroOneThreeFour\pc@goptd@icolor\pc@hyenc@icolorpdfcommentcolor\pdfmark[BCD]pdfmark=/ANN,Subtype=/Widget,Raw=/TU (Blue compact dwarf\textCR(\pc@goptd@deadline)) /T (tooltip zref@295) /C [ ] /FT/Btn /F 768 /Ff 65536 /H/N /BS ¡¡ /W 0 ¿¿ s are more extreme environments than the \HyColor@XZeroOneThreeFour\pc@goptd@color\pc@hyenc@colorpdfcommentcolor\HyColor@XZeroOneThreeFour\pc@goptd@fontcolor\pc@hyenc@fontcolorpdfcommentcolor\HyColor@XZeroOneThreeFour\pc@goptd@icolor\pc@hyenc@icolorpdfcommentcolor\pdfmark[SMC]pdfmark=/ANN,Subtype=/Widget,Raw=/TU (Small Magellanic cloud\textCR(\pc@goptd@deadline)) /T (tooltip zref@296) /C [ ] /FT/Btn /F 768 /Ff 65536 /H/N /BS ¡¡ /W 0 ¿¿ , and that photodestruction could dominate the \HyColor@XZeroOneThreeFour\pc@goptd@color\pc@hyenc@colorpdfcommentcolor\HyColor@XZeroOneThreeFour\pc@goptd@fontcolor\pc@hyenc@fontcolorpdfcommentcolor\HyColor@XZeroOneThreeFour\pc@goptd@icolor\pc@hyenc@icolorpdfcommentcolor\pdfmark[PAH]pdfmark=/ANN,Subtype=/Widget,Raw=/TU (Polycyclic aromatic hydrocarbon\textCR(\pc@goptd@deadline)) /T (tooltip zref@297) /C [ ] /FT/Btn /F 768 /Ff 65536 /H/N /BS ¡¡ /W 0 ¿¿ processing (cf. Section 9.2.3.1). We note that the solution to this apparent controversy might alternatively reside in the difference in studied spatial scales. In the Magellanic Clouds, \HyColor@XZeroOneThreeFour\pc@goptd@color\pc@hyenc@colorpdfcommentcolor\HyColor@XZeroOneThreeFour\pc@goptd@fontcolor\pc@hyenc@fontcolorpdfcommentcolor\HyColor@XZeroOneThreeFour\pc@goptd@icolor\pc@hyenc@icolorpdfcommentcolor\pdfmark[Spitzer]pdfmark=/ANN,Subtype=/Widget,Raw=/TU (Spitzer space telescope (3-160 microns; 2003-2009)\textCR(\pc@goptd@deadline)) /T (tooltip zref@298) /C [ ] /FT/Btn /F 768 /Ff 65536 /H/N /BS ¡¡ /W 0 ¿¿ spectroscopy gives a spatial resolution of a few parsecs, compared to a few hundreds in nearby \HyColor@XZeroOneThreeFour\pc@goptd@color\pc@hyenc@colorpdfcommentcolor\HyColor@XZeroOneThreeFour\pc@goptd@fontcolor\pc@hyenc@fontcolorpdfcommentcolor\HyColor@XZeroOneThreeFour\pc@goptd@icolor\pc@hyenc@icolorpdfcommentcolor\pdfmark[BCD]pdfmark=/ANN,Subtype=/Widget,Raw=/TU (Blue compact dwarf\textCR(\pc@goptd@deadline)) /T (tooltip zref@299) /C [ ] /FT/Btn /F 768 /Ff 65536 /H/N /BS ¡¡ /W 0 ¿¿ s. The fact is that the \HyColor@XZeroOneThreeFour\pc@goptd@color\pc@hyenc@colorpdfcommentcolor\HyColor@XZeroOneThreeFour\pc@goptd@fontcolor\pc@hyenc@fontcolorpdfcommentcolor\HyColor@XZeroOneThreeFour\pc@goptd@icolor\pc@hyenc@icolorpdfcommentcolor\pdfmark[LMC]pdfmark=/ANN,Subtype=/Widget,Raw=/TU (Large Magellanic cloud\textCR(\pc@goptd@deadline)) /T (tooltip zref@300) /C [ ] /FT/Btn /F 768 /Ff 65536 /H/N /BS ¡¡ /W 0 ¿¿ and \HyColor@XZeroOneThreeFour\pc@goptd@color\pc@hyenc@colorpdfcommentcolor\HyColor@XZeroOneThreeFour\pc@goptd@fontcolor\pc@hyenc@fontcolorpdfcommentcolor\HyColor@XZeroOneThreeFour\pc@goptd@icolor\pc@hyenc@icolorpdfcommentcolor\pdfmark[SMC]pdfmark=/ANN,Subtype=/Widget,Raw=/TU (Small Magellanic cloud\textCR(\pc@goptd@deadline)) /T (tooltip zref@301) /C [ ] /FT/Btn /F 768 /Ff 65536 /H/N /BS ¡¡ /W 0 ¿¿ exhibit strong spatial variations of their \HyColor@XZeroOneThreeFour\pc@goptd@color\pc@hyenc@colorpdfcommentcolor\HyColor@XZeroOneThreeFour\pc@goptd@fontcolor\pc@hyenc@fontcolorpdfcommentcolor\HyColor@XZeroOneThreeFour\pc@goptd@icolor\pc@hyenc@icolorpdfcommentcolor\pdfmark[UIB]pdfmark=/ANN,Subtype=/Widget,Raw=/TU (Unidentified infrared band\textCR(\pc@goptd@deadline)) /T (tooltip zref@302) /C [ ] /FT/Btn /F 768 /Ff 65536 /H/N /BS ¡¡ /W 0 ¿¿ spectrum. Whelan et al. (2013) showed a diversity of \HyColor@XZeroOneThreeFour\pc@goptd@color\pc@hyenc@colorpdfcommentcolor\HyColor@XZeroOneThreeFour\pc@goptd@fontcolor\pc@hyenc@fontcolorpdfcommentcolor\HyColor@XZeroOneThreeFour\pc@goptd@icolor\pc@hyenc@icolorpdfcommentcolor\pdfmark[MIR]pdfmark=/ANN,Subtype=/Widget,Raw=/TU (Mid-infrared\textCR(\pc@goptd@deadline)) /T (tooltip zref@303) /C [ ] /FT/Btn /F 768 /Ff 65536 /H/N /BS ¡¡ /W 0 ¿¿ spectral properties in the \HyColor@XZeroOneThreeFour\pc@goptd@color\pc@hyenc@colorpdfcommentcolor\HyColor@XZeroOneThreeFour\pc@goptd@fontcolor\pc@hyenc@fontcolorpdfcommentcolor\HyColor@XZeroOneThreeFour\pc@goptd@icolor\pc@hyenc@icolorpdfcommentcolor\pdfmark[SMC]pdfmark=/ANN,Subtype=/Widget,Raw=/TU (Small Magellanic cloud\textCR(\pc@goptd@deadline)) /T (tooltip zref@304) /C [ ] /FT/Btn /F 768 /Ff 65536 /H/N /BS ¡¡ /W 0 ¿¿ . They demonstrated that the \HyColor@XZeroOneThreeFour\pc@goptd@color\pc@hyenc@colorpdfcommentcolor\HyColor@XZeroOneThreeFour\pc@goptd@fontcolor\pc@hyenc@fontcolorpdfcommentcolor\HyColor@XZeroOneThreeFour\pc@goptd@icolor\pc@hyenc@icolorpdfcommentcolor\pdfmark[PAH]pdfmark=/ANN,Subtype=/Widget,Raw=/TU (Polycyclic aromatic hydrocarbon\textCR(\pc@goptd@deadline)) /T (tooltip zref@305) /C [ ] /FT/Btn /F 768 /Ff 65536 /H/N /BS ¡¡ /W 0 ¿¿ emission in a region like N 66 is dominated by its diffuse component, and not by its bright clumps, where \HyColor@XZeroOneThreeFour\pc@goptd@color\pc@hyenc@colorpdfcommentcolor\HyColor@XZeroOneThreeFour\pc@goptd@fontcolor\pc@hyenc@fontcolorpdfcommentcolor\HyColor@XZeroOneThreeFour\pc@goptd@icolor\pc@hyenc@icolorpdfcommentcolor\pdfmark[PAH]pdfmark=/ANN,Subtype=/Widget,Raw=/TU (Polycyclic aromatic hydrocarbon\textCR(\pc@goptd@deadline)) /T (tooltip zref@306) /C [ ] /FT/Btn /F 768 /Ff 65536 /H/N /BS ¡¡ /W 0 ¿¿ s are destroyed. At the other extreme, the molecular cloud SMC-B1#1 shows unusually high \HyColor@XZeroOneThreeFour\pc@goptd@color\pc@hyenc@colorpdfcommentcolor\HyColor@XZeroOneThreeFour\pc@goptd@fontcolor\pc@hyenc@fontcolorpdfcommentcolor\HyColor@XZeroOneThreeFour\pc@goptd@icolor\pc@hyenc@icolorpdfcommentcolor\pdfmark[UIB]pdfmark=/ANN,Subtype=/Widget,Raw=/TU (Unidentified infrared band\textCR(\pc@goptd@deadline)) /T (tooltip zref@307) /C [ ] /FT/Btn /F 768 /Ff 65536 /H/N /BS ¡¡ /W 0 ¿¿ equivalent widths (Reach et al., 2000). Also, the \HyColor@XZeroOneThreeFour\pc@goptd@color\pc@hyenc@colorpdfcommentcolor\HyColor@XZeroOneThreeFour\pc@goptd@fontcolor\pc@hyenc@fontcolorpdfcommentcolor\HyColor@XZeroOneThreeFour\pc@goptd@icolor\pc@hyenc@icolorpdfcommentcolor\pdfmark[]pdfmark=/ANN,Subtype=/Widget,Raw=/TU (Integrated luminosity of the 11.3 micron feature (Lsun)\textCR(\pc@goptd@deadline)) /T (tooltip zref@308) /C [ ] /FT/Btn /F 768 /Ff 65536 /H/N /BS ¡¡ /W 0 ¿¿ /\HyColor@XZeroOneThreeFour\pc@goptd@color\pc@hyenc@colorpdfcommentcolor\HyColor@XZeroOneThreeFour\pc@goptd@fontcolor\pc@hyenc@fontcolorpdfcommentcolor\HyColor@XZeroOneThreeFour\pc@goptd@icolor\pc@hyenc@icolorpdfcommentcolor\pdfmark[]pdfmark=/ANN,Subtype=/Widget,Raw=/TU (Integrated luminosity of the 12.7 micron feature (Lsun)\textCR(\pc@goptd@deadline)) /T (tooltip zref@309) /C [ ] /FT/Btn /F 768 /Ff 65536 /H/N /BS ¡¡ /W 0 ¿¿ ratio indicates that \HyColor@XZeroOneThreeFour\pc@goptd@color\pc@hyenc@colorpdfcommentcolor\HyColor@XZeroOneThreeFour\pc@goptd@fontcolor\pc@hyenc@fontcolorpdfcommentcolor\HyColor@XZeroOneThreeFour\pc@goptd@icolor\pc@hyenc@icolorpdfcommentcolor\pdfmark[PAH]pdfmark=/ANN,Subtype=/Widget,Raw=/TU (Polycyclic aromatic hydrocarbon\textCR(\pc@goptd@deadline)) /T (tooltip zref@310) /C [ ] /FT/Btn /F 768 /Ff 65536 /H/N /BS ¡¡ /W 0 ¿¿ s are more compact in 30 Dor and more irregular outside (Vermeij et al., 2002). All these elements suggest that there is a complex balance of processes shaping the \HyColor@XZeroOneThreeFour\pc@goptd@color\pc@hyenc@colorpdfcommentcolor\HyColor@XZeroOneThreeFour\pc@goptd@fontcolor\pc@hyenc@fontcolorpdfcommentcolor\HyColor@XZeroOneThreeFour\pc@goptd@icolor\pc@hyenc@icolorpdfcommentcolor\pdfmark[MIR]pdfmark=/ANN,Subtype=/Widget,Raw=/TU (Mid-infrared\textCR(\pc@goptd@deadline)) /T (tooltip zref@311) /C [ ] /FT/Btn /F 768 /Ff 65536 /H/N /BS ¡¡ /W 0 ¿¿ spectra throughout low-\HyColor@XZeroOneThreeFour\pc@goptd@color\pc@hyenc@colorpdfcommentcolor\HyColor@XZeroOneThreeFour\pc@goptd@fontcolor\pc@hyenc@fontcolorpdfcommentcolor\HyColor@XZeroOneThreeFour\pc@goptd@icolor\pc@hyenc@icolorpdfcommentcolor\pdfmark[]pdfmark=/ANN,Subtype=/Widget,Raw=/TU (Metallicity\textCR(\pc@goptd@deadline)) /T (tooltip zref@312) /C [ ] /FT/Btn /F 768 /Ff 65536 /H/N /BS ¡¡ /W 0 ¿¿ environments.
Finally, \HyColor@XZeroOneThreeFour\pc@goptd@color\pc@hyenc@colorpdfcommentcolor\HyColor@XZeroOneThreeFour\pc@goptd@fontcolor\pc@hyenc@fontcolorpdfcommentcolor\HyColor@XZeroOneThreeFour\pc@goptd@icolor\pc@hyenc@icolorpdfcommentcolor\pdfmark[UIB]pdfmark=/ANN,Subtype=/Widget,Raw=/TU (Unidentified infrared band\textCR(\pc@goptd@deadline)) /T (tooltip zref@313) /C [ ] /FT/Btn /F 768 /Ff 65536 /H/N /BS ¡¡ /W 0 ¿¿ ratios can be used as a diagnostic tool of the physical conditions. For instance, G08b provided an empirical calibration of the \HyColor@XZeroOneThreeFour\pc@goptd@color\pc@hyenc@colorpdfcommentcolor\HyColor@XZeroOneThreeFour\pc@goptd@fontcolor\pc@hyenc@fontcolorpdfcommentcolor\HyColor@XZeroOneThreeFour\pc@goptd@icolor\pc@hyenc@icolorpdfcommentcolor\pdfmark[]pdfmark=/ANN,Subtype=/Widget,Raw=/TU (Integrated luminosity of the 6.2 micron feature (Lsun)\textCR(\pc@goptd@deadline)) /T (tooltip zref@314) /C [ ] /FT/Btn /F 768 /Ff 65536 /H/N /BS ¡¡ /W 0 ¿¿ /\HyColor@XZeroOneThreeFour\pc@goptd@color\pc@hyenc@colorpdfcommentcolor\HyColor@XZeroOneThreeFour\pc@goptd@fontcolor\pc@hyenc@fontcolorpdfcommentcolor\HyColor@XZeroOneThreeFour\pc@goptd@icolor\pc@hyenc@icolorpdfcommentcolor\pdfmark[]pdfmark=/ANN,Subtype=/Widget,Raw=/TU (Integrated luminosity of the 11.3 micron feature (Lsun)\textCR(\pc@goptd@deadline)) /T (tooltip zref@315) /C [ ] /FT/Btn /F 768 /Ff 65536 /H/N /BS ¡¡ /W 0 ¿¿ ratio with the \HyColor@XZeroOneThreeFour\pc@goptd@color\pc@hyenc@colorpdfcommentcolor\HyColor@XZeroOneThreeFour\pc@goptd@fontcolor\pc@hyenc@fontcolorpdfcommentcolor\HyColor@XZeroOneThreeFour\pc@goptd@icolor\pc@hyenc@icolorpdfcommentcolor\pdfmark[UV]pdfmark=/ANN,Subtype=/Widget,Raw=/TU (Ultraviolet\textCR(\pc@goptd@deadline)) /T (tooltip zref@316) /C [ ] /FT/Btn /F 768 /Ff 65536 /H/N /BS ¡¡ /W 0 ¿¿ -field-to-electron-density ratio, (Section 5.1.3). However, the dynamics of the \HyColor@XZeroOneThreeFour\pc@goptd@color\pc@hyenc@colorpdfcommentcolor\HyColor@XZeroOneThreeFour\pc@goptd@fontcolor\pc@hyenc@fontcolorpdfcommentcolor\HyColor@XZeroOneThreeFour\pc@goptd@icolor\pc@hyenc@icolorpdfcommentcolor\pdfmark[UIB]pdfmark=/ANN,Subtype=/Widget,Raw=/TU (Unidentified infrared band\textCR(\pc@goptd@deadline)) /T (tooltip zref@317) /C [ ] /FT/Btn /F 768 /Ff 65536 /H/N /BS ¡¡ /W 0 ¿¿ ratios being at most a factor of , with typical uncertainties of , their diagnostic potential is practically limited to a low/high value dichotomy.
6.1.3 Silicate Features in Emission
Silicates are one of the most abundant dust species ( of the mass; \al@draine07,jones17; \al@draine07,jones17, ). They are characterized by two prominent features at 9.8 and , corresponding to SiO stretching and OSiO bending modes, respectively (Figure 5-a). These features are most often seen in extinction (Section 6.2.4). They can be seen in emission in galaxies, when the dust is hot enough (K). It is the case near the central engine of \HyColor@XZeroOneThreeFour\pc@goptd@color\pc@hyenc@colorpdfcommentcolor\HyColor@XZeroOneThreeFour\pc@goptd@fontcolor\pc@hyenc@fontcolorpdfcommentcolor\HyColor@XZeroOneThreeFour\pc@goptd@icolor\pc@hyenc@icolorpdfcommentcolor\pdfmark[AGN]pdfmark=/ANN,Subtype=/Widget,Raw=/TU (Active galactic nuclues\textCR(\pc@goptd@deadline)) /T (tooltip zref@318) /C [ ] /FT/Btn /F 768 /Ff 65536 /H/N /BS ¡¡ /W 0 ¿¿ s (Wu et al., 2009; Hony et al., 2011), even low-luminosity \HyColor@XZeroOneThreeFour\pc@goptd@color\pc@hyenc@colorpdfcommentcolor\HyColor@XZeroOneThreeFour\pc@goptd@fontcolor\pc@hyenc@fontcolorpdfcommentcolor\HyColor@XZeroOneThreeFour\pc@goptd@icolor\pc@hyenc@icolorpdfcommentcolor\pdfmark[AGN]pdfmark=/ANN,Subtype=/Widget,Raw=/TU (Active galactic nuclues\textCR(\pc@goptd@deadline)) /T (tooltip zref@319) /C [ ] /FT/Btn /F 768 /Ff 65536 /H/N /BS ¡¡ /W 0 ¿¿ s, like the nucleus of M 31 (Hemachandra et al., 2015). The \HyColor@XZeroOneThreeFour\pc@goptd@color\pc@hyenc@colorpdfcommentcolor\HyColor@XZeroOneThreeFour\pc@goptd@fontcolor\pc@hyenc@fontcolorpdfcommentcolor\HyColor@XZeroOneThreeFour\pc@goptd@icolor\pc@hyenc@icolorpdfcommentcolor\pdfmark[MIR]pdfmark=/ANN,Subtype=/Widget,Raw=/TU (Mid-infrared\textCR(\pc@goptd@deadline)) /T (tooltip zref@320) /C [ ] /FT/Btn /F 768 /Ff 65536 /H/N /BS ¡¡ /W 0 ¿¿ spectra of early-type galaxies also show clear silicate emission features, but likely of circumstellar origin (e.g. Bressan et al., 2006). Alternatively, some dust models present a significant out-of-equilibrium emission from small silicates (e.g. Zubko, Dwek & Arendt, 2004). Such small silicates are not unlikely (e.g. Section 7.1.6). In the diffuse \HyColor@XZeroOneThreeFour\pc@goptd@color\pc@hyenc@colorpdfcommentcolor\HyColor@XZeroOneThreeFour\pc@goptd@fontcolor\pc@hyenc@fontcolorpdfcommentcolor\HyColor@XZeroOneThreeFour\pc@goptd@icolor\pc@hyenc@icolorpdfcommentcolor\pdfmark[ISM]pdfmark=/ANN,Subtype=/Widget,Raw=/TU (Interstellar medium\textCR(\pc@goptd@deadline)) /T (tooltip zref@321) /C [ ] /FT/Btn /F 768 /Ff 65536 /H/N /BS ¡¡ /W 0 ¿¿ , the feature would be hidden by the bright aromatic features. However, we should be able to see it when the \HyColor@XZeroOneThreeFour\pc@goptd@color\pc@hyenc@colorpdfcommentcolor\HyColor@XZeroOneThreeFour\pc@goptd@fontcolor\pc@hyenc@fontcolorpdfcommentcolor\HyColor@XZeroOneThreeFour\pc@goptd@icolor\pc@hyenc@icolorpdfcommentcolor\pdfmark[UIB]pdfmark=/ANN,Subtype=/Widget,Raw=/TU (Unidentified infrared band\textCR(\pc@goptd@deadline)) /T (tooltip zref@322) /C [ ] /FT/Btn /F 768 /Ff 65536 /H/N /BS ¡¡ /W 0 ¿¿ intensity decreases, like in dwarf galaxies. It is usually not the case (e.g. Rémy-Ruyer et al., 2015). It might suggest that either these small silicates have not abundantly formed, or that they are efficiently destroyed in dwarf galaxies.
6.1.4 Aliphatic Feature in Emission
The aliphatic emission feature is carried by small \HyColor@XZeroOneThreeFour\pc@goptd@color\pc@hyenc@colorpdfcommentcolor\HyColor@XZeroOneThreeFour\pc@goptd@fontcolor\pc@hyenc@fontcolorpdfcommentcolor\HyColor@XZeroOneThreeFour\pc@goptd@icolor\pc@hyenc@icolorpdfcommentcolor\pdfmark[a-C(:H)]pdfmark=/ANN,Subtype=/Widget,Raw=/TU ((hydrogenated) amorphous carbon\textCR(\pc@goptd@deadline)) /T (tooltip zref@323) /C [ ] /FT/Btn /F 768 /Ff 65536 /H/N /BS ¡¡ /W 0 ¿¿ . The \HyColor@XZeroOneThreeFour\pc@goptd@color\pc@hyenc@colorpdfcommentcolor\HyColor@XZeroOneThreeFour\pc@goptd@fontcolor\pc@hyenc@fontcolorpdfcommentcolor\HyColor@XZeroOneThreeFour\pc@goptd@icolor\pc@hyenc@icolorpdfcommentcolor\pdfmark[]pdfmark=/ANN,Subtype=/Widget,Raw=/TU (Integrated luminosity of the 3.4 micron feature (Lsun)\textCR(\pc@goptd@deadline)) /T (tooltip zref@324) /C [ ] /FT/Btn /F 768 /Ff 65536 /H/N /BS ¡¡ /W 0 ¿¿ /\HyColor@XZeroOneThreeFour\pc@goptd@color\pc@hyenc@colorpdfcommentcolor\HyColor@XZeroOneThreeFour\pc@goptd@fontcolor\pc@hyenc@fontcolorpdfcommentcolor\HyColor@XZeroOneThreeFour\pc@goptd@icolor\pc@hyenc@icolorpdfcommentcolor\pdfmark[]pdfmark=/ANN,Subtype=/Widget,Raw=/TU (Integrated luminosity of the 3.3 micron feature (Lsun)\textCR(\pc@goptd@deadline)) /T (tooltip zref@325) /C [ ] /FT/Btn /F 768 /Ff 65536 /H/N /BS ¡¡ /W 0 ¿¿ aliphatic-to-aromatic ratio shows regional variations in the \HyColor@XZeroOneThreeFour\pc@goptd@color\pc@hyenc@colorpdfcommentcolor\HyColor@XZeroOneThreeFour\pc@goptd@fontcolor\pc@hyenc@fontcolorpdfcommentcolor\HyColor@XZeroOneThreeFour\pc@goptd@icolor\pc@hyenc@icolorpdfcommentcolor\pdfmark[ISM]pdfmark=/ANN,Subtype=/Widget,Raw=/TU (Interstellar medium\textCR(\pc@goptd@deadline)) /T (tooltip zref@326) /C [ ] /FT/Btn /F 768 /Ff 65536 /H/N /BS ¡¡ /W 0 ¿¿ , as the result of structural changes in the hydrocarbons through \HyColor@XZeroOneThreeFour\pc@goptd@color\pc@hyenc@colorpdfcommentcolor\HyColor@XZeroOneThreeFour\pc@goptd@fontcolor\pc@hyenc@fontcolorpdfcommentcolor\HyColor@XZeroOneThreeFour\pc@goptd@icolor\pc@hyenc@icolorpdfcommentcolor\pdfmark[UV]pdfmark=/ANN,Subtype=/Widget,Raw=/TU (Ultraviolet\textCR(\pc@goptd@deadline)) /T (tooltip zref@327) /C [ ] /FT/Btn /F 768 /Ff 65536 /H/N /BS ¡¡ /W 0 ¿¿ processing (e.g. Jones et al., 2013). Yamagishi et al. (2012) detected this feature in the superwind of M 82. They found that the \HyColor@XZeroOneThreeFour\pc@goptd@color\pc@hyenc@colorpdfcommentcolor\HyColor@XZeroOneThreeFour\pc@goptd@fontcolor\pc@hyenc@fontcolorpdfcommentcolor\HyColor@XZeroOneThreeFour\pc@goptd@icolor\pc@hyenc@icolorpdfcommentcolor\pdfmark[]pdfmark=/ANN,Subtype=/Widget,Raw=/TU (Integrated luminosity of the 3.4 micron feature (Lsun)\textCR(\pc@goptd@deadline)) /T (tooltip zref@328) /C [ ] /FT/Btn /F 768 /Ff 65536 /H/N /BS ¡¡ /W 0 ¿¿ /\HyColor@XZeroOneThreeFour\pc@goptd@color\pc@hyenc@colorpdfcommentcolor\HyColor@XZeroOneThreeFour\pc@goptd@fontcolor\pc@hyenc@fontcolorpdfcommentcolor\HyColor@XZeroOneThreeFour\pc@goptd@icolor\pc@hyenc@icolorpdfcommentcolor\pdfmark[]pdfmark=/ANN,Subtype=/Widget,Raw=/TU (Integrated luminosity of the 3.3 micron feature (Lsun)\textCR(\pc@goptd@deadline)) /T (tooltip zref@329) /C [ ] /FT/Btn /F 768 /Ff 65536 /H/N /BS ¡¡ /W 0 ¿¿ ratio increases with distance from the center. They interpreted this trend as the production of small \HyColor@XZeroOneThreeFour\pc@goptd@color\pc@hyenc@colorpdfcommentcolor\HyColor@XZeroOneThreeFour\pc@goptd@fontcolor\pc@hyenc@fontcolorpdfcommentcolor\HyColor@XZeroOneThreeFour\pc@goptd@icolor\pc@hyenc@icolorpdfcommentcolor\pdfmark[a-C(:H)]pdfmark=/ANN,Subtype=/Widget,Raw=/TU ((hydrogenated) amorphous carbon\textCR(\pc@goptd@deadline)) /T (tooltip zref@330) /C [ ] /FT/Btn /F 768 /Ff 65536 /H/N /BS ¡¡ /W 0 ¿¿ , by shattering of larger grains in this harsh halo. Similarly, Kondo et al. (2012) found a higher \HyColor@XZeroOneThreeFour\pc@goptd@color\pc@hyenc@colorpdfcommentcolor\HyColor@XZeroOneThreeFour\pc@goptd@fontcolor\pc@hyenc@fontcolorpdfcommentcolor\HyColor@XZeroOneThreeFour\pc@goptd@icolor\pc@hyenc@icolorpdfcommentcolor\pdfmark[]pdfmark=/ANN,Subtype=/Widget,Raw=/TU (Integrated luminosity of the 3.4 micron feature (Lsun)\textCR(\pc@goptd@deadline)) /T (tooltip zref@331) /C [ ] /FT/Btn /F 768 /Ff 65536 /H/N /BS ¡¡ /W 0 ¿¿ /\HyColor@XZeroOneThreeFour\pc@goptd@color\pc@hyenc@colorpdfcommentcolor\HyColor@XZeroOneThreeFour\pc@goptd@fontcolor\pc@hyenc@fontcolorpdfcommentcolor\HyColor@XZeroOneThreeFour\pc@goptd@icolor\pc@hyenc@icolorpdfcommentcolor\pdfmark[]pdfmark=/ANN,Subtype=/Widget,Raw=/TU (Integrated luminosity of the 3.3 micron feature (Lsun)\textCR(\pc@goptd@deadline)) /T (tooltip zref@332) /C [ ] /FT/Btn /F 768 /Ff 65536 /H/N /BS ¡¡ /W 0 ¿¿ ratio in the nuclear bar of NGC 1097, suggesting that the gas flow towards the center could lead to the formation of small \HyColor@XZeroOneThreeFour\pc@goptd@color\pc@hyenc@colorpdfcommentcolor\HyColor@XZeroOneThreeFour\pc@goptd@fontcolor\pc@hyenc@fontcolorpdfcommentcolor\HyColor@XZeroOneThreeFour\pc@goptd@icolor\pc@hyenc@icolorpdfcommentcolor\pdfmark[a-C(:H)]pdfmark=/ANN,Subtype=/Widget,Raw=/TU ((hydrogenated) amorphous carbon\textCR(\pc@goptd@deadline)) /T (tooltip zref@333) /C [ ] /FT/Btn /F 768 /Ff 65536 /H/N /BS ¡¡ /W 0 ¿¿ by shattering. We note that, alternatively, the \HyColor@XZeroOneThreeFour\pc@goptd@color\pc@hyenc@colorpdfcommentcolor\HyColor@XZeroOneThreeFour\pc@goptd@fontcolor\pc@hyenc@fontcolorpdfcommentcolor\HyColor@XZeroOneThreeFour\pc@goptd@icolor\pc@hyenc@icolorpdfcommentcolor\pdfmark[]pdfmark=/ANN,Subtype=/Widget,Raw=/TU (Integrated luminosity of the 3.4 micron feature (Lsun)\textCR(\pc@goptd@deadline)) /T (tooltip zref@334) /C [ ] /FT/Btn /F 768 /Ff 65536 /H/N /BS ¡¡ /W 0 ¿¿ /\HyColor@XZeroOneThreeFour\pc@goptd@color\pc@hyenc@colorpdfcommentcolor\HyColor@XZeroOneThreeFour\pc@goptd@fontcolor\pc@hyenc@fontcolorpdfcommentcolor\HyColor@XZeroOneThreeFour\pc@goptd@icolor\pc@hyenc@icolorpdfcommentcolor\pdfmark[]pdfmark=/ANN,Subtype=/Widget,Raw=/TU (Integrated luminosity of the 3.3 micron feature (Lsun)\textCR(\pc@goptd@deadline)) /T (tooltip zref@335) /C [ ] /FT/Btn /F 768 /Ff 65536 /H/N /BS ¡¡ /W 0 ¿¿ ratio can increase with the accretion of \HyColor@XZeroOneThreeFour\pc@goptd@color\pc@hyenc@colorpdfcommentcolor\HyColor@XZeroOneThreeFour\pc@goptd@fontcolor\pc@hyenc@fontcolorpdfcommentcolor\HyColor@XZeroOneThreeFour\pc@goptd@icolor\pc@hyenc@icolorpdfcommentcolor\pdfmark[a-C(:H)]pdfmark=/ANN,Subtype=/Widget,Raw=/TU ((hydrogenated) amorphous carbon\textCR(\pc@goptd@deadline)) /T (tooltip zref@336) /C [ ] /FT/Btn /F 768 /Ff 65536 /H/N /BS ¡¡ /W 0 ¿¿ mantles in denser regions (Jones et al., 2013). This feature can also be seen in extinction, in \HyColor@XZeroOneThreeFour\pc@goptd@color\pc@hyenc@colorpdfcommentcolor\HyColor@XZeroOneThreeFour\pc@goptd@fontcolor\pc@hyenc@fontcolorpdfcommentcolor\HyColor@XZeroOneThreeFour\pc@goptd@icolor\pc@hyenc@icolorpdfcommentcolor\pdfmark[AGN]pdfmark=/ANN,Subtype=/Widget,Raw=/TU (Active galactic nuclues\textCR(\pc@goptd@deadline)) /T (tooltip zref@337) /C [ ] /FT/Btn /F 768 /Ff 65536 /H/N /BS ¡¡ /W 0 ¿¿ s (e.g. Mason et al., 2007).
6.2 The Wavelength-Dependent Extinction
6.2.1 General features
The extinction is the combination of light absorption and scattering. Early dust studies, before \HyColor@XZeroOneThreeFour\pc@goptd@color\pc@hyenc@colorpdfcommentcolor\HyColor@XZeroOneThreeFour\pc@goptd@fontcolor\pc@hyenc@fontcolorpdfcommentcolor\HyColor@XZeroOneThreeFour\pc@goptd@icolor\pc@hyenc@icolorpdfcommentcolor\pdfmark[IRAS]pdfmark=/ANN,Subtype=/Widget,Raw=/TU (Infrared astronomical satellite (12-100 microns; 1983)\textCR(\pc@goptd@deadline)) /T (tooltip zref@338) /C [ ] /FT/Btn /F 768 /Ff 65536 /H/N /BS ¡¡ /W 0 ¿¿ , were mainly based on extinction. In the \HyColor@XZeroOneThreeFour\pc@goptd@color\pc@hyenc@colorpdfcommentcolor\HyColor@XZeroOneThreeFour\pc@goptd@fontcolor\pc@hyenc@fontcolorpdfcommentcolor\HyColor@XZeroOneThreeFour\pc@goptd@icolor\pc@hyenc@icolorpdfcommentcolor\pdfmark[MW]pdfmark=/ANN,Subtype=/Widget,Raw=/TU (Milky Way\textCR(\pc@goptd@deadline)) /T (tooltip zref@339) /C [ ] /FT/Btn /F 768 /Ff 65536 /H/N /BS ¡¡ /W 0 ¿¿ , Cardelli, Clayton & Mathis (1989, C89) demonstrated that the \HyColor@XZeroOneThreeFour\pc@goptd@color\pc@hyenc@colorpdfcommentcolor\HyColor@XZeroOneThreeFour\pc@goptd@fontcolor\pc@hyenc@fontcolorpdfcommentcolor\HyColor@XZeroOneThreeFour\pc@goptd@icolor\pc@hyenc@icolorpdfcommentcolor\pdfmark[UV]pdfmark=/ANN,Subtype=/Widget,Raw=/TU (Ultraviolet\textCR(\pc@goptd@deadline)) /T (tooltip zref@340) /C [ ] /FT/Btn /F 768 /Ff 65536 /H/N /BS ¡¡ /W 0 ¿¿ -to-\HyColor@XZeroOneThreeFour\pc@goptd@color\pc@hyenc@colorpdfcommentcolor\HyColor@XZeroOneThreeFour\pc@goptd@fontcolor\pc@hyenc@fontcolorpdfcommentcolor\HyColor@XZeroOneThreeFour\pc@goptd@icolor\pc@hyenc@icolorpdfcommentcolor\pdfmark[NIR]pdfmark=/ANN,Subtype=/Widget,Raw=/TU (Near-infrared\textCR(\pc@goptd@deadline)) /T (tooltip zref@341) /C [ ] /FT/Btn /F 768 /Ff 65536 /H/N /BS ¡¡ /W 0 ¿¿ extinction curves follow a universal law, parameterized by :
| (3) |
The sum of the absorption and scattering opacities, , depends on the dust constitution. Such an extinction curve presents different regimes (Figure 6-a): (1) a \HyColor@XZeroOneThreeFour\pc@goptd@color\pc@hyenc@colorpdfcommentcolor\HyColor@XZeroOneThreeFour\pc@goptd@fontcolor\pc@hyenc@fontcolorpdfcommentcolor\HyColor@XZeroOneThreeFour\pc@goptd@icolor\pc@hyenc@icolorpdfcommentcolor\pdfmark[FUV]pdfmark=/ANN,Subtype=/Widget,Raw=/TU (Far-ultraviolet\textCR(\pc@goptd@deadline)) /T (tooltip zref@342) /C [ ] /FT/Btn /F 768 /Ff 65536 /H/N /BS ¡¡ /W 0 ¿¿ rise, mainly due to absorption by small grains (Rayleigh limit: ); (2) a 217.5 nm absorption bump, probably carried by small carbon grains (\HyColor@XZeroOneThreeFour\pc@goptd@color\pc@hyenc@colorpdfcommentcolor\HyColor@XZeroOneThreeFour\pc@goptd@fontcolor\pc@hyenc@fontcolorpdfcommentcolor\HyColor@XZeroOneThreeFour\pc@goptd@icolor\pc@hyenc@icolorpdfcommentcolor\pdfmark[PAH]pdfmark=/ANN,Subtype=/Widget,Raw=/TU (Polycyclic aromatic hydrocarbon\textCR(\pc@goptd@deadline)) /T (tooltip zref@343) /C [ ] /FT/Btn /F 768 /Ff 65536 /H/N /BS ¡¡ /W 0 ¿¿ s, graphite, amorphous carbon, etc.); (3) an optical knee, mainly due to scattering by large grains; (4) a power-law \HyColor@XZeroOneThreeFour\pc@goptd@color\pc@hyenc@colorpdfcommentcolor\HyColor@XZeroOneThreeFour\pc@goptd@fontcolor\pc@hyenc@fontcolorpdfcommentcolor\HyColor@XZeroOneThreeFour\pc@goptd@icolor\pc@hyenc@icolorpdfcommentcolor\pdfmark[NIR]pdfmark=/ANN,Subtype=/Widget,Raw=/TU (Near-infrared\textCR(\pc@goptd@deadline)) /T (tooltip zref@344) /C [ ] /FT/Btn /F 768 /Ff 65536 /H/N /BS ¡¡ /W 0 ¿¿ continuum. On average, in the Galaxy, with large variations between sightlines () due to dust processing, low values of being attributed to regions with enhanced small grains. For a given , the quantity is proportional to the dust-to-gas mass ratio.
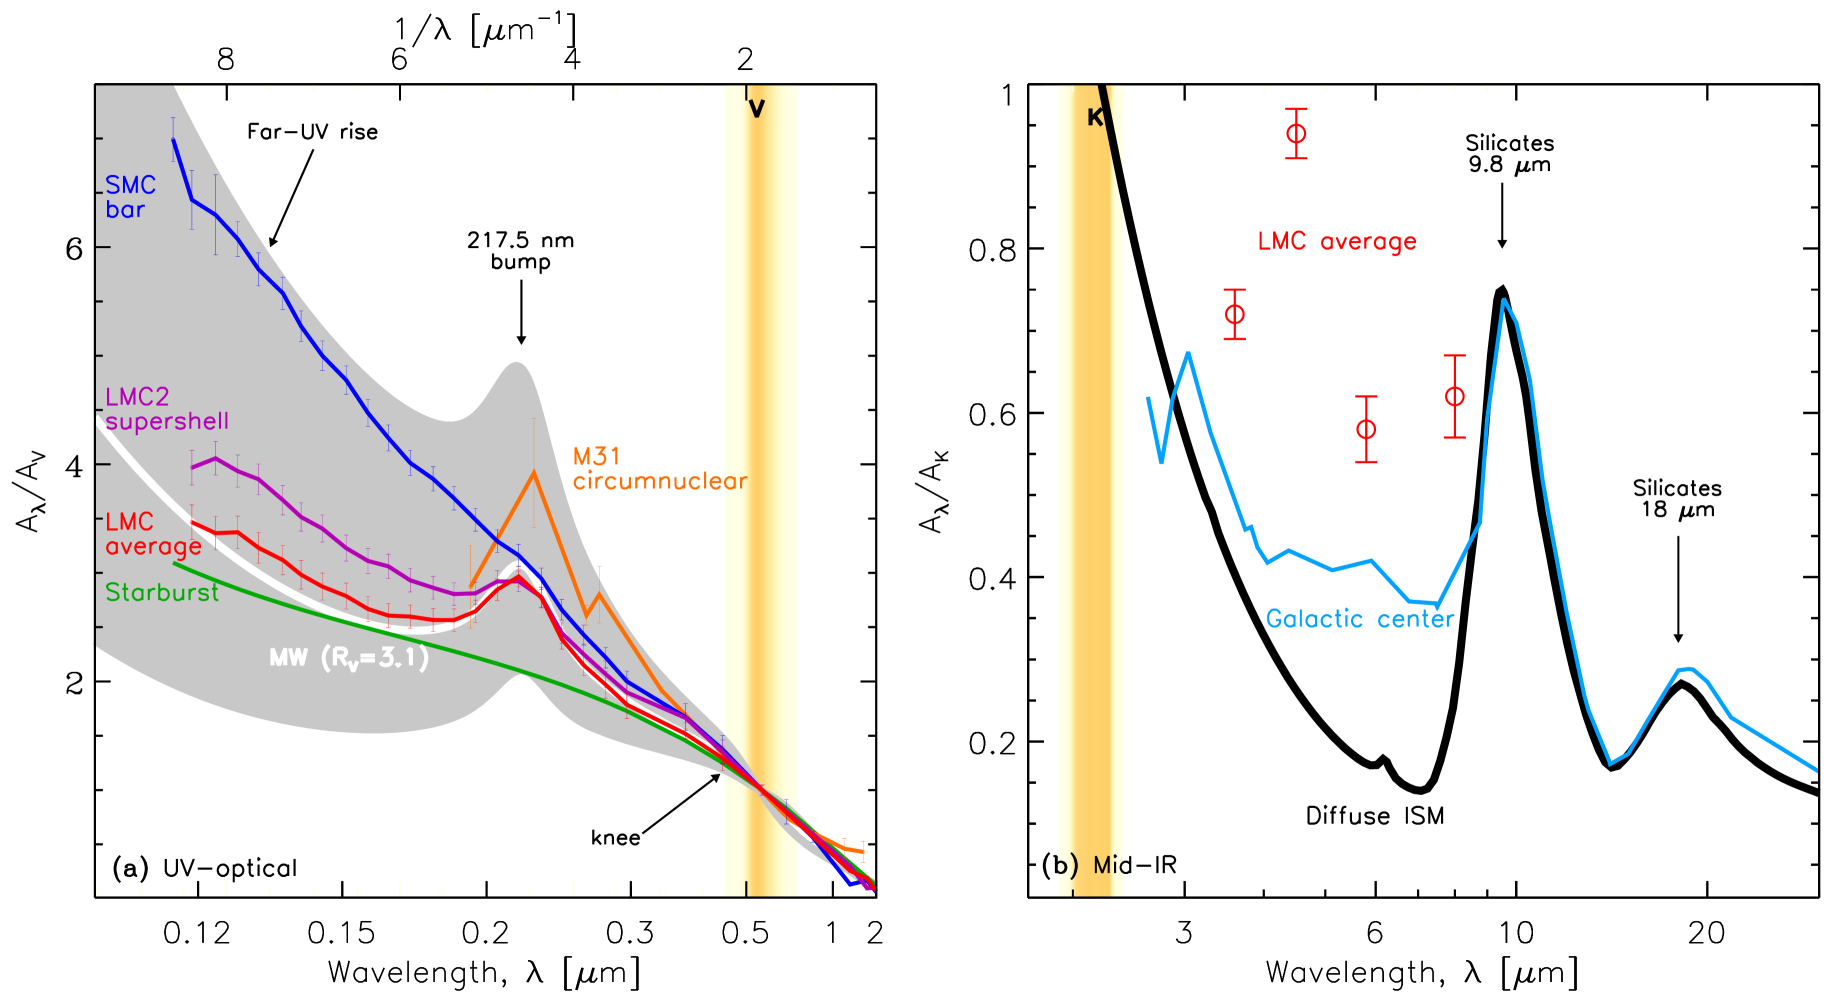
6.2.2 Methodology
The most reliable wavelength-dependent extinction curves are derived using the pair method (Stecher, 1965). Two stars of the same spectral type are observed, one with a low and one with a high foreground extinction. The extinction curve is directly derived from the differential spectrum, assuming the dust properties are uniform along the two sightlines. In external galaxies, this method has been successfully applied only to the Magellanic clouds (e.g. Nandy et al., 1981; Gordon et al., 2003) and M 31 (Bianchi et al., 1996; Clayton et al., 2015). Alternatively, a stellar atmosphere model can be used in lieu of the reference star (e.g. Fitzpatrick & Massa, 2005).
In more distant objects, where observations of individual stars become impractical, other methods, less direct and more model dependent, have to be used. Stellar \HyColor@XZeroOneThreeFour\pc@goptd@color\pc@hyenc@colorpdfcommentcolor\HyColor@XZeroOneThreeFour\pc@goptd@fontcolor\pc@hyenc@fontcolorpdfcommentcolor\HyColor@XZeroOneThreeFour\pc@goptd@icolor\pc@hyenc@icolorpdfcommentcolor\pdfmark[SED]pdfmark=/ANN,Subtype=/Widget,Raw=/TU (Spectral energy distribution\textCR(\pc@goptd@deadline)) /T (tooltip zref@351) /C [ ] /FT/Btn /F 768 /Ff 65536 /H/N /BS ¡¡ /W 0 ¿¿ modelling with dust attenuation is widely used (e.g. Hutton, Ferreras & Yershov, 2015). Attenuation, which is the net loss of photons within a galaxy, differs from extinction because it includes the effects of geometry. There is a degeneracy between dust attenuation and stellar age and metallicity. This degeneracy can be solved by accounting for \HyColor@XZeroOneThreeFour\pc@goptd@color\pc@hyenc@colorpdfcommentcolor\HyColor@XZeroOneThreeFour\pc@goptd@fontcolor\pc@hyenc@fontcolorpdfcommentcolor\HyColor@XZeroOneThreeFour\pc@goptd@icolor\pc@hyenc@icolorpdfcommentcolor\pdfmark[FIR]pdfmark=/ANN,Subtype=/Widget,Raw=/TU (Far-infrared\textCR(\pc@goptd@deadline)) /T (tooltip zref@352) /C [ ] /FT/Btn /F 768 /Ff 65536 /H/N /BS ¡¡ /W 0 ¿¿ emission (Gordon et al., 2000) or by studying disks with different inclinations (Conroy, Schiminovich & Blanton, 2010, hereafter C10). Alternatively, the ratio of Hydrogen recombination lines can be used. Calzetti, Kinney & Storchi-Bergmann (1994, hereafter C94) derived an average attenuation law (Figure 6-a) using this method, on a sample of 39 starbursts, assuming that all these objects had the same metallicity, stellar populations and dust properties. This average curve is rather flat and has no bump (Figure 6-a). In contrast, C10 derived an average attenuation law for disk galaxies, based on the UV-visible photometry. They found that the C94 law does not provide a good fit to their curve but that there might be a bump. They point out that it is possible that previous studies failed to recognize the presence of the \HyColor@XZeroOneThreeFour\pc@goptd@color\pc@hyenc@colorpdfcommentcolor\HyColor@XZeroOneThreeFour\pc@goptd@fontcolor\pc@hyenc@fontcolorpdfcommentcolor\HyColor@XZeroOneThreeFour\pc@goptd@icolor\pc@hyenc@icolorpdfcommentcolor\pdfmark[UV]pdfmark=/ANN,Subtype=/Widget,Raw=/TU (Ultraviolet\textCR(\pc@goptd@deadline)) /T (tooltip zref@353) /C [ ] /FT/Btn /F 768 /Ff 65536 /H/N /BS ¡¡ /W 0 ¿¿ bump, because they tried \HyColor@XZeroOneThreeFour\pc@goptd@color\pc@hyenc@colorpdfcommentcolor\HyColor@XZeroOneThreeFour\pc@goptd@fontcolor\pc@hyenc@fontcolorpdfcommentcolor\HyColor@XZeroOneThreeFour\pc@goptd@icolor\pc@hyenc@icolorpdfcommentcolor\pdfmark[MW]pdfmark=/ANN,Subtype=/Widget,Raw=/TU (Milky Way\textCR(\pc@goptd@deadline)) /T (tooltip zref@354) /C [ ] /FT/Btn /F 768 /Ff 65536 /H/N /BS ¡¡ /W 0 ¿¿ laws only with .
Finally, other less common methods are available. In a few rare cases, a background lenticular galaxy can be used to probe the extinction in a foreground galaxy (e.g. White & Keel, 1992; Berlind et al., 1997). Color magnitude diagrams can be used to probe the visible-\HyColor@XZeroOneThreeFour\pc@goptd@color\pc@hyenc@colorpdfcommentcolor\HyColor@XZeroOneThreeFour\pc@goptd@fontcolor\pc@hyenc@fontcolorpdfcommentcolor\HyColor@XZeroOneThreeFour\pc@goptd@icolor\pc@hyenc@icolorpdfcommentcolor\pdfmark[NIR]pdfmark=/ANN,Subtype=/Widget,Raw=/TU (Near-infrared\textCR(\pc@goptd@deadline)) /T (tooltip zref@355) /C [ ] /FT/Btn /F 768 /Ff 65536 /H/N /BS ¡¡ /W 0 ¿¿ extinction curves, like the red giant clump (Gao et al., 2013; De Marchi & Panagia, 2014). Supernova also provide bright sources probing the extinction in the host galaxy (e.g. Patat et al., 2015).
6.2.3 Extragalactic Results
External galaxies help us probe the extinction curves in extreme conditions, beyond the simple parameterization. There is a continuous variation in shape of the extinction curves from the Galaxy to the \HyColor@XZeroOneThreeFour\pc@goptd@color\pc@hyenc@colorpdfcommentcolor\HyColor@XZeroOneThreeFour\pc@goptd@fontcolor\pc@hyenc@fontcolorpdfcommentcolor\HyColor@XZeroOneThreeFour\pc@goptd@icolor\pc@hyenc@icolorpdfcommentcolor\pdfmark[SMC]pdfmark=/ANN,Subtype=/Widget,Raw=/TU (Small Magellanic cloud\textCR(\pc@goptd@deadline)) /T (tooltip zref@356) /C [ ] /FT/Btn /F 768 /Ff 65536 /H/N /BS ¡¡ /W 0 ¿¿ (Figure 6-a; Gordon et al., 2003). The \HyColor@XZeroOneThreeFour\pc@goptd@color\pc@hyenc@colorpdfcommentcolor\HyColor@XZeroOneThreeFour\pc@goptd@fontcolor\pc@hyenc@fontcolorpdfcommentcolor\HyColor@XZeroOneThreeFour\pc@goptd@icolor\pc@hyenc@icolorpdfcommentcolor\pdfmark[SMC]pdfmark=/ANN,Subtype=/Widget,Raw=/TU (Small Magellanic cloud\textCR(\pc@goptd@deadline)) /T (tooltip zref@357) /C [ ] /FT/Btn /F 768 /Ff 65536 /H/N /BS ¡¡ /W 0 ¿¿ bar is characterized by a very steep curve (), without 217.5 nm bump. This is the sign of smaller grain size and reduced fraction of carbon, likely the result of grain shattering by supernova shock waves (Clayton et al., 2003; Cartledge et al., 2005). A weak bump is seen in the \HyColor@XZeroOneThreeFour\pc@goptd@color\pc@hyenc@colorpdfcommentcolor\HyColor@XZeroOneThreeFour\pc@goptd@fontcolor\pc@hyenc@fontcolorpdfcommentcolor\HyColor@XZeroOneThreeFour\pc@goptd@icolor\pc@hyenc@icolorpdfcommentcolor\pdfmark[SMC]pdfmark=/ANN,Subtype=/Widget,Raw=/TU (Small Magellanic cloud\textCR(\pc@goptd@deadline)) /T (tooltip zref@358) /C [ ] /FT/Btn /F 768 /Ff 65536 /H/N /BS ¡¡ /W 0 ¿¿ wing, which is more quiescent. The \HyColor@XZeroOneThreeFour\pc@goptd@color\pc@hyenc@colorpdfcommentcolor\HyColor@XZeroOneThreeFour\pc@goptd@fontcolor\pc@hyenc@fontcolorpdfcommentcolor\HyColor@XZeroOneThreeFour\pc@goptd@icolor\pc@hyenc@icolorpdfcommentcolor\pdfmark[LMC]pdfmark=/ANN,Subtype=/Widget,Raw=/TU (Large Magellanic cloud\textCR(\pc@goptd@deadline)) /T (tooltip zref@359) /C [ ] /FT/Btn /F 768 /Ff 65536 /H/N /BS ¡¡ /W 0 ¿¿ is intermediate between the Galaxy and the \HyColor@XZeroOneThreeFour\pc@goptd@color\pc@hyenc@colorpdfcommentcolor\HyColor@XZeroOneThreeFour\pc@goptd@fontcolor\pc@hyenc@fontcolorpdfcommentcolor\HyColor@XZeroOneThreeFour\pc@goptd@icolor\pc@hyenc@icolorpdfcommentcolor\pdfmark[SMC]pdfmark=/ANN,Subtype=/Widget,Raw=/TU (Small Magellanic cloud\textCR(\pc@goptd@deadline)) /T (tooltip zref@360) /C [ ] /FT/Btn /F 768 /Ff 65536 /H/N /BS ¡¡ /W 0 ¿¿ , although there are important variations within. The \HyColor@XZeroOneThreeFour\pc@goptd@color\pc@hyenc@colorpdfcommentcolor\HyColor@XZeroOneThreeFour\pc@goptd@fontcolor\pc@hyenc@fontcolorpdfcommentcolor\HyColor@XZeroOneThreeFour\pc@goptd@icolor\pc@hyenc@icolorpdfcommentcolor\pdfmark[LMC]pdfmark=/ANN,Subtype=/Widget,Raw=/TU (Large Magellanic cloud\textCR(\pc@goptd@deadline)) /T (tooltip zref@361) /C [ ] /FT/Btn /F 768 /Ff 65536 /H/N /BS ¡¡ /W 0 ¿¿ 2 supershell, near the massive star forming region 30 Dor, has a steeper law than the Galaxy (), with a weaker bump. The average \HyColor@XZeroOneThreeFour\pc@goptd@color\pc@hyenc@colorpdfcommentcolor\HyColor@XZeroOneThreeFour\pc@goptd@fontcolor\pc@hyenc@fontcolorpdfcommentcolor\HyColor@XZeroOneThreeFour\pc@goptd@icolor\pc@hyenc@icolorpdfcommentcolor\pdfmark[LMC]pdfmark=/ANN,Subtype=/Widget,Raw=/TU (Large Magellanic cloud\textCR(\pc@goptd@deadline)) /T (tooltip zref@362) /C [ ] /FT/Btn /F 768 /Ff 65536 /H/N /BS ¡¡ /W 0 ¿¿ is closer to the Galaxy (). Neither the \HyColor@XZeroOneThreeFour\pc@goptd@color\pc@hyenc@colorpdfcommentcolor\HyColor@XZeroOneThreeFour\pc@goptd@fontcolor\pc@hyenc@fontcolorpdfcommentcolor\HyColor@XZeroOneThreeFour\pc@goptd@icolor\pc@hyenc@icolorpdfcommentcolor\pdfmark[SMC]pdfmark=/ANN,Subtype=/Widget,Raw=/TU (Small Magellanic cloud\textCR(\pc@goptd@deadline)) /T (tooltip zref@363) /C [ ] /FT/Btn /F 768 /Ff 65536 /H/N /BS ¡¡ /W 0 ¿¿ , nor the \HyColor@XZeroOneThreeFour\pc@goptd@color\pc@hyenc@colorpdfcommentcolor\HyColor@XZeroOneThreeFour\pc@goptd@fontcolor\pc@hyenc@fontcolorpdfcommentcolor\HyColor@XZeroOneThreeFour\pc@goptd@icolor\pc@hyenc@icolorpdfcommentcolor\pdfmark[LMC]pdfmark=/ANN,Subtype=/Widget,Raw=/TU (Large Magellanic cloud\textCR(\pc@goptd@deadline)) /T (tooltip zref@364) /C [ ] /FT/Btn /F 768 /Ff 65536 /H/N /BS ¡¡ /W 0 ¿¿ 2 supershell conform to the C89 parameterization. There still remain some uncertainties on these properties. De Marchi & Panagia (2014) studied the visible-\HyColor@XZeroOneThreeFour\pc@goptd@color\pc@hyenc@colorpdfcommentcolor\HyColor@XZeroOneThreeFour\pc@goptd@fontcolor\pc@hyenc@fontcolorpdfcommentcolor\HyColor@XZeroOneThreeFour\pc@goptd@icolor\pc@hyenc@icolorpdfcommentcolor\pdfmark[NIR]pdfmark=/ANN,Subtype=/Widget,Raw=/TU (Near-infrared\textCR(\pc@goptd@deadline)) /T (tooltip zref@365) /C [ ] /FT/Btn /F 768 /Ff 65536 /H/N /BS ¡¡ /W 0 ¿¿ curve in 30 Dor, using the spread of the red giant clump in the colour-magnitude diagram, and found a flatter extinction () that they attributed to freshly injected large grains.
The extinction curves of M 31 () are consistent with the \HyColor@XZeroOneThreeFour\pc@goptd@color\pc@hyenc@colorpdfcommentcolor\HyColor@XZeroOneThreeFour\pc@goptd@fontcolor\pc@hyenc@fontcolorpdfcommentcolor\HyColor@XZeroOneThreeFour\pc@goptd@icolor\pc@hyenc@icolorpdfcommentcolor\pdfmark[MW]pdfmark=/ANN,Subtype=/Widget,Raw=/TU (Milky Way\textCR(\pc@goptd@deadline)) /T (tooltip zref@366) /C [ ] /FT/Btn /F 768 /Ff 65536 /H/N /BS ¡¡ /W 0 ¿¿ (Clayton et al., 2015, pair method). In its circumnuclear region, the curves appear steeper (), but similar to the Galactic bulge (Dong et al., 2014, \HyColor@XZeroOneThreeFour\pc@goptd@color\pc@hyenc@colorpdfcommentcolor\HyColor@XZeroOneThreeFour\pc@goptd@fontcolor\pc@hyenc@fontcolorpdfcommentcolor\HyColor@XZeroOneThreeFour\pc@goptd@icolor\pc@hyenc@icolorpdfcommentcolor\pdfmark[SED]pdfmark=/ANN,Subtype=/Widget,Raw=/TU (Spectral energy distribution\textCR(\pc@goptd@deadline)) /T (tooltip zref@367) /C [ ] /FT/Btn /F 768 /Ff 65536 /H/N /BS ¡¡ /W 0 ¿¿ ). In one of the regions studied by Dong et al. (2014), there is a significantly stronger \HyColor@XZeroOneThreeFour\pc@goptd@color\pc@hyenc@colorpdfcommentcolor\HyColor@XZeroOneThreeFour\pc@goptd@fontcolor\pc@hyenc@fontcolorpdfcommentcolor\HyColor@XZeroOneThreeFour\pc@goptd@icolor\pc@hyenc@icolorpdfcommentcolor\pdfmark[UV]pdfmark=/ANN,Subtype=/Widget,Raw=/TU (Ultraviolet\textCR(\pc@goptd@deadline)) /T (tooltip zref@368) /C [ ] /FT/Btn /F 768 /Ff 65536 /H/N /BS ¡¡ /W 0 ¿¿ bump (Figure 6-a). In contrast, the spiral galaxy M 101 appears to have a smaller bump, with a similar continuum (Rosa & Benvenuti, 1994, \HyColor@XZeroOneThreeFour\pc@goptd@color\pc@hyenc@colorpdfcommentcolor\HyColor@XZeroOneThreeFour\pc@goptd@fontcolor\pc@hyenc@fontcolorpdfcommentcolor\HyColor@XZeroOneThreeFour\pc@goptd@icolor\pc@hyenc@icolorpdfcommentcolor\pdfmark[SED]pdfmark=/ANN,Subtype=/Widget,Raw=/TU (Spectral energy distribution\textCR(\pc@goptd@deadline)) /T (tooltip zref@369) /C [ ] /FT/Btn /F 768 /Ff 65536 /H/N /BS ¡¡ /W 0 ¿¿ ). In the edge-on starburst, M 82, Hutton, Ferreras & Yershov (2015, \HyColor@XZeroOneThreeFour\pc@goptd@color\pc@hyenc@colorpdfcommentcolor\HyColor@XZeroOneThreeFour\pc@goptd@fontcolor\pc@hyenc@fontcolorpdfcommentcolor\HyColor@XZeroOneThreeFour\pc@goptd@icolor\pc@hyenc@icolorpdfcommentcolor\pdfmark[SED]pdfmark=/ANN,Subtype=/Widget,Raw=/TU (Spectral energy distribution\textCR(\pc@goptd@deadline)) /T (tooltip zref@370) /C [ ] /FT/Btn /F 768 /Ff 65536 /H/N /BS ¡¡ /W 0 ¿¿ ) find that both and the bump strength decrease outward, with galactocentric distance. The spiral galaxies studied with the overlap method all exhibit \HyColor@XZeroOneThreeFour\pc@goptd@color\pc@hyenc@colorpdfcommentcolor\HyColor@XZeroOneThreeFour\pc@goptd@fontcolor\pc@hyenc@fontcolorpdfcommentcolor\HyColor@XZeroOneThreeFour\pc@goptd@icolor\pc@hyenc@icolorpdfcommentcolor\pdfmark[MW]pdfmark=/ANN,Subtype=/Widget,Raw=/TU (Milky Way\textCR(\pc@goptd@deadline)) /T (tooltip zref@371) /C [ ] /FT/Btn /F 768 /Ff 65536 /H/N /BS ¡¡ /W 0 ¿¿ curves (e.g. Dewangan, Singh & Bhat, 1999; Deshmukh et al., 2013), as well as early-type galaxies (e.g. Goudfrooij et al., 1994; Finkelman et al., 2010). Some \HyColor@XZeroOneThreeFour\pc@goptd@color\pc@hyenc@colorpdfcommentcolor\HyColor@XZeroOneThreeFour\pc@goptd@fontcolor\pc@hyenc@fontcolorpdfcommentcolor\HyColor@XZeroOneThreeFour\pc@goptd@icolor\pc@hyenc@icolorpdfcommentcolor\pdfmark[AGN]pdfmark=/ANN,Subtype=/Widget,Raw=/TU (Active galactic nuclues\textCR(\pc@goptd@deadline)) /T (tooltip zref@372) /C [ ] /FT/Btn /F 768 /Ff 65536 /H/N /BS ¡¡ /W 0 ¿¿ s show signs of dust processing, with an absence of features (Crenshaw et al., 2001; Maiolino et al., 2001).
The extinction estimated towards \HyColor@XZeroOneThreeFour\pc@goptd@color\pc@hyenc@colorpdfcommentcolor\HyColor@XZeroOneThreeFour\pc@goptd@fontcolor\pc@hyenc@fontcolorpdfcommentcolor\HyColor@XZeroOneThreeFour\pc@goptd@icolor\pc@hyenc@icolorpdfcommentcolor\pdfmark[SN II]pdfmark=/ANN,Subtype=/Widget,Raw=/TU (Type II supernova\textCR(\pc@goptd@deadline)) /T (tooltip zref@373) /C [ ] /FT/Btn /F 768 /Ff 65536 /H/N /BS ¡¡ /W 0 ¿¿ exhibit steep extinction curves (), probably due to dust shattering by the shock wave (Hill et al., 1995; Amanullah et al., 2014; Hutton, Ferreras & Yershov, 2015). The trend is the same towards \HyColor@XZeroOneThreeFour\pc@goptd@color\pc@hyenc@colorpdfcommentcolor\HyColor@XZeroOneThreeFour\pc@goptd@fontcolor\pc@hyenc@fontcolorpdfcommentcolor\HyColor@XZeroOneThreeFour\pc@goptd@icolor\pc@hyenc@icolorpdfcommentcolor\pdfmark[SN Ia]pdfmark=/ANN,Subtype=/Widget,Raw=/TU (Type Ia supernova\textCR(\pc@goptd@deadline)) /T (tooltip zref@374) /C [ ] /FT/Btn /F 768 /Ff 65536 /H/N /BS ¡¡ /W 0 ¿¿ , with more dispersed values (; Elias-Rosa et al., 2006; Huang et al., 2017).
6.2.4 Silicate Features in Absorption
In the \HyColor@XZeroOneThreeFour\pc@goptd@color\pc@hyenc@colorpdfcommentcolor\HyColor@XZeroOneThreeFour\pc@goptd@fontcolor\pc@hyenc@fontcolorpdfcommentcolor\HyColor@XZeroOneThreeFour\pc@goptd@icolor\pc@hyenc@icolorpdfcommentcolor\pdfmark[MIR]pdfmark=/ANN,Subtype=/Widget,Raw=/TU (Mid-infrared\textCR(\pc@goptd@deadline)) /T (tooltip zref@375) /C [ ] /FT/Btn /F 768 /Ff 65536 /H/N /BS ¡¡ /W 0 ¿¿ , the extinction curve is dominated by the two prominent silicate features at 9.8 and 18 (Section 6.1.3; Figure 6-b). In the Galaxy, . These absorption features can be seen when sufficient amount of material is obscuring a bright \HyColor@XZeroOneThreeFour\pc@goptd@color\pc@hyenc@colorpdfcommentcolor\HyColor@XZeroOneThreeFour\pc@goptd@fontcolor\pc@hyenc@fontcolorpdfcommentcolor\HyColor@XZeroOneThreeFour\pc@goptd@icolor\pc@hyenc@icolorpdfcommentcolor\pdfmark[MIR]pdfmark=/ANN,Subtype=/Widget,Raw=/TU (Mid-infrared\textCR(\pc@goptd@deadline)) /T (tooltip zref@376) /C [ ] /FT/Btn /F 768 /Ff 65536 /H/N /BS ¡¡ /W 0 ¿¿ source (like a star forming region or an \HyColor@XZeroOneThreeFour\pc@goptd@color\pc@hyenc@colorpdfcommentcolor\HyColor@XZeroOneThreeFour\pc@goptd@fontcolor\pc@hyenc@fontcolorpdfcommentcolor\HyColor@XZeroOneThreeFour\pc@goptd@icolor\pc@hyenc@icolorpdfcommentcolor\pdfmark[AGN]pdfmark=/ANN,Subtype=/Widget,Raw=/TU (Active galactic nuclues\textCR(\pc@goptd@deadline)) /T (tooltip zref@377) /C [ ] /FT/Btn /F 768 /Ff 65536 /H/N /BS ¡¡ /W 0 ¿¿ ). They are even seen at extremely low-metallicity (like in SBS 0335-052; ; Thuan, Sauvage & Madden, 1999; Houck et al., 2004). One issue is the composition of these silicates. It is well established that silicates are partially crystalline in circumstellar environments and become completely amorphous in the \HyColor@XZeroOneThreeFour\pc@goptd@color\pc@hyenc@colorpdfcommentcolor\HyColor@XZeroOneThreeFour\pc@goptd@fontcolor\pc@hyenc@fontcolorpdfcommentcolor\HyColor@XZeroOneThreeFour\pc@goptd@icolor\pc@hyenc@icolorpdfcommentcolor\pdfmark[ISM]pdfmark=/ANN,Subtype=/Widget,Raw=/TU (Interstellar medium\textCR(\pc@goptd@deadline)) /T (tooltip zref@378) /C [ ] /FT/Btn /F 768 /Ff 65536 /H/N /BS ¡¡ /W 0 ¿¿ (e.g. Kemper, Vriend & Tielens, 2004). The crystalline-to-amorphous ratio provides clues of dust processing, as crystallization and annealing have high energy barriers. For instance, Spoon et al. (2006) detected distinctive crystalline silicate absorption features in several \HyColor@XZeroOneThreeFour\pc@goptd@color\pc@hyenc@colorpdfcommentcolor\HyColor@XZeroOneThreeFour\pc@goptd@fontcolor\pc@hyenc@fontcolorpdfcommentcolor\HyColor@XZeroOneThreeFour\pc@goptd@icolor\pc@hyenc@icolorpdfcommentcolor\pdfmark[ULIRG]pdfmark=/ANN,Subtype=/Widget,Raw=/TU (Ultraluminous infrared galaxy (L(IR) ¿ 1.E12 Lsun)\textCR(\pc@goptd@deadline)) /T (tooltip zref@379) /C [ ] /FT/Btn /F 768 /Ff 65536 /H/N /BS ¡¡ /W 0 ¿¿ s. Their crystalline-to-amorphous fraction is . They interpreted this value as the result of fresh injection of crystalline material by the massive star formation. On average, observations of nearby galaxies find mostly amorphous silicates. In a large sample of \HyColor@XZeroOneThreeFour\pc@goptd@color\pc@hyenc@colorpdfcommentcolor\HyColor@XZeroOneThreeFour\pc@goptd@fontcolor\pc@hyenc@fontcolorpdfcommentcolor\HyColor@XZeroOneThreeFour\pc@goptd@icolor\pc@hyenc@icolorpdfcommentcolor\pdfmark[LIRG]pdfmark=/ANN,Subtype=/Widget,Raw=/TU (Luminous infrared galaxy (1.E11 Lsun ¡ L(IR) ¡ 1.E12 Lsun)\textCR(\pc@goptd@deadline)) /T (tooltip zref@380) /C [ ] /FT/Btn /F 768 /Ff 65536 /H/N /BS ¡¡ /W 0 ¿¿ s and \HyColor@XZeroOneThreeFour\pc@goptd@color\pc@hyenc@colorpdfcommentcolor\HyColor@XZeroOneThreeFour\pc@goptd@fontcolor\pc@hyenc@fontcolorpdfcommentcolor\HyColor@XZeroOneThreeFour\pc@goptd@icolor\pc@hyenc@icolorpdfcommentcolor\pdfmark[ULIRG]pdfmark=/ANN,Subtype=/Widget,Raw=/TU (Ultraluminous infrared galaxy (L(IR) ¿ 1.E12 Lsun)\textCR(\pc@goptd@deadline)) /T (tooltip zref@381) /C [ ] /FT/Btn /F 768 /Ff 65536 /H/N /BS ¡¡ /W 0 ¿¿ s, Stierwalt et al. (2014) reported the detection of crystalline silicate absorption features in only of their sample, in the most obscure sources.
6.2.5 Ice Absorption Features
In shielded regions, some molecules can freeze out to form icy grain mantles. The dominant species, H2O, CO and CO2 produce \HyColor@XZeroOneThreeFour\pc@goptd@color\pc@hyenc@colorpdfcommentcolor\HyColor@XZeroOneThreeFour\pc@goptd@fontcolor\pc@hyenc@fontcolorpdfcommentcolor\HyColor@XZeroOneThreeFour\pc@goptd@icolor\pc@hyenc@icolorpdfcommentcolor\pdfmark[MIR]pdfmark=/ANN,Subtype=/Widget,Raw=/TU (Mid-infrared\textCR(\pc@goptd@deadline)) /T (tooltip zref@382) /C [ ] /FT/Btn /F 768 /Ff 65536 /H/N /BS ¡¡ /W 0 ¿¿ absorption bands (Figure 5-a). In the Magellanic clouds, ice absorption can be studied in individual young stellar objects (e.g. Oliveira et al., 2013). In other galaxies, ice features likely come from molecular clouds. \HyColor@XZeroOneThreeFour\pc@goptd@color\pc@hyenc@colorpdfcommentcolor\HyColor@XZeroOneThreeFour\pc@goptd@fontcolor\pc@hyenc@fontcolorpdfcommentcolor\HyColor@XZeroOneThreeFour\pc@goptd@icolor\pc@hyenc@icolorpdfcommentcolor\pdfmark[ULIRG]pdfmark=/ANN,Subtype=/Widget,Raw=/TU (Ultraluminous infrared galaxy (L(IR) ¿ 1.E12 Lsun)\textCR(\pc@goptd@deadline)) /T (tooltip zref@383) /C [ ] /FT/Btn /F 768 /Ff 65536 /H/N /BS ¡¡ /W 0 ¿¿ s show particularly high ice optical depths, correlated with the silicates (Stierwalt et al., 2014). However, some galaxies with high silicate absorption do not present detectable ice features, suggesting that the density of the medium is not the only parameter; the presence of an \HyColor@XZeroOneThreeFour\pc@goptd@color\pc@hyenc@colorpdfcommentcolor\HyColor@XZeroOneThreeFour\pc@goptd@fontcolor\pc@hyenc@fontcolorpdfcommentcolor\HyColor@XZeroOneThreeFour\pc@goptd@icolor\pc@hyenc@icolorpdfcommentcolor\pdfmark[AGN]pdfmark=/ANN,Subtype=/Widget,Raw=/TU (Active galactic nuclues\textCR(\pc@goptd@deadline)) /T (tooltip zref@384) /C [ ] /FT/Btn /F 768 /Ff 65536 /H/N /BS ¡¡ /W 0 ¿¿ could prevent ice formation. In nearby star forming galaxies, Yamagishi et al. (2015) conducted an extensive analysis of the CO2-to-H2O ice absorption ratio. This ratio exhibits variations by a factor , as H2O has a longer lifetime (higher sublimation temperature) than CO2. They found this ice ratio correlates best with specific \HyColor@XZeroOneThreeFour\pc@goptd@color\pc@hyenc@colorpdfcommentcolor\HyColor@XZeroOneThreeFour\pc@goptd@fontcolor\pc@hyenc@fontcolorpdfcommentcolor\HyColor@XZeroOneThreeFour\pc@goptd@icolor\pc@hyenc@icolorpdfcommentcolor\pdfmark[SFR]pdfmark=/ANN,Subtype=/Widget,Raw=/TU (Star formation rate\textCR(\pc@goptd@deadline)) /T (tooltip zref@385) /C [ ] /FT/Btn /F 768 /Ff 65536 /H/N /BS ¡¡ /W 0 ¿¿ (\HyColor@XZeroOneThreeFour\pc@goptd@color\pc@hyenc@colorpdfcommentcolor\HyColor@XZeroOneThreeFour\pc@goptd@fontcolor\pc@hyenc@fontcolorpdfcommentcolor\HyColor@XZeroOneThreeFour\pc@goptd@icolor\pc@hyenc@icolorpdfcommentcolor\pdfmark[sSFR]pdfmark=/ANN,Subtype=/Widget,Raw=/TU (Specific star formation rate (SFR/M*)\textCR(\pc@goptd@deadline)) /T (tooltip zref@386) /C [ ] /FT/Btn /F 768 /Ff 65536 /H/N /BS ¡¡ /W 0 ¿¿ ), indicating a high ratio in young star forming galaxies.
6.3 Elemental Depletion Patterns
6.3.1 Definition & Method
Dust is made of the available heavy elements produced by stars. In the \HyColor@XZeroOneThreeFour\pc@goptd@color\pc@hyenc@colorpdfcommentcolor\HyColor@XZeroOneThreeFour\pc@goptd@fontcolor\pc@hyenc@fontcolorpdfcommentcolor\HyColor@XZeroOneThreeFour\pc@goptd@icolor\pc@hyenc@icolorpdfcommentcolor\pdfmark[ISM]pdfmark=/ANN,Subtype=/Widget,Raw=/TU (Interstellar medium\textCR(\pc@goptd@deadline)) /T (tooltip zref@387) /C [ ] /FT/Btn /F 768 /Ff 65536 /H/N /BS ¡¡ /W 0 ¿¿ , a fraction of these elements is in the gas and the rest is locked up into dust. The fraction of missing elements from the gas is called depletion. In the \HyColor@XZeroOneThreeFour\pc@goptd@color\pc@hyenc@colorpdfcommentcolor\HyColor@XZeroOneThreeFour\pc@goptd@fontcolor\pc@hyenc@fontcolorpdfcommentcolor\HyColor@XZeroOneThreeFour\pc@goptd@icolor\pc@hyenc@icolorpdfcommentcolor\pdfmark[MW]pdfmark=/ANN,Subtype=/Widget,Raw=/TU (Milky Way\textCR(\pc@goptd@deadline)) /T (tooltip zref@388) /C [ ] /FT/Btn /F 768 /Ff 65536 /H/N /BS ¡¡ /W 0 ¿¿ , where depletions have been studied for most relevant heavy elements, in several hundreds of sightlines through the diffuse neutral medium (Jenkins, 2009), it appears that: (1) refractory elements, the elements with a higher condensation temperature (), are more depleted than volatile elements, the elements with a lower (e.g. Savage & Sembach, 1996); (2) the depletions increase the with mean density of the medium (e.g. Savage & Bohlin, 1979; Crinklaw, Federman & Joseph, 1994). The depletion of an element X, is defined as:
| (4) |
The second part of Equation (4) is a universal parameterization as a function of the depletion strength, (Jenkins, 2009). The minimum depletion term is thought to correspond to the core of the grain, while the varying environmental factor, , is attributed to accretion of mantles in denser environments.
Depletion measurements provide a direct estimate of the dust content, independent of model assumptions. In addition, they provide constraints on the stoichiometry through the number ratio of available elements. These measurements are however challenging. In the Diffuse Neutral Medium (\HyColor@XZeroOneThreeFour\pc@goptd@color\pc@hyenc@colorpdfcommentcolor\HyColor@XZeroOneThreeFour\pc@goptd@fontcolor\pc@hyenc@fontcolorpdfcommentcolor\HyColor@XZeroOneThreeFour\pc@goptd@icolor\pc@hyenc@icolorpdfcommentcolor\pdfmark[DNM]pdfmark=/ANN,Subtype=/Widget,Raw=/TU (Diffuse neutral medium\textCR(\pc@goptd@deadline)) /T (tooltip zref@389) /C [ ] /FT/Btn /F 768 /Ff 65536 /H/N /BS ¡¡ /W 0 ¿¿ ), they are performed in absorption. Most of the transitions are in the \HyColor@XZeroOneThreeFour\pc@goptd@color\pc@hyenc@colorpdfcommentcolor\HyColor@XZeroOneThreeFour\pc@goptd@fontcolor\pc@hyenc@fontcolorpdfcommentcolor\HyColor@XZeroOneThreeFour\pc@goptd@icolor\pc@hyenc@icolorpdfcommentcolor\pdfmark[UV]pdfmark=/ANN,Subtype=/Widget,Raw=/TU (Ultraviolet\textCR(\pc@goptd@deadline)) /T (tooltip zref@390) /C [ ] /FT/Btn /F 768 /Ff 65536 /H/N /BS ¡¡ /W 0 ¿¿ , thus inaccessible from the ground. Apart from possible line saturation and ionization corrections, the most challenging aspect is the adoption of reference abundances (Equation 4), representing the total \HyColor@XZeroOneThreeFour\pc@goptd@color\pc@hyenc@colorpdfcommentcolor\HyColor@XZeroOneThreeFour\pc@goptd@fontcolor\pc@hyenc@fontcolorpdfcommentcolor\HyColor@XZeroOneThreeFour\pc@goptd@icolor\pc@hyenc@icolorpdfcommentcolor\pdfmark[ISM]pdfmark=/ANN,Subtype=/Widget,Raw=/TU (Interstellar medium\textCR(\pc@goptd@deadline)) /T (tooltip zref@391) /C [ ] /FT/Btn /F 768 /Ff 65536 /H/N /BS ¡¡ /W 0 ¿¿ (gas and dust) abundances. Indeed, the different standards (solar, meteoritic, F & G stars, etc.) exhibit some inconsistencies. Alternatively, H ii region abundances can be estimated from nebular lines. These estimates rely on photoionization modelling, which add up another layer of uncertainties.
6.3.2 Extragalactic Depletions
In extragalactic systems, there are numerous studies of \HyColor@XZeroOneThreeFour\pc@goptd@color\pc@hyenc@colorpdfcommentcolor\HyColor@XZeroOneThreeFour\pc@goptd@fontcolor\pc@hyenc@fontcolorpdfcommentcolor\HyColor@XZeroOneThreeFour\pc@goptd@icolor\pc@hyenc@icolorpdfcommentcolor\pdfmark[DNM]pdfmark=/ANN,Subtype=/Widget,Raw=/TU (Diffuse neutral medium\textCR(\pc@goptd@deadline)) /T (tooltip zref@392) /C [ ] /FT/Btn /F 768 /Ff 65536 /H/N /BS ¡¡ /W 0 ¿¿ depletions in damped Ly- systems (\HyColor@XZeroOneThreeFour\pc@goptd@color\pc@hyenc@colorpdfcommentcolor\HyColor@XZeroOneThreeFour\pc@goptd@fontcolor\pc@hyenc@fontcolorpdfcommentcolor\HyColor@XZeroOneThreeFour\pc@goptd@icolor\pc@hyenc@icolorpdfcommentcolor\pdfmark[DLA]pdfmark=/ANN,Subtype=/Widget,Raw=/TU (Damped Lyman-alpha systems\textCR(\pc@goptd@deadline)) /T (tooltip zref@393) /C [ ] /FT/Btn /F 768 /Ff 65536 /H/N /BS ¡¡ /W 0 ¿¿ ; e.g. De Cia et al., 2016) or in -ray bursts (e.g. Friis et al., 2015), facilitated by the redshifting of the transitions in the visible range. Although such studies are usually compelled to make corrections based on the \HyColor@XZeroOneThreeFour\pc@goptd@color\pc@hyenc@colorpdfcommentcolor\HyColor@XZeroOneThreeFour\pc@goptd@fontcolor\pc@hyenc@fontcolorpdfcommentcolor\HyColor@XZeroOneThreeFour\pc@goptd@icolor\pc@hyenc@icolorpdfcommentcolor\pdfmark[MW]pdfmark=/ANN,Subtype=/Widget,Raw=/TU (Milky Way\textCR(\pc@goptd@deadline)) /T (tooltip zref@394) /C [ ] /FT/Btn /F 768 /Ff 65536 /H/N /BS ¡¡ /W 0 ¿¿ , De Cia et al. (2016) adopted a holistic approach and derived self-consistent depletion sequences.
The depletions of several nearby galaxies have been studied. The most complete studies concern the Magellanic clouds, with several elements, along several individual sightlines (e.g. Roth & Blades, 1997; Welty et al., 1997; Sembach et al., 2001; Sofia et al., 2006; Tchernyshyov et al., 2015; Jenkins & Wallerstein, 2017). Reference abundances can be estimated in situ, directly from individual stars (e.g. Welty et al., 1997; Tchernyshyov et al., 2015). The main results are the following. (1) The \HyColor@XZeroOneThreeFour\pc@goptd@color\pc@hyenc@colorpdfcommentcolor\HyColor@XZeroOneThreeFour\pc@goptd@fontcolor\pc@hyenc@fontcolorpdfcommentcolor\HyColor@XZeroOneThreeFour\pc@goptd@icolor\pc@hyenc@icolorpdfcommentcolor\pdfmark[LMC]pdfmark=/ANN,Subtype=/Widget,Raw=/TU (Large Magellanic cloud\textCR(\pc@goptd@deadline)) /T (tooltip zref@395) /C [ ] /FT/Btn /F 768 /Ff 65536 /H/N /BS ¡¡ /W 0 ¿¿ depletion pattern of most elements appears Galactic, the abundances being simply scaled down by the metallicity (Tchernyshyov et al., 2015). (2) In the \HyColor@XZeroOneThreeFour\pc@goptd@color\pc@hyenc@colorpdfcommentcolor\HyColor@XZeroOneThreeFour\pc@goptd@fontcolor\pc@hyenc@fontcolorpdfcommentcolor\HyColor@XZeroOneThreeFour\pc@goptd@icolor\pc@hyenc@icolorpdfcommentcolor\pdfmark[SMC]pdfmark=/ANN,Subtype=/Widget,Raw=/TU (Small Magellanic cloud\textCR(\pc@goptd@deadline)) /T (tooltip zref@396) /C [ ] /FT/Btn /F 768 /Ff 65536 /H/N /BS ¡¡ /W 0 ¿¿ , there is a larger dynamics, likely resulting from more important processing (removal by shock waves). In addition, Si, Cr and Fe are systematically less depleted, with consistent with 0 (Tchernyshyov et al., 2015). However, Jenkins & Wallerstein (2017)’s is significantly larger than 0. Si depletion varies by a factor of at nearly constant Fe depletions, suggesting a different condensation process (Tchernyshyov et al., 2015). (3) The C/O ratio is a factor of below solar, in the Magellanic clouds, suggesting that the carbon-to-silicate grain mass fraction is lower (Table 2). (4) The Magellanic stream has a similar depletion pattern to the \HyColor@XZeroOneThreeFour\pc@goptd@color\pc@hyenc@colorpdfcommentcolor\HyColor@XZeroOneThreeFour\pc@goptd@fontcolor\pc@hyenc@fontcolorpdfcommentcolor\HyColor@XZeroOneThreeFour\pc@goptd@icolor\pc@hyenc@icolorpdfcommentcolor\pdfmark[SMC]pdfmark=/ANN,Subtype=/Widget,Raw=/TU (Small Magellanic cloud\textCR(\pc@goptd@deadline)) /T (tooltip zref@397) /C [ ] /FT/Btn /F 768 /Ff 65536 /H/N /BS ¡¡ /W 0 ¿¿ (Sembach et al., 2001).
| X | C | O | Mg | Si | Fe | Mass ratio |
| Milky Way | ||||||
| LMC | ||||||
| … | ||||||
| … | … | … | ||||
| SMC | ||||||
| … | … | |||||
(MW) solar abundance compilation and depletions from Jenkins (2009). (LMC) stellar abundance compilation and depletions from Tchernyshyov et al. (2015); and from Korn et al. (2002). (SMC) stellar abundance compilation from Tchernyshyov et al. (2015); depletions from Jenkins & Wallerstein (2017); from Peña-Guerrero et al. (2012)’s H ii modelling of NGC 456; derived from Mallouris (2003)’s (Sk 108, ) and Jenkins & Wallerstein (2017)’s . Values in grey indicate an estimate from nebular emission lines.
Other more extreme objects, like the lowest metallicity nearby galaxy I Zw 18 (Aloisi et al., 2003; Lebouteiller et al., 2013), or several star forming galaxies (James et al., 2014) have been studied in absorption, with some uncertainties due to multiple sightlines with different physical conditions. Several studies based on H ii emission lines focused on low-\HyColor@XZeroOneThreeFour\pc@goptd@color\pc@hyenc@colorpdfcommentcolor\HyColor@XZeroOneThreeFour\pc@goptd@fontcolor\pc@hyenc@fontcolorpdfcommentcolor\HyColor@XZeroOneThreeFour\pc@goptd@icolor\pc@hyenc@icolorpdfcommentcolor\pdfmark[]pdfmark=/ANN,Subtype=/Widget,Raw=/TU (Metallicity\textCR(\pc@goptd@deadline)) /T (tooltip zref@398) /C [ ] /FT/Btn /F 768 /Ff 65536 /H/N /BS ¡¡ /W 0 ¿¿ galaxies. It appears that and correlate with \HyColor@XZeroOneThreeFour\pc@goptd@color\pc@hyenc@colorpdfcommentcolor\HyColor@XZeroOneThreeFour\pc@goptd@fontcolor\pc@hyenc@fontcolorpdfcommentcolor\HyColor@XZeroOneThreeFour\pc@goptd@icolor\pc@hyenc@icolorpdfcommentcolor\pdfmark[]pdfmark=/ANN,Subtype=/Widget,Raw=/TU (Metallicity\textCR(\pc@goptd@deadline)) /T (tooltip zref@399) /C [ ] /FT/Btn /F 768 /Ff 65536 /H/N /BS ¡¡ /W 0 ¿¿ (Guseva et al., 2013), implying a higher Mg depletion at high \HyColor@XZeroOneThreeFour\pc@goptd@color\pc@hyenc@colorpdfcommentcolor\HyColor@XZeroOneThreeFour\pc@goptd@fontcolor\pc@hyenc@fontcolorpdfcommentcolor\HyColor@XZeroOneThreeFour\pc@goptd@icolor\pc@hyenc@icolorpdfcommentcolor\pdfmark[]pdfmark=/ANN,Subtype=/Widget,Raw=/TU (Metallicity\textCR(\pc@goptd@deadline)) /T (tooltip zref@400) /C [ ] /FT/Btn /F 768 /Ff 65536 /H/N /BS ¡¡ /W 0 ¿¿ . Similarly, correlates with \HyColor@XZeroOneThreeFour\pc@goptd@color\pc@hyenc@colorpdfcommentcolor\HyColor@XZeroOneThreeFour\pc@goptd@fontcolor\pc@hyenc@fontcolorpdfcommentcolor\HyColor@XZeroOneThreeFour\pc@goptd@icolor\pc@hyenc@icolorpdfcommentcolor\pdfmark[]pdfmark=/ANN,Subtype=/Widget,Raw=/TU (Metallicity\textCR(\pc@goptd@deadline)) /T (tooltip zref@401) /C [ ] /FT/Btn /F 768 /Ff 65536 /H/N /BS ¡¡ /W 0 ¿¿ (e.g. Rodríguez-Ardila, Contini & Viegas, 2005; Izotov et al., 2006). These results are qualitatively consistent with the Magellanic cloud trends (Table 2).
6.4 Polarization Studies
Grains are one of the main agents polarizing light in galaxies. Historically, Hall (1949) and Hiltner (1949) first noted that starlight was sometimes polarized to a few percents, and that the degree of polarization was correlated with the reddenning. Davis & Greenstein (1951) proposed that this polarization was caused by non-spherical grains. Stein (1966) predicted that the emission by such elongated grains should also produce polarized \HyColor@XZeroOneThreeFour\pc@goptd@color\pc@hyenc@colorpdfcommentcolor\HyColor@XZeroOneThreeFour\pc@goptd@fontcolor\pc@hyenc@fontcolorpdfcommentcolor\HyColor@XZeroOneThreeFour\pc@goptd@icolor\pc@hyenc@icolorpdfcommentcolor\pdfmark[IR]pdfmark=/ANN,Subtype=/Widget,Raw=/TU (Infrared\textCR(\pc@goptd@deadline)) /T (tooltip zref@402) /C [ ] /FT/Btn /F 768 /Ff 65536 /H/N /BS ¡¡ /W 0 ¿¿ emission. Dolginov & Mitrofanov (1976) proposed radiative torques as the main mechanism of grain alignment. Recently, the whole sky polarization map of the Galaxy, at 353 GHz ( resolution), has been observed by \HyColor@XZeroOneThreeFour\pc@goptd@color\pc@hyenc@colorpdfcommentcolor\HyColor@XZeroOneThreeFour\pc@goptd@fontcolor\pc@hyenc@fontcolorpdfcommentcolor\HyColor@XZeroOneThreeFour\pc@goptd@icolor\pc@hyenc@icolorpdfcommentcolor\pdfmark[Planck]pdfmark=/ANN,Subtype=/Widget,Raw=/TU (Planck space observatory (300 microns-1 cm; 2009-2013)\textCR(\pc@goptd@deadline)) /T (tooltip zref@403) /C [ ] /FT/Btn /F 768 /Ff 65536 /H/N /BS ¡¡ /W 0 ¿¿ . The \HyColor@XZeroOneThreeFour\pc@goptd@color\pc@hyenc@colorpdfcommentcolor\HyColor@XZeroOneThreeFour\pc@goptd@fontcolor\pc@hyenc@fontcolorpdfcommentcolor\HyColor@XZeroOneThreeFour\pc@goptd@icolor\pc@hyenc@icolorpdfcommentcolor\pdfmark[submm]pdfmark=/ANN,Subtype=/Widget,Raw=/TU (Submillimeter\textCR(\pc@goptd@deadline)) /T (tooltip zref@404) /C [ ] /FT/Btn /F 768 /Ff 65536 /H/N /BS ¡¡ /W 0 ¿¿ polarization fraction can be as high as in the most diffuse regions () and decreases along the densest sightlines (; Planck Collaboration et al., 2015a). In the low density regime, this behaviour is consistent with turbulently disordered magnetic field orientations. In regions of higher densities, more opaque, the trend can be explained by the decrease of the efficiency of radiative torque alignment.
In nearby galaxies, polarization studies have been conducted at all wavelengths from the \HyColor@XZeroOneThreeFour\pc@goptd@color\pc@hyenc@colorpdfcommentcolor\HyColor@XZeroOneThreeFour\pc@goptd@fontcolor\pc@hyenc@fontcolorpdfcommentcolor\HyColor@XZeroOneThreeFour\pc@goptd@icolor\pc@hyenc@icolorpdfcommentcolor\pdfmark[FUV]pdfmark=/ANN,Subtype=/Widget,Raw=/TU (Far-ultraviolet\textCR(\pc@goptd@deadline)) /T (tooltip zref@405) /C [ ] /FT/Btn /F 768 /Ff 65536 /H/N /BS ¡¡ /W 0 ¿¿ to the radio. Dust-induced polarization is usually used to trace one of the three following phenomena.
[h]
7 DUST-INDUCED POLARIZATION PROCESSES
7.0.1 Scattering
The light from a bright source (star or \HyColor@XZeroOneThreeFour\pc@goptd@color\pc@hyenc@colorpdfcommentcolor\HyColor@XZeroOneThreeFour\pc@goptd@fontcolor\pc@hyenc@fontcolorpdfcommentcolor\HyColor@XZeroOneThreeFour\pc@goptd@icolor\pc@hyenc@icolorpdfcommentcolor\pdfmark[AGN]pdfmark=/ANN,Subtype=/Widget,Raw=/TU (Active galactic nuclues\textCR(\pc@goptd@deadline)) /T (tooltip zref@406) /C [ ] /FT/Btn /F 768 /Ff 65536 /H/N /BS ¡¡ /W 0 ¿¿ ) scattered onto grains is partially polarized. The resulting fraction of linear polarization is a complex function of the dust composition, size and spatial distribution. This process is usually efficient in the \HyColor@XZeroOneThreeFour\pc@goptd@color\pc@hyenc@colorpdfcommentcolor\HyColor@XZeroOneThreeFour\pc@goptd@fontcolor\pc@hyenc@fontcolorpdfcommentcolor\HyColor@XZeroOneThreeFour\pc@goptd@icolor\pc@hyenc@icolorpdfcommentcolor\pdfmark[UV]pdfmark=/ANN,Subtype=/Widget,Raw=/TU (Ultraviolet\textCR(\pc@goptd@deadline)) /T (tooltip zref@407) /C [ ] /FT/Btn /F 768 /Ff 65536 /H/N /BS ¡¡ /W 0 ¿¿ (e.g. Zubko & Laor, 2000). It applies to spherical and elongated grains, indifferently. Most radiative transfer models include this polarization mechanism.
7.0.2 Dichroic extinction
The light from a background source seen through a cloud of magnetically-aligned elongated grains is partially polarized, parallel to the magnetic field. In the \HyColor@XZeroOneThreeFour\pc@goptd@color\pc@hyenc@colorpdfcommentcolor\HyColor@XZeroOneThreeFour\pc@goptd@fontcolor\pc@hyenc@fontcolorpdfcommentcolor\HyColor@XZeroOneThreeFour\pc@goptd@icolor\pc@hyenc@icolorpdfcommentcolor\pdfmark[MW]pdfmark=/ANN,Subtype=/Widget,Raw=/TU (Milky Way\textCR(\pc@goptd@deadline)) /T (tooltip zref@408) /C [ ] /FT/Btn /F 768 /Ff 65536 /H/N /BS ¡¡ /W 0 ¿¿ , the wavelength-dependent linear polarization fraction, caused by this process, follows the Serkowski, Mathewson & Ford (1975) law. It is efficient from the Near-\HyColor@XZeroOneThreeFour\pc@goptd@color\pc@hyenc@colorpdfcommentcolor\HyColor@XZeroOneThreeFour\pc@goptd@fontcolor\pc@hyenc@fontcolorpdfcommentcolor\HyColor@XZeroOneThreeFour\pc@goptd@icolor\pc@hyenc@icolorpdfcommentcolor\pdfmark[UV]pdfmark=/ANN,Subtype=/Widget,Raw=/TU (Ultraviolet\textCR(\pc@goptd@deadline)) /T (tooltip zref@409) /C [ ] /FT/Btn /F 768 /Ff 65536 /H/N /BS ¡¡ /W 0 ¿¿ (\HyColor@XZeroOneThreeFour\pc@goptd@color\pc@hyenc@colorpdfcommentcolor\HyColor@XZeroOneThreeFour\pc@goptd@fontcolor\pc@hyenc@fontcolorpdfcommentcolor\HyColor@XZeroOneThreeFour\pc@goptd@icolor\pc@hyenc@icolorpdfcommentcolor\pdfmark[NUV]pdfmark=/ANN,Subtype=/Widget,Raw=/TU (Near-ultraviolet\textCR(\pc@goptd@deadline)) /T (tooltip zref@410) /C [ ] /FT/Btn /F 768 /Ff 65536 /H/N /BS ¡¡ /W 0 ¿¿ ) to the \HyColor@XZeroOneThreeFour\pc@goptd@color\pc@hyenc@colorpdfcommentcolor\HyColor@XZeroOneThreeFour\pc@goptd@fontcolor\pc@hyenc@fontcolorpdfcommentcolor\HyColor@XZeroOneThreeFour\pc@goptd@icolor\pc@hyenc@icolorpdfcommentcolor\pdfmark[NIR]pdfmark=/ANN,Subtype=/Widget,Raw=/TU (Near-infrared\textCR(\pc@goptd@deadline)) /T (tooltip zref@411) /C [ ] /FT/Btn /F 768 /Ff 65536 /H/N /BS ¡¡ /W 0 ¿¿ , peaking around .
7.0.3 Dichroic emission
The thermal emission from magnetically-aligned elongated grains is polarized, perpendicular to the magnetic field. The wavelength-dependent fraction of linear polarization is rather flat over the whole \HyColor@XZeroOneThreeFour\pc@goptd@color\pc@hyenc@colorpdfcommentcolor\HyColor@XZeroOneThreeFour\pc@goptd@fontcolor\pc@hyenc@fontcolorpdfcommentcolor\HyColor@XZeroOneThreeFour\pc@goptd@icolor\pc@hyenc@icolorpdfcommentcolor\pdfmark[FIR]pdfmark=/ANN,Subtype=/Widget,Raw=/TU (Far-infrared\textCR(\pc@goptd@deadline)) /T (tooltip zref@412) /C [ ] /FT/Btn /F 768 /Ff 65536 /H/N /BS ¡¡ /W 0 ¿¿ -to-\HyColor@XZeroOneThreeFour\pc@goptd@color\pc@hyenc@colorpdfcommentcolor\HyColor@XZeroOneThreeFour\pc@goptd@fontcolor\pc@hyenc@fontcolorpdfcommentcolor\HyColor@XZeroOneThreeFour\pc@goptd@icolor\pc@hyenc@icolorpdfcommentcolor\pdfmark[submm]pdfmark=/ANN,Subtype=/Widget,Raw=/TU (Submillimeter\textCR(\pc@goptd@deadline)) /T (tooltip zref@413) /C [ ] /FT/Btn /F 768 /Ff 65536 /H/N /BS ¡¡ /W 0 ¿¿ regime (e.g. Guillet et al., 2017).
7.0.4 The Geometry of Complex Regions
Polarization can provide information on the geometry of unresolved or poorly constrained sources. Most noticeably, the polarimetric observations of the central region of the archetypal Seyfert 2 galaxy, NGC 1068, were interpreted as the scattering of light from the central accretion disk, obscured by a dusty torus (Antonucci & Miller, 1985). These results were a major step towards the unified \HyColor@XZeroOneThreeFour\pc@goptd@color\pc@hyenc@colorpdfcommentcolor\HyColor@XZeroOneThreeFour\pc@goptd@fontcolor\pc@hyenc@fontcolorpdfcommentcolor\HyColor@XZeroOneThreeFour\pc@goptd@icolor\pc@hyenc@icolorpdfcommentcolor\pdfmark[AGN]pdfmark=/ANN,Subtype=/Widget,Raw=/TU (Active galactic nuclues\textCR(\pc@goptd@deadline)) /T (tooltip zref@414) /C [ ] /FT/Btn /F 768 /Ff 65536 /H/N /BS ¡¡ /W 0 ¿¿ model, attributing the differences in observed properties of Seyfert galaxies to the difference in orientation of the central source (Antonucci, 1993). Apart from \HyColor@XZeroOneThreeFour\pc@goptd@color\pc@hyenc@colorpdfcommentcolor\HyColor@XZeroOneThreeFour\pc@goptd@fontcolor\pc@hyenc@fontcolorpdfcommentcolor\HyColor@XZeroOneThreeFour\pc@goptd@icolor\pc@hyenc@icolorpdfcommentcolor\pdfmark[AGN]pdfmark=/ANN,Subtype=/Widget,Raw=/TU (Active galactic nuclues\textCR(\pc@goptd@deadline)) /T (tooltip zref@415) /C [ ] /FT/Btn /F 768 /Ff 65536 /H/N /BS ¡¡ /W 0 ¿¿ , the \HyColor@XZeroOneThreeFour\pc@goptd@color\pc@hyenc@colorpdfcommentcolor\HyColor@XZeroOneThreeFour\pc@goptd@fontcolor\pc@hyenc@fontcolorpdfcommentcolor\HyColor@XZeroOneThreeFour\pc@goptd@icolor\pc@hyenc@icolorpdfcommentcolor\pdfmark[NIR]pdfmark=/ANN,Subtype=/Widget,Raw=/TU (Near-infrared\textCR(\pc@goptd@deadline)) /T (tooltip zref@416) /C [ ] /FT/Btn /F 768 /Ff 65536 /H/N /BS ¡¡ /W 0 ¿¿ polarimetry of M 82 has contributed revealing a central nuclear star forming ring (Dietz et al., 1989).
Polarization studies have also shed light on the nature of diffuse \HyColor@XZeroOneThreeFour\pc@goptd@color\pc@hyenc@colorpdfcommentcolor\HyColor@XZeroOneThreeFour\pc@goptd@fontcolor\pc@hyenc@fontcolorpdfcommentcolor\HyColor@XZeroOneThreeFour\pc@goptd@icolor\pc@hyenc@icolorpdfcommentcolor\pdfmark[UV]pdfmark=/ANN,Subtype=/Widget,Raw=/TU (Ultraviolet\textCR(\pc@goptd@deadline)) /T (tooltip zref@417) /C [ ] /FT/Btn /F 768 /Ff 65536 /H/N /BS ¡¡ /W 0 ¿¿ halos of star forming galaxies: are those made of purely scattered light, or is there a faint stellar population? The observations of edge-on galaxies, like NGC 3125 (Alton et al., 1994) or M 82 (Yoshida, Kawabata & Ohyama, 2011) have revealed that their dusty outflows were scattering light from the central starburst. Cole et al. (1999) also studied the polarization of star forming regions in the \HyColor@XZeroOneThreeFour\pc@goptd@color\pc@hyenc@colorpdfcommentcolor\HyColor@XZeroOneThreeFour\pc@goptd@fontcolor\pc@hyenc@fontcolorpdfcommentcolor\HyColor@XZeroOneThreeFour\pc@goptd@icolor\pc@hyenc@icolorpdfcommentcolor\pdfmark[LMC]pdfmark=/ANN,Subtype=/Widget,Raw=/TU (Large Magellanic cloud\textCR(\pc@goptd@deadline)) /T (tooltip zref@418) /C [ ] /FT/Btn /F 768 /Ff 65536 /H/N /BS ¡¡ /W 0 ¿¿ to constrain the extent of their \HyColor@XZeroOneThreeFour\pc@goptd@color\pc@hyenc@colorpdfcommentcolor\HyColor@XZeroOneThreeFour\pc@goptd@fontcolor\pc@hyenc@fontcolorpdfcommentcolor\HyColor@XZeroOneThreeFour\pc@goptd@icolor\pc@hyenc@icolorpdfcommentcolor\pdfmark[UV]pdfmark=/ANN,Subtype=/Widget,Raw=/TU (Ultraviolet\textCR(\pc@goptd@deadline)) /T (tooltip zref@419) /C [ ] /FT/Btn /F 768 /Ff 65536 /H/N /BS ¡¡ /W 0 ¿¿ halos.
7.0.5 The Structure of the Magnetic Field
In case of dichroic extinction or emission, the polarization angle provides a map of the projected magnetic field. Such studies were performed in the \HyColor@XZeroOneThreeFour\pc@goptd@color\pc@hyenc@colorpdfcommentcolor\HyColor@XZeroOneThreeFour\pc@goptd@fontcolor\pc@hyenc@fontcolorpdfcommentcolor\HyColor@XZeroOneThreeFour\pc@goptd@icolor\pc@hyenc@icolorpdfcommentcolor\pdfmark[NIR]pdfmark=/ANN,Subtype=/Widget,Raw=/TU (Near-infrared\textCR(\pc@goptd@deadline)) /T (tooltip zref@420) /C [ ] /FT/Btn /F 768 /Ff 65536 /H/N /BS ¡¡ /W 0 ¿¿ /visible, among others, in NGC 891 (Montgomery & Clemens, 2014), M 82 (Greaves et al., 2000; Jones, 2000), the \HyColor@XZeroOneThreeFour\pc@goptd@color\pc@hyenc@colorpdfcommentcolor\HyColor@XZeroOneThreeFour\pc@goptd@fontcolor\pc@hyenc@fontcolorpdfcommentcolor\HyColor@XZeroOneThreeFour\pc@goptd@icolor\pc@hyenc@icolorpdfcommentcolor\pdfmark[SMC]pdfmark=/ANN,Subtype=/Widget,Raw=/TU (Small Magellanic cloud\textCR(\pc@goptd@deadline)) /T (tooltip zref@421) /C [ ] /FT/Btn /F 768 /Ff 65536 /H/N /BS ¡¡ /W 0 ¿¿ (Lobo Gomes et al., 2015), NGC 6946 (Fendt, Beck & Neininger, 1998) and the dust lane of Cen A (Scarrott et al., 1996).
7.0.6 The Dust Composition
The wavelength-dependent shape of the polarization fraction provides valuable information on the dust constitution. In particular, studies of M 31 (Clayton et al., 2004), M 82 (Kawabata et al., 2014), the \HyColor@XZeroOneThreeFour\pc@goptd@color\pc@hyenc@colorpdfcommentcolor\HyColor@XZeroOneThreeFour\pc@goptd@fontcolor\pc@hyenc@fontcolorpdfcommentcolor\HyColor@XZeroOneThreeFour\pc@goptd@icolor\pc@hyenc@icolorpdfcommentcolor\pdfmark[LMC]pdfmark=/ANN,Subtype=/Widget,Raw=/TU (Large Magellanic cloud\textCR(\pc@goptd@deadline)) /T (tooltip zref@422) /C [ ] /FT/Btn /F 768 /Ff 65536 /H/N /BS ¡¡ /W 0 ¿¿ (Clayton et al., 1996) and the \HyColor@XZeroOneThreeFour\pc@goptd@color\pc@hyenc@colorpdfcommentcolor\HyColor@XZeroOneThreeFour\pc@goptd@fontcolor\pc@hyenc@fontcolorpdfcommentcolor\HyColor@XZeroOneThreeFour\pc@goptd@icolor\pc@hyenc@icolorpdfcommentcolor\pdfmark[SMC]pdfmark=/ANN,Subtype=/Widget,Raw=/TU (Small Magellanic cloud\textCR(\pc@goptd@deadline)) /T (tooltip zref@423) /C [ ] /FT/Btn /F 768 /Ff 65536 /H/N /BS ¡¡ /W 0 ¿¿ (Rodrigues et al., 1997) all concluded that the polarizing grains were smaller in these objects than in the \HyColor@XZeroOneThreeFour\pc@goptd@color\pc@hyenc@colorpdfcommentcolor\HyColor@XZeroOneThreeFour\pc@goptd@fontcolor\pc@hyenc@fontcolorpdfcommentcolor\HyColor@XZeroOneThreeFour\pc@goptd@icolor\pc@hyenc@icolorpdfcommentcolor\pdfmark[MW]pdfmark=/ANN,Subtype=/Widget,Raw=/TU (Milky Way\textCR(\pc@goptd@deadline)) /T (tooltip zref@424) /C [ ] /FT/Btn /F 768 /Ff 65536 /H/N /BS ¡¡ /W 0 ¿¿ . Polarimetry can also be used to discriminate models. For instance, Mason et al. (2007) studied the polarization of the 3.4 aliphatic band in order to test the silicate core/organic mantle model (Li & Greenberg, 2002). They observed the interstellar medium of NGC 1068 in absorption towards its central engine. If the carriers of the 3.4 band were onto large grains, the feature would be significantly polarized, which is not the case.
7.1 Dust-Related Epiphenomena
7.1.1 Dust Observables in the X-Rays
Dust absorbs and scatters X-rays. First, the photoelectric absorption edges of elements locked-up in grains contain potential information on their chemical structure (e.g. Lee et al., 2009). For instance, Zeegers et al. (2017) studied the Si K-edge along the line of sight of a Galactic X-ray binary. They were able to constrain the column density and the chemical composition of the silicate grains. Second, X-ray scattering halos can be used to constrain dust models (e.g. Smith, Valencic & Corrales, 2016). As an illustration, Corrales & Paerels (2015) modelled the X-ray halo around Cygnus X-3. They were able to put constraints on the size distribution, especially on the large grain cut-off. Lastly, Draine & Bond (2004) made a case that time-varying X-ray halo could be used to estimate distances of nearby galaxies, down to accuracy for M 31.
Among external galaxies, the dust-scattering X-ray halos of several -ray bursts have been observed (e.g. Evans et al., 2014). However, to our knowledge, no such study has been conducted in nearby galaxies.
7.1.2 The Diffuse Interstellar Bands
@goptd@color\pc@hyenc@colorpdfcommentcolor\HyColor@XZeroOneThreeFour\pc@goptd@fontcolor\pc@hyenc@fontcolorpdfcommentcolor\HyColor@XZeroOneThreeFour\pc@goptd@icolor\pc@hyenc@icolorpdfcommentcolor\pdfmark[DIB]pdfmark=/ANN,Subtype=/Widget,Raw=/TU (Diffuse interstellar band\textCR(\pc@goptd@deadline)) /T (tooltip zref@425) /C [ ] /FT/Btn /F 768 /Ff 65536 /H/N /BS ¡¡ /W 0 ¿¿ s are ubiquitous absorption features in the range. Over 400 of them have been detected in the \HyColor@XZeroOneThreeFour\pc@goptd@color\pc@hyenc@colorpdfcommentcolor\HyColor@XZeroOneThreeFour\pc@goptd@fontcolor\pc@hyenc@fontcolorpdfcommentcolor\HyColor@XZeroOneThreeFour\pc@goptd@icolor\pc@hyenc@icolorpdfcommentcolor\pdfmark[ISM]pdfmark=/ANN,Subtype=/Widget,Raw=/TU (Interstellar medium\textCR(\pc@goptd@deadline)) /T (tooltip zref@426) /C [ ] /FT/Btn /F 768 /Ff 65536 /H/N /BS ¡¡ /W 0 ¿¿ (Hobbs et al., 2009), since their discovery, a century ago (Heger, 1922). They remain largely unidentified, although four of them have been attributed to C (Campbell et al., 2015). They are associated to dust, as their strength correlates with at low values, but they disappear in denser sightlines (e.g. Lan, Ménard & Zhu, 2015). To first order, \HyColor@XZeroOneThreeFour\pc@goptd@color\pc@hyenc@colorpdfcommentcolor\HyColor@XZeroOneThreeFour\pc@goptd@fontcolor\pc@hyenc@fontcolorpdfcommentcolor\HyColor@XZeroOneThreeFour\pc@goptd@icolor\pc@hyenc@icolorpdfcommentcolor\pdfmark[DIB]pdfmark=/ANN,Subtype=/Widget,Raw=/TU (Diffuse interstellar band\textCR(\pc@goptd@deadline)) /T (tooltip zref@427) /C [ ] /FT/Btn /F 768 /Ff 65536 /H/N /BS ¡¡ /W 0 ¿¿ s correlate with each other, but there are some notable differences, suggesting that they have different carriers (Herbig, 1995). For instance, the so-called C2 \HyColor@XZeroOneThreeFour\pc@goptd@color\pc@hyenc@colorpdfcommentcolor\HyColor@XZeroOneThreeFour\pc@goptd@fontcolor\pc@hyenc@fontcolorpdfcommentcolor\HyColor@XZeroOneThreeFour\pc@goptd@icolor\pc@hyenc@icolorpdfcommentcolor\pdfmark[DIB]pdfmark=/ANN,Subtype=/Widget,Raw=/TU (Diffuse interstellar band\textCR(\pc@goptd@deadline)) /T (tooltip zref@428) /C [ ] /FT/Btn /F 768 /Ff 65536 /H/N /BS ¡¡ /W 0 ¿¿ s (Thorburn et al., 2003) appear to be found preferentially in diffuse molecular clouds.
@goptd@color\pc@hyenc@colorpdfcommentcolor\HyColor@XZeroOneThreeFour\pc@goptd@fontcolor\pc@hyenc@fontcolorpdfcommentcolor\HyColor@XZeroOneThreeFour\pc@goptd@icolor\pc@hyenc@icolorpdfcommentcolor\pdfmark[DIB]pdfmark=/ANN,Subtype=/Widget,Raw=/TU (Diffuse interstellar band\textCR(\pc@goptd@deadline)) /T (tooltip zref@429) /C [ ] /FT/Btn /F 768 /Ff 65536 /H/N /BS ¡¡ /W 0 ¿¿ s are abundantly observed in external galaxies, including distant objects, like \HyColor@XZeroOneThreeFour\pc@goptd@color\pc@hyenc@colorpdfcommentcolor\HyColor@XZeroOneThreeFour\pc@goptd@fontcolor\pc@hyenc@fontcolorpdfcommentcolor\HyColor@XZeroOneThreeFour\pc@goptd@icolor\pc@hyenc@icolorpdfcommentcolor\pdfmark[DLA]pdfmark=/ANN,Subtype=/Widget,Raw=/TU (Damped Lyman-alpha systems\textCR(\pc@goptd@deadline)) /T (tooltip zref@430) /C [ ] /FT/Btn /F 768 /Ff 65536 /H/N /BS ¡¡ /W 0 ¿¿ s (e.g. Lawton et al., 2008). As a narrow spectral feature, they can easily be separated in velocity from the foreground Galactic features. They are observed in the \HyColor@XZeroOneThreeFour\pc@goptd@color\pc@hyenc@colorpdfcommentcolor\HyColor@XZeroOneThreeFour\pc@goptd@fontcolor\pc@hyenc@fontcolorpdfcommentcolor\HyColor@XZeroOneThreeFour\pc@goptd@icolor\pc@hyenc@icolorpdfcommentcolor\pdfmark[ISM]pdfmark=/ANN,Subtype=/Widget,Raw=/TU (Interstellar medium\textCR(\pc@goptd@deadline)) /T (tooltip zref@431) /C [ ] /FT/Btn /F 768 /Ff 65536 /H/N /BS ¡¡ /W 0 ¿¿ of nearby galaxies along the lines of sight of: (1) stars, in M 33 (Cordiner et al., 2008), M 31 (Cordiner et al., 2011) and the Magellanic clouds (e.g. Welty et al., 2006; van Loon et al., 2013; Bailey et al., 2015), among others; (2) SN II, in Cen A (Phillips et al., 1987; D’Odorico et al., 1989), M 66 (Bolte et al., 1989), the \HyColor@XZeroOneThreeFour\pc@goptd@color\pc@hyenc@colorpdfcommentcolor\HyColor@XZeroOneThreeFour\pc@goptd@fontcolor\pc@hyenc@fontcolorpdfcommentcolor\HyColor@XZeroOneThreeFour\pc@goptd@icolor\pc@hyenc@icolorpdfcommentcolor\pdfmark[LMC]pdfmark=/ANN,Subtype=/Widget,Raw=/TU (Large Magellanic cloud\textCR(\pc@goptd@deadline)) /T (tooltip zref@432) /C [ ] /FT/Btn /F 768 /Ff 65536 /H/N /BS ¡¡ /W 0 ¿¿ (Vidal-Madjar et al., 1987), M 100 (Cox & Patat, 2008), M 82 (e.g. Welty et al., 2014), among others; (3) SN Ia (e.g. Sollerman et al., 2005; Huang et al., 2017); and (4) lenticular galaxies (Ritchey & Wallerstein, 2015).
In solar metallicity, normal galaxies, the strengths of the \HyColor@XZeroOneThreeFour\pc@goptd@color\pc@hyenc@colorpdfcommentcolor\HyColor@XZeroOneThreeFour\pc@goptd@fontcolor\pc@hyenc@fontcolorpdfcommentcolor\HyColor@XZeroOneThreeFour\pc@goptd@icolor\pc@hyenc@icolorpdfcommentcolor\pdfmark[DIB]pdfmark=/ANN,Subtype=/Widget,Raw=/TU (Diffuse interstellar band\textCR(\pc@goptd@deadline)) /T (tooltip zref@433) /C [ ] /FT/Btn /F 768 /Ff 65536 /H/N /BS ¡¡ /W 0 ¿¿ s and their relation to seem to be similar to those of the \HyColor@XZeroOneThreeFour\pc@goptd@color\pc@hyenc@colorpdfcommentcolor\HyColor@XZeroOneThreeFour\pc@goptd@fontcolor\pc@hyenc@fontcolorpdfcommentcolor\HyColor@XZeroOneThreeFour\pc@goptd@icolor\pc@hyenc@icolorpdfcommentcolor\pdfmark[MW]pdfmark=/ANN,Subtype=/Widget,Raw=/TU (Milky Way\textCR(\pc@goptd@deadline)) /T (tooltip zref@434) /C [ ] /FT/Btn /F 768 /Ff 65536 /H/N /BS ¡¡ /W 0 ¿¿ (Heckman & Lehnert, 2000; Sollerman et al., 2005; Cordiner et al., 2011; Huang et al., 2017), although some differences can be found (e.g. in M 100, M 33 and M 82; Cox & Patat, 2008; Cordiner et al., 2008; Welty et al., 2014). In contrast, the largest deviations are found in the Magellanic clouds. Welty et al. (2006) reported that the \HyColor@XZeroOneThreeFour\pc@goptd@color\pc@hyenc@colorpdfcommentcolor\HyColor@XZeroOneThreeFour\pc@goptd@fontcolor\pc@hyenc@fontcolorpdfcommentcolor\HyColor@XZeroOneThreeFour\pc@goptd@icolor\pc@hyenc@icolorpdfcommentcolor\pdfmark[DIB]pdfmark=/ANN,Subtype=/Widget,Raw=/TU (Diffuse interstellar band\textCR(\pc@goptd@deadline)) /T (tooltip zref@435) /C [ ] /FT/Btn /F 768 /Ff 65536 /H/N /BS ¡¡ /W 0 ¿¿ s are weaker in the \HyColor@XZeroOneThreeFour\pc@goptd@color\pc@hyenc@colorpdfcommentcolor\HyColor@XZeroOneThreeFour\pc@goptd@fontcolor\pc@hyenc@fontcolorpdfcommentcolor\HyColor@XZeroOneThreeFour\pc@goptd@icolor\pc@hyenc@icolorpdfcommentcolor\pdfmark[LMC]pdfmark=/ANN,Subtype=/Widget,Raw=/TU (Large Magellanic cloud\textCR(\pc@goptd@deadline)) /T (tooltip zref@436) /C [ ] /FT/Btn /F 768 /Ff 65536 /H/N /BS ¡¡ /W 0 ¿¿ and \HyColor@XZeroOneThreeFour\pc@goptd@color\pc@hyenc@colorpdfcommentcolor\HyColor@XZeroOneThreeFour\pc@goptd@fontcolor\pc@hyenc@fontcolorpdfcommentcolor\HyColor@XZeroOneThreeFour\pc@goptd@icolor\pc@hyenc@icolorpdfcommentcolor\pdfmark[SMC]pdfmark=/ANN,Subtype=/Widget,Raw=/TU (Small Magellanic cloud\textCR(\pc@goptd@deadline)) /T (tooltip zref@437) /C [ ] /FT/Btn /F 768 /Ff 65536 /H/N /BS ¡¡ /W 0 ¿¿ , compared to the \HyColor@XZeroOneThreeFour\pc@goptd@color\pc@hyenc@colorpdfcommentcolor\HyColor@XZeroOneThreeFour\pc@goptd@fontcolor\pc@hyenc@fontcolorpdfcommentcolor\HyColor@XZeroOneThreeFour\pc@goptd@icolor\pc@hyenc@icolorpdfcommentcolor\pdfmark[MW]pdfmark=/ANN,Subtype=/Widget,Raw=/TU (Milky Way\textCR(\pc@goptd@deadline)) /T (tooltip zref@438) /C [ ] /FT/Btn /F 768 /Ff 65536 /H/N /BS ¡¡ /W 0 ¿¿ , by factors of and , respectively. However, they found that the C2 \HyColor@XZeroOneThreeFour\pc@goptd@color\pc@hyenc@colorpdfcommentcolor\HyColor@XZeroOneThreeFour\pc@goptd@fontcolor\pc@hyenc@fontcolorpdfcommentcolor\HyColor@XZeroOneThreeFour\pc@goptd@icolor\pc@hyenc@icolorpdfcommentcolor\pdfmark[DIB]pdfmark=/ANN,Subtype=/Widget,Raw=/TU (Diffuse interstellar band\textCR(\pc@goptd@deadline)) /T (tooltip zref@439) /C [ ] /FT/Btn /F 768 /Ff 65536 /H/N /BS ¡¡ /W 0 ¿¿ s have the same strength per H atom as in the Galaxy. \HyColor@XZeroOneThreeFour\pc@goptd@color\pc@hyenc@colorpdfcommentcolor\HyColor@XZeroOneThreeFour\pc@goptd@fontcolor\pc@hyenc@fontcolorpdfcommentcolor\HyColor@XZeroOneThreeFour\pc@goptd@icolor\pc@hyenc@icolorpdfcommentcolor\pdfmark[DIB]pdfmark=/ANN,Subtype=/Widget,Raw=/TU (Diffuse interstellar band\textCR(\pc@goptd@deadline)) /T (tooltip zref@440) /C [ ] /FT/Btn /F 768 /Ff 65536 /H/N /BS ¡¡ /W 0 ¿¿ spectra appear to be controlled by the \HyColor@XZeroOneThreeFour\pc@goptd@color\pc@hyenc@colorpdfcommentcolor\HyColor@XZeroOneThreeFour\pc@goptd@fontcolor\pc@hyenc@fontcolorpdfcommentcolor\HyColor@XZeroOneThreeFour\pc@goptd@icolor\pc@hyenc@icolorpdfcommentcolor\pdfmark[UV]pdfmark=/ANN,Subtype=/Widget,Raw=/TU (Ultraviolet\textCR(\pc@goptd@deadline)) /T (tooltip zref@441) /C [ ] /FT/Btn /F 768 /Ff 65536 /H/N /BS ¡¡ /W 0 ¿¿ field intensity (Cox et al., 2006), with disappearance of the features in the ionized gas or in high \HyColor@XZeroOneThreeFour\pc@goptd@color\pc@hyenc@colorpdfcommentcolor\HyColor@XZeroOneThreeFour\pc@goptd@fontcolor\pc@hyenc@fontcolorpdfcommentcolor\HyColor@XZeroOneThreeFour\pc@goptd@icolor\pc@hyenc@icolorpdfcommentcolor\pdfmark[UV]pdfmark=/ANN,Subtype=/Widget,Raw=/TU (Ultraviolet\textCR(\pc@goptd@deadline)) /T (tooltip zref@442) /C [ ] /FT/Btn /F 768 /Ff 65536 /H/N /BS ¡¡ /W 0 ¿¿ field (van Loon et al., 2013; Bailey et al., 2015). \HyColor@XZeroOneThreeFour\pc@goptd@color\pc@hyenc@colorpdfcommentcolor\HyColor@XZeroOneThreeFour\pc@goptd@fontcolor\pc@hyenc@fontcolorpdfcommentcolor\HyColor@XZeroOneThreeFour\pc@goptd@icolor\pc@hyenc@icolorpdfcommentcolor\pdfmark[DIB]pdfmark=/ANN,Subtype=/Widget,Raw=/TU (Diffuse interstellar band\textCR(\pc@goptd@deadline)) /T (tooltip zref@443) /C [ ] /FT/Btn /F 768 /Ff 65536 /H/N /BS ¡¡ /W 0 ¿¿ strength also scales with metallicity, due to both lower shielding and lower elemental abundances (Cox et al., 2007; Bailey et al., 2015). Finally, \HyColor@XZeroOneThreeFour\pc@goptd@color\pc@hyenc@colorpdfcommentcolor\HyColor@XZeroOneThreeFour\pc@goptd@fontcolor\pc@hyenc@fontcolorpdfcommentcolor\HyColor@XZeroOneThreeFour\pc@goptd@icolor\pc@hyenc@icolorpdfcommentcolor\pdfmark[DIB]pdfmark=/ANN,Subtype=/Widget,Raw=/TU (Diffuse interstellar band\textCR(\pc@goptd@deadline)) /T (tooltip zref@444) /C [ ] /FT/Btn /F 768 /Ff 65536 /H/N /BS ¡¡ /W 0 ¿¿ s appear to be linked with the shape of the extinction curve. Cox et al. (2007) demonstrated that the sightlines with weak or non-existent 2175 Å bump are those with weak or non-existent \HyColor@XZeroOneThreeFour\pc@goptd@color\pc@hyenc@colorpdfcommentcolor\HyColor@XZeroOneThreeFour\pc@goptd@fontcolor\pc@hyenc@fontcolorpdfcommentcolor\HyColor@XZeroOneThreeFour\pc@goptd@icolor\pc@hyenc@icolorpdfcommentcolor\pdfmark[DIB]pdfmark=/ANN,Subtype=/Widget,Raw=/TU (Diffuse interstellar band\textCR(\pc@goptd@deadline)) /T (tooltip zref@445) /C [ ] /FT/Btn /F 768 /Ff 65536 /H/N /BS ¡¡ /W 0 ¿¿ s, in the \HyColor@XZeroOneThreeFour\pc@goptd@color\pc@hyenc@colorpdfcommentcolor\HyColor@XZeroOneThreeFour\pc@goptd@fontcolor\pc@hyenc@fontcolorpdfcommentcolor\HyColor@XZeroOneThreeFour\pc@goptd@icolor\pc@hyenc@icolorpdfcommentcolor\pdfmark[SMC]pdfmark=/ANN,Subtype=/Widget,Raw=/TU (Small Magellanic cloud\textCR(\pc@goptd@deadline)) /T (tooltip zref@446) /C [ ] /FT/Btn /F 768 /Ff 65536 /H/N /BS ¡¡ /W 0 ¿¿ .
7.1.3 Grain Photoluminescence
Photoluminescence is a non-thermal emission process in which, subsequently to the absorption of a \HyColor@XZeroOneThreeFour\pc@goptd@color\pc@hyenc@colorpdfcommentcolor\HyColor@XZeroOneThreeFour\pc@goptd@fontcolor\pc@hyenc@fontcolorpdfcommentcolor\HyColor@XZeroOneThreeFour\pc@goptd@icolor\pc@hyenc@icolorpdfcommentcolor\pdfmark[UV]pdfmark=/ANN,Subtype=/Widget,Raw=/TU (Ultraviolet\textCR(\pc@goptd@deadline)) /T (tooltip zref@447) /C [ ] /FT/Btn /F 768 /Ff 65536 /H/N /BS ¡¡ /W 0 ¿¿ photon, a grain is brought to an excited electronic state. After partial internal relaxation, a redder photon is emitted, bringing the electron back to its fundamental state. The \HyColor@XZeroOneThreeFour\pc@goptd@color\pc@hyenc@colorpdfcommentcolor\HyColor@XZeroOneThreeFour\pc@goptd@fontcolor\pc@hyenc@fontcolorpdfcommentcolor\HyColor@XZeroOneThreeFour\pc@goptd@icolor\pc@hyenc@icolorpdfcommentcolor\pdfmark[ERE]pdfmark=/ANN,Subtype=/Widget,Raw=/TU (Extended red emission\textCR(\pc@goptd@deadline)) /T (tooltip zref@448) /C [ ] /FT/Btn /F 768 /Ff 65536 /H/N /BS ¡¡ /W 0 ¿¿ , which is a broad emission band, found in the range of a diversity of Galactic environments, is attributed to dust photoluminescence (e.g. Witt & Vijh, 2004). The nature of its carriers is still debated.
In nearby galaxies, \HyColor@XZeroOneThreeFour\pc@goptd@color\pc@hyenc@colorpdfcommentcolor\HyColor@XZeroOneThreeFour\pc@goptd@fontcolor\pc@hyenc@fontcolorpdfcommentcolor\HyColor@XZeroOneThreeFour\pc@goptd@icolor\pc@hyenc@icolorpdfcommentcolor\pdfmark[ERE]pdfmark=/ANN,Subtype=/Widget,Raw=/TU (Extended red emission\textCR(\pc@goptd@deadline)) /T (tooltip zref@449) /C [ ] /FT/Btn /F 768 /Ff 65536 /H/N /BS ¡¡ /W 0 ¿¿ has been spectroscopically detected in the star forming region 30 Dor (\HyColor@XZeroOneThreeFour\pc@goptd@color\pc@hyenc@colorpdfcommentcolor\HyColor@XZeroOneThreeFour\pc@goptd@fontcolor\pc@hyenc@fontcolorpdfcommentcolor\HyColor@XZeroOneThreeFour\pc@goptd@icolor\pc@hyenc@icolorpdfcommentcolor\pdfmark[LMC]pdfmark=/ANN,Subtype=/Widget,Raw=/TU (Large Magellanic cloud\textCR(\pc@goptd@deadline)) /T (tooltip zref@450) /C [ ] /FT/Btn /F 768 /Ff 65536 /H/N /BS ¡¡ /W 0 ¿¿ ; Darbon, Perrin & Sivan, 1998), in M 82 (Perrin, Darbon & Sivan, 1995) and NGC 4826 (Pierini et al., 2002). In the dwarf galaxies SBS 0335-052 and NGC 4449, Reines, Johnson & Hunt (2008) and Reines, Johnson & Goss (2008) modelled the photometric observations of several Super Star Clusters (\HyColor@XZeroOneThreeFour\pc@goptd@color\pc@hyenc@colorpdfcommentcolor\HyColor@XZeroOneThreeFour\pc@goptd@fontcolor\pc@hyenc@fontcolorpdfcommentcolor\HyColor@XZeroOneThreeFour\pc@goptd@icolor\pc@hyenc@icolorpdfcommentcolor\pdfmark[SSC]pdfmark=/ANN,Subtype=/Widget,Raw=/TU (Super Star Cluster\textCR(\pc@goptd@deadline)) /T (tooltip zref@451) /C [ ] /FT/Btn /F 768 /Ff 65536 /H/N /BS ¡¡ /W 0 ¿¿ ). Their result exhibit a significant \HyColor@XZeroOneThreeFour\pc@goptd@color\pc@hyenc@colorpdfcommentcolor\HyColor@XZeroOneThreeFour\pc@goptd@fontcolor\pc@hyenc@fontcolorpdfcommentcolor\HyColor@XZeroOneThreeFour\pc@goptd@icolor\pc@hyenc@icolorpdfcommentcolor\pdfmark[-band]pdfmark=/ANN,Subtype=/Widget,Raw=/TU (880 nm\textCR(\pc@goptd@deadline)) /T (tooltip zref@452) /C [ ] /FT/Btn /F 768 /Ff 65536 /H/N /BS ¡¡ /W 0 ¿¿ excess that they attributed to \HyColor@XZeroOneThreeFour\pc@goptd@color\pc@hyenc@colorpdfcommentcolor\HyColor@XZeroOneThreeFour\pc@goptd@fontcolor\pc@hyenc@fontcolorpdfcommentcolor\HyColor@XZeroOneThreeFour\pc@goptd@icolor\pc@hyenc@icolorpdfcommentcolor\pdfmark[ERE]pdfmark=/ANN,Subtype=/Widget,Raw=/TU (Extended red emission\textCR(\pc@goptd@deadline)) /T (tooltip zref@453) /C [ ] /FT/Btn /F 768 /Ff 65536 /H/N /BS ¡¡ /W 0 ¿¿ . However, Reines et al. (2010) admitted that this excess could be accounted for by continuum and line emission of the ionized gas, in NGC 4449.
7.1.4 The NIR Excess
An excess emission above the extrapolated stellar continuum is often detected in the \HyColor@XZeroOneThreeFour\pc@goptd@color\pc@hyenc@colorpdfcommentcolor\HyColor@XZeroOneThreeFour\pc@goptd@fontcolor\pc@hyenc@fontcolorpdfcommentcolor\HyColor@XZeroOneThreeFour\pc@goptd@icolor\pc@hyenc@icolorpdfcommentcolor\pdfmark[NIR]pdfmark=/ANN,Subtype=/Widget,Raw=/TU (Near-infrared\textCR(\pc@goptd@deadline)) /T (tooltip zref@454) /C [ ] /FT/Btn /F 768 /Ff 65536 /H/N /BS ¡¡ /W 0 ¿¿ range (Joseph et al., 1984; Hunt & Giovanardi, 1992). It is seen in disk galaxies (e.g. Lu et al., 2003; Boquien et al., 2011) and dwarf galaxies (e.g. Vanzi et al., 2000; Smith & Hancock, 2009). It potentially hampers our ability to accurately estimate the stellar mass from \HyColor@XZeroOneThreeFour\pc@goptd@color\pc@hyenc@colorpdfcommentcolor\HyColor@XZeroOneThreeFour\pc@goptd@fontcolor\pc@hyenc@fontcolorpdfcommentcolor\HyColor@XZeroOneThreeFour\pc@goptd@icolor\pc@hyenc@icolorpdfcommentcolor\pdfmark[NIR]pdfmark=/ANN,Subtype=/Widget,Raw=/TU (Near-infrared\textCR(\pc@goptd@deadline)) /T (tooltip zref@455) /C [ ] /FT/Btn /F 768 /Ff 65536 /H/N /BS ¡¡ /W 0 ¿¿ photometry. This excess could be due to: (1) nebular emission: Br line and free-free continuum (e.g. Smith & Hancock, 2009); (2) hot equilibrium dust (e.g. Vanzi et al., 2000), probably in circumstellar disks (Wood et al., 2008); (3) out-of-equilibrium small grains (e.g. Boquien et al., 2010).
Studying disk galaxies, Lu et al. (2003) describe this excess, having a color temperature of K and an intensity of a few percent of the total \HyColor@XZeroOneThreeFour\pc@goptd@color\pc@hyenc@colorpdfcommentcolor\HyColor@XZeroOneThreeFour\pc@goptd@fontcolor\pc@hyenc@fontcolorpdfcommentcolor\HyColor@XZeroOneThreeFour\pc@goptd@icolor\pc@hyenc@icolorpdfcommentcolor\pdfmark[FIR]pdfmark=/ANN,Subtype=/Widget,Raw=/TU (Far-infrared\textCR(\pc@goptd@deadline)) /T (tooltip zref@456) /C [ ] /FT/Btn /F 768 /Ff 65536 /H/N /BS ¡¡ /W 0 ¿¿ . They found this excess to correlate with the \HyColor@XZeroOneThreeFour\pc@goptd@color\pc@hyenc@colorpdfcommentcolor\HyColor@XZeroOneThreeFour\pc@goptd@fontcolor\pc@hyenc@fontcolorpdfcommentcolor\HyColor@XZeroOneThreeFour\pc@goptd@icolor\pc@hyenc@icolorpdfcommentcolor\pdfmark[UIB]pdfmark=/ANN,Subtype=/Widget,Raw=/TU (Unidentified infrared band\textCR(\pc@goptd@deadline)) /T (tooltip zref@457) /C [ ] /FT/Btn /F 768 /Ff 65536 /H/N /BS ¡¡ /W 0 ¿¿ intensity. In general, this excess correlates with \HyColor@XZeroOneThreeFour\pc@goptd@color\pc@hyenc@colorpdfcommentcolor\HyColor@XZeroOneThreeFour\pc@goptd@fontcolor\pc@hyenc@fontcolorpdfcommentcolor\HyColor@XZeroOneThreeFour\pc@goptd@icolor\pc@hyenc@icolorpdfcommentcolor\pdfmark[SFR]pdfmark=/ANN,Subtype=/Widget,Raw=/TU (Star formation rate\textCR(\pc@goptd@deadline)) /T (tooltip zref@458) /C [ ] /FT/Btn /F 768 /Ff 65536 /H/N /BS ¡¡ /W 0 ¿¿ indicators (Boquien et al., 2010; Mentuch, Abraham & Zibetti, 2010). The emissivity of the three proposed phenomena listed above correlates with star formation activity. In a filament of the \HyColor@XZeroOneThreeFour\pc@goptd@color\pc@hyenc@colorpdfcommentcolor\HyColor@XZeroOneThreeFour\pc@goptd@fontcolor\pc@hyenc@fontcolorpdfcommentcolor\HyColor@XZeroOneThreeFour\pc@goptd@icolor\pc@hyenc@icolorpdfcommentcolor\pdfmark[BCD]pdfmark=/ANN,Subtype=/Widget,Raw=/TU (Blue compact dwarf\textCR(\pc@goptd@deadline)) /T (tooltip zref@459) /C [ ] /FT/Btn /F 768 /Ff 65536 /H/N /BS ¡¡ /W 0 ¿¿ , NGC 1569, Onaka et al. (2010) showed spectroscopically that the nebular emission can not account for the excess, thus favoring hot dust.
7.1.5 The Submm Excess
An excess emission above the modelled dust continuum is often detected, longward . The most significant reports of this \HyColor@XZeroOneThreeFour\pc@goptd@color\pc@hyenc@colorpdfcommentcolor\HyColor@XZeroOneThreeFour\pc@goptd@fontcolor\pc@hyenc@fontcolorpdfcommentcolor\HyColor@XZeroOneThreeFour\pc@goptd@icolor\pc@hyenc@icolorpdfcommentcolor\pdfmark[submm]pdfmark=/ANN,Subtype=/Widget,Raw=/TU (Submillimeter\textCR(\pc@goptd@deadline)) /T (tooltip zref@460) /C [ ] /FT/Btn /F 768 /Ff 65536 /H/N /BS ¡¡ /W 0 ¿¿ excess can not be accounted for by (cf. Figure 1): free-free, synchrotron and molecular line emission (e.g. Galliano et al., 2003). The first occurence of such an excess was unveiled by Reach et al. (1995), studying the \HyColor@XZeroOneThreeFour\pc@goptd@color\pc@hyenc@colorpdfcommentcolor\HyColor@XZeroOneThreeFour\pc@goptd@fontcolor\pc@hyenc@fontcolorpdfcommentcolor\HyColor@XZeroOneThreeFour\pc@goptd@icolor\pc@hyenc@icolorpdfcommentcolor\pdfmark[COBE]pdfmark=/ANN,Subtype=/Widget,Raw=/TU (Cosmic Background Explorer (12-5000 microns; 1989-1993)\textCR(\pc@goptd@deadline)) /T (tooltip zref@461) /C [ ] /FT/Btn /F 768 /Ff 65536 /H/N /BS ¡¡ /W 0 ¿¿ observations of the \HyColor@XZeroOneThreeFour\pc@goptd@color\pc@hyenc@colorpdfcommentcolor\HyColor@XZeroOneThreeFour\pc@goptd@fontcolor\pc@hyenc@fontcolorpdfcommentcolor\HyColor@XZeroOneThreeFour\pc@goptd@icolor\pc@hyenc@icolorpdfcommentcolor\pdfmark[MW]pdfmark=/ANN,Subtype=/Widget,Raw=/TU (Milky Way\textCR(\pc@goptd@deadline)) /T (tooltip zref@462) /C [ ] /FT/Btn /F 768 /Ff 65536 /H/N /BS ¡¡ /W 0 ¿¿ . Their \HyColor@XZeroOneThreeFour\pc@goptd@color\pc@hyenc@colorpdfcommentcolor\HyColor@XZeroOneThreeFour\pc@goptd@fontcolor\pc@hyenc@fontcolorpdfcommentcolor\HyColor@XZeroOneThreeFour\pc@goptd@icolor\pc@hyenc@icolorpdfcommentcolor\pdfmark[IR]pdfmark=/ANN,Subtype=/Widget,Raw=/TU (Infrared\textCR(\pc@goptd@deadline)) /T (tooltip zref@463) /C [ ] /FT/Btn /F 768 /Ff 65536 /H/N /BS ¡¡ /W 0 ¿¿ –\HyColor@XZeroOneThreeFour\pc@goptd@color\pc@hyenc@colorpdfcommentcolor\HyColor@XZeroOneThreeFour\pc@goptd@fontcolor\pc@hyenc@fontcolorpdfcommentcolor\HyColor@XZeroOneThreeFour\pc@goptd@icolor\pc@hyenc@icolorpdfcommentcolor\pdfmark[submm]pdfmark=/ANN,Subtype=/Widget,Raw=/TU (Submillimeter\textCR(\pc@goptd@deadline)) /T (tooltip zref@464) /C [ ] /FT/Btn /F 768 /Ff 65536 /H/N /BS ¡¡ /W 0 ¿¿ \HyColor@XZeroOneThreeFour\pc@goptd@color\pc@hyenc@colorpdfcommentcolor\HyColor@XZeroOneThreeFour\pc@goptd@fontcolor\pc@hyenc@fontcolorpdfcommentcolor\HyColor@XZeroOneThreeFour\pc@goptd@icolor\pc@hyenc@icolorpdfcommentcolor\pdfmark[SED]pdfmark=/ANN,Subtype=/Widget,Raw=/TU (Spectral energy distribution\textCR(\pc@goptd@deadline)) /T (tooltip zref@465) /C [ ] /FT/Btn /F 768 /Ff 65536 /H/N /BS ¡¡ /W 0 ¿¿ could be fitted with a \HyColor@XZeroOneThreeFour\pc@goptd@color\pc@hyenc@colorpdfcommentcolor\HyColor@XZeroOneThreeFour\pc@goptd@fontcolor\pc@hyenc@fontcolorpdfcommentcolor\HyColor@XZeroOneThreeFour\pc@goptd@icolor\pc@hyenc@icolorpdfcommentcolor\pdfmark[MBB]pdfmark=/ANN,Subtype=/Widget,Raw=/TU (Modified black body\textCR(\pc@goptd@deadline)) /T (tooltip zref@466) /C [ ] /FT/Btn /F 768 /Ff 65536 /H/N /BS ¡¡ /W 0 ¿¿ (\pdfmark[β]pdfmark=/ANN,Subtype=/Widget,Raw=/TU (Emissivity index (power-law index of a modified black body)\textCR(\pc@goptd@deadline)) /T (tooltip zref@467) /C [ ] /FT/Btn /F 768 /Ff 65536 /H/N /BS ¡¡ /W 0 ¿¿ =24-7 850 μm\pdfmark[SED]pdfmark=/ANN,Subtype=/Widget,Raw=/TU (Spectral energy distribution\textCR(\pc@goptd@deadline)) /T (tooltip zref@468) /C [ ] /FT/Btn /F 768 /Ff 65536 /H/N /BS ¡¡ /W 0 ¿¿ s of the Magellanic clouds (Israel et al., 2010; Bot et al., 2010). \HyColor@XZeroOneThreeFour\pc@goptd@color\pc@hyenc@colorpdfcommentcolor\HyColor@XZeroOneThreeFour\pc@goptd@fontcolor\pc@hyenc@fontcolorpdfcommentcolor\HyColor@XZeroOneThreeFour\pc@goptd@icolor\pc@hyenc@icolorpdfcommentcolor\pdfmark[Herschel]pdfmark=/ANN,Subtype=/Widget,Raw=/TU (Herschel space observatory (55-672 microns; 2009-2013)\textCR(\pc@goptd@deadline)) /T (tooltip zref@469) /C [ ] /FT/Btn /F 768 /Ff 65536 /H/N /BS ¡¡ /W 0 ¿¿ and \HyColor@XZeroOneThreeFour\pc@goptd@color\pc@hyenc@colorpdfcommentcolor\HyColor@XZeroOneThreeFour\pc@goptd@fontcolor\pc@hyenc@fontcolorpdfcommentcolor\HyColor@XZeroOneThreeFour\pc@goptd@icolor\pc@hyenc@icolorpdfcommentcolor\pdfmark[Planck]pdfmark=/ANN,Subtype=/Widget,Raw=/TU (Planck space observatory (300 microns-1 cm; 2009-2013)\textCR(\pc@goptd@deadline)) /T (tooltip zref@470) /C [ ] /FT/Btn /F 768 /Ff 65536 /H/N /BS ¡¡ /W 0 ¿¿ opened the way to more detailed tests. In particular, Paradis et al. (2012) showed that the 500 excess becomes significant in the peripheral regions of the \HyColor@XZeroOneThreeFour\pc@goptd@color\pc@hyenc@colorpdfcommentcolor\HyColor@XZeroOneThreeFour\pc@goptd@fontcolor\pc@hyenc@fontcolorpdfcommentcolor\HyColor@XZeroOneThreeFour\pc@goptd@icolor\pc@hyenc@icolorpdfcommentcolor\pdfmark[MW]pdfmark=/ANN,Subtype=/Widget,Raw=/TU (Milky Way\textCR(\pc@goptd@deadline)) /T (tooltip zref@471) /C [ ] /FT/Btn /F 768 /Ff 65536 /H/N /BS ¡¡ /W 0 ¿¿ (), as well as towards some H ii regions. Its relative amplitude can be up to . Spatially resolved observations of the \HyColor@XZeroOneThreeFour\pc@goptd@color\pc@hyenc@colorpdfcommentcolor\HyColor@XZeroOneThreeFour\pc@goptd@fontcolor\pc@hyenc@fontcolorpdfcommentcolor\HyColor@XZeroOneThreeFour\pc@goptd@icolor\pc@hyenc@icolorpdfcommentcolor\pdfmark[LMC]pdfmark=/ANN,Subtype=/Widget,Raw=/TU (Large Magellanic cloud\textCR(\pc@goptd@deadline)) /T (tooltip zref@472) /C [ ] /FT/Btn /F 768 /Ff 65536 /H/N /BS ¡¡ /W 0 ¿¿ have shown that the excess varies up to in certain regions and is anticorrelated with the dust surface density (Galliano et al., 2011). When resolved in non-barred spirals, the \HyColor@XZeroOneThreeFour\pc@goptd@color\pc@hyenc@colorpdfcommentcolor\HyColor@XZeroOneThreeFour\pc@goptd@fontcolor\pc@hyenc@fontcolorpdfcommentcolor\HyColor@XZeroOneThreeFour\pc@goptd@icolor\pc@hyenc@icolorpdfcommentcolor\pdfmark[submm]pdfmark=/ANN,Subtype=/Widget,Raw=/TU (Submillimeter\textCR(\pc@goptd@deadline)) /T (tooltip zref@473) /C [ ] /FT/Btn /F 768 /Ff 65536 /H/N /BS ¡¡ /W 0 ¿¿ excess is primarily detected in the disk outskirts, thus at low-surface density (e.g. Hunt et al., 2015). ††margin: \entry COBECOsmic Background Explorer (; ).
7.1.5.1 Reality of the phenomenon
First, we emphasize that, by definition, this excess is model-dependent. Different dust opacities lead to different amplitudes of the excess. For that reason, probing this excess with models which are not based on realistic optical properties is a non-sense. Second, the shape of the \HyColor@XZeroOneThreeFour\pc@goptd@color\pc@hyenc@colorpdfcommentcolor\HyColor@XZeroOneThreeFour\pc@goptd@fontcolor\pc@hyenc@fontcolorpdfcommentcolor\HyColor@XZeroOneThreeFour\pc@goptd@icolor\pc@hyenc@icolorpdfcommentcolor\pdfmark[SED]pdfmark=/ANN,Subtype=/Widget,Raw=/TU (Spectral energy distribution\textCR(\pc@goptd@deadline)) /T (tooltip zref@474) /C [ ] /FT/Btn /F 768 /Ff 65536 /H/N /BS ¡¡ /W 0 ¿¿ is well characterized in this regime. It has been observed at different wavelengths, with different instruments. It is still present with the latest \HyColor@XZeroOneThreeFour\pc@goptd@color\pc@hyenc@colorpdfcommentcolor\HyColor@XZeroOneThreeFour\pc@goptd@fontcolor\pc@hyenc@fontcolorpdfcommentcolor\HyColor@XZeroOneThreeFour\pc@goptd@icolor\pc@hyenc@icolorpdfcommentcolor\pdfmark[Herschel]pdfmark=/ANN,Subtype=/Widget,Raw=/TU (Herschel space observatory (55-672 microns; 2009-2013)\textCR(\pc@goptd@deadline)) /T (tooltip zref@475) /C [ ] /FT/Btn /F 768 /Ff 65536 /H/N /BS ¡¡ /W 0 ¿¿ calibration (Dale et al., 2017). In addition, reports of a deficit are very rare. Finally, Planck Collaboration et al. (2011a) showed that, while the \HyColor@XZeroOneThreeFour\pc@goptd@color\pc@hyenc@colorpdfcommentcolor\HyColor@XZeroOneThreeFour\pc@goptd@fontcolor\pc@hyenc@fontcolorpdfcommentcolor\HyColor@XZeroOneThreeFour\pc@goptd@icolor\pc@hyenc@icolorpdfcommentcolor\pdfmark[submm]pdfmark=/ANN,Subtype=/Widget,Raw=/TU (Submillimeter\textCR(\pc@goptd@deadline)) /T (tooltip zref@476) /C [ ] /FT/Btn /F 768 /Ff 65536 /H/N /BS ¡¡ /W 0 ¿¿ excess in the integrated \HyColor@XZeroOneThreeFour\pc@goptd@color\pc@hyenc@colorpdfcommentcolor\HyColor@XZeroOneThreeFour\pc@goptd@fontcolor\pc@hyenc@fontcolorpdfcommentcolor\HyColor@XZeroOneThreeFour\pc@goptd@icolor\pc@hyenc@icolorpdfcommentcolor\pdfmark[SED]pdfmark=/ANN,Subtype=/Widget,Raw=/TU (Spectral energy distribution\textCR(\pc@goptd@deadline)) /T (tooltip zref@477) /C [ ] /FT/Btn /F 768 /Ff 65536 /H/N /BS ¡¡ /W 0 ¿¿ of the \HyColor@XZeroOneThreeFour\pc@goptd@color\pc@hyenc@colorpdfcommentcolor\HyColor@XZeroOneThreeFour\pc@goptd@fontcolor\pc@hyenc@fontcolorpdfcommentcolor\HyColor@XZeroOneThreeFour\pc@goptd@icolor\pc@hyenc@icolorpdfcommentcolor\pdfmark[LMC]pdfmark=/ANN,Subtype=/Widget,Raw=/TU (Large Magellanic cloud\textCR(\pc@goptd@deadline)) /T (tooltip zref@478) /C [ ] /FT/Btn /F 768 /Ff 65536 /H/N /BS ¡¡ /W 0 ¿¿ was consistent with Cosmic Microwave Background (CMB) fluctuations, the \HyColor@XZeroOneThreeFour\pc@goptd@color\pc@hyenc@colorpdfcommentcolor\HyColor@XZeroOneThreeFour\pc@goptd@fontcolor\pc@hyenc@fontcolorpdfcommentcolor\HyColor@XZeroOneThreeFour\pc@goptd@icolor\pc@hyenc@icolorpdfcommentcolor\pdfmark[SMC]pdfmark=/ANN,Subtype=/Widget,Raw=/TU (Small Magellanic cloud\textCR(\pc@goptd@deadline)) /T (tooltip zref@479) /C [ ] /FT/Btn /F 768 /Ff 65536 /H/N /BS ¡¡ /W 0 ¿¿ excess was significantly above this level.
7.1.5.2 Possible explanations
The origin of the excess is currently debated. The following explanations have been proposed.
- Very cold dust
-
(VCD) can be used to fit the excess. However, it leads to massive amounts of grains. Galliano et al. (2003) showed that VCD would be realistic only if this component was distributed in a few number of dense, parsec-size clumps. Using the spatially resolved observations of the excess in the \HyColor@XZeroOneThreeFour\pc@goptd@color\pc@hyenc@colorpdfcommentcolor\HyColor@XZeroOneThreeFour\pc@goptd@fontcolor\pc@hyenc@fontcolorpdfcommentcolor\HyColor@XZeroOneThreeFour\pc@goptd@icolor\pc@hyenc@icolorpdfcommentcolor\pdfmark[LMC]pdfmark=/ANN,Subtype=/Widget,Raw=/TU (Large Magellanic cloud\textCR(\pc@goptd@deadline)) /T (tooltip zref@480) /C [ ] /FT/Btn /F 768 /Ff 65536 /H/N /BS ¡¡ /W 0 ¿¿ , Galliano et al. (2011) concluded that this explanation is unrealistic.
- Temperature dependent emissivity.
-
The Meny et al. (2007) model predicts an increase of and a decrease of \HyColor@XZeroOneThreeFour\pc@goptd@color\pc@hyenc@colorpdfcommentcolor\HyColor@XZeroOneThreeFour\pc@goptd@fontcolor\pc@hyenc@fontcolorpdfcommentcolor\HyColor@XZeroOneThreeFour\pc@goptd@icolor\pc@hyenc@icolorpdfcommentcolor\pdfmark[]pdfmark=/ANN,Subtype=/Widget,Raw=/TU (Emissivity index (power-law index of a modified black body)\textCR(\pc@goptd@deadline)) /T (tooltip zref@481) /C [ ] /FT/Btn /F 768 /Ff 65536 /H/N /BS ¡¡ /W 0 ¿¿ with the temperature of amorphous grains. It reproduces the \HyColor@XZeroOneThreeFour\pc@goptd@color\pc@hyenc@colorpdfcommentcolor\HyColor@XZeroOneThreeFour\pc@goptd@fontcolor\pc@hyenc@fontcolorpdfcommentcolor\HyColor@XZeroOneThreeFour\pc@goptd@icolor\pc@hyenc@icolorpdfcommentcolor\pdfmark[MW]pdfmark=/ANN,Subtype=/Widget,Raw=/TU (Milky Way\textCR(\pc@goptd@deadline)) /T (tooltip zref@482) /C [ ] /FT/Btn /F 768 /Ff 65536 /H/N /BS ¡¡ /W 0 ¿¿ excess (Paradis et al., 2012) and the \HyColor@XZeroOneThreeFour\pc@goptd@color\pc@hyenc@colorpdfcommentcolor\HyColor@XZeroOneThreeFour\pc@goptd@fontcolor\pc@hyenc@fontcolorpdfcommentcolor\HyColor@XZeroOneThreeFour\pc@goptd@icolor\pc@hyenc@icolorpdfcommentcolor\pdfmark[LMC]pdfmark=/ANN,Subtype=/Widget,Raw=/TU (Large Magellanic cloud\textCR(\pc@goptd@deadline)) /T (tooltip zref@483) /C [ ] /FT/Btn /F 768 /Ff 65536 /H/N /BS ¡¡ /W 0 ¿¿ (Bot et al., 2010, coupled with spinning grains; cf. Section 7.1.6). However, it can not account for the excess in the \HyColor@XZeroOneThreeFour\pc@goptd@color\pc@hyenc@colorpdfcommentcolor\HyColor@XZeroOneThreeFour\pc@goptd@fontcolor\pc@hyenc@fontcolorpdfcommentcolor\HyColor@XZeroOneThreeFour\pc@goptd@icolor\pc@hyenc@icolorpdfcommentcolor\pdfmark[SMC]pdfmark=/ANN,Subtype=/Widget,Raw=/TU (Small Magellanic cloud\textCR(\pc@goptd@deadline)) /T (tooltip zref@484) /C [ ] /FT/Btn /F 768 /Ff 65536 /H/N /BS ¡¡ /W 0 ¿¿ (Bot et al., 2010).
- Magnetic grains.
-
Draine & Hensley (2012) showed that the \HyColor@XZeroOneThreeFour\pc@goptd@color\pc@hyenc@colorpdfcommentcolor\HyColor@XZeroOneThreeFour\pc@goptd@fontcolor\pc@hyenc@fontcolorpdfcommentcolor\HyColor@XZeroOneThreeFour\pc@goptd@icolor\pc@hyenc@icolorpdfcommentcolor\pdfmark[SMC]pdfmark=/ANN,Subtype=/Widget,Raw=/TU (Small Magellanic cloud\textCR(\pc@goptd@deadline)) /T (tooltip zref@485) /C [ ] /FT/Btn /F 768 /Ff 65536 /H/N /BS ¡¡ /W 0 ¿¿ excess could be attributed to magnetic nanoparticles (Fe, Fe3O4, -Fe2O3). Thermal fluctuations in the magnetization of these grains can produce strong magnetic dipole emission, since ferromagnetic materials are known to have large opacities at microwave frequencies. This hypothesis seems to be consistent with the observed elemental abundances of the \HyColor@XZeroOneThreeFour\pc@goptd@color\pc@hyenc@colorpdfcommentcolor\HyColor@XZeroOneThreeFour\pc@goptd@fontcolor\pc@hyenc@fontcolorpdfcommentcolor\HyColor@XZeroOneThreeFour\pc@goptd@icolor\pc@hyenc@icolorpdfcommentcolor\pdfmark[SMC]pdfmark=/ANN,Subtype=/Widget,Raw=/TU (Small Magellanic cloud\textCR(\pc@goptd@deadline)) /T (tooltip zref@486) /C [ ] /FT/Btn /F 768 /Ff 65536 /H/N /BS ¡¡ /W 0 ¿¿ and could also be responsible for the excess detected in other environments.
7.1.6 Spinning Grains
The \HyColor@XZeroOneThreeFour\pc@goptd@color\pc@hyenc@colorpdfcommentcolor\HyColor@XZeroOneThreeFour\pc@goptd@fontcolor\pc@hyenc@fontcolorpdfcommentcolor\HyColor@XZeroOneThreeFour\pc@goptd@icolor\pc@hyenc@icolorpdfcommentcolor\pdfmark[AME]pdfmark=/ANN,Subtype=/Widget,Raw=/TU (Anomalous microwave emission\textCR(\pc@goptd@deadline)) /T (tooltip zref@487) /C [ ] /FT/Btn /F 768 /Ff 65536 /H/N /BS ¡¡ /W 0 ¿¿ is a cm continuum excess that can not be accounted for by the extrapolation of dust models, free-free, synchrotron and molecular line emission (Figure 1). It was first detected in the \HyColor@XZeroOneThreeFour\pc@goptd@color\pc@hyenc@colorpdfcommentcolor\HyColor@XZeroOneThreeFour\pc@goptd@fontcolor\pc@hyenc@fontcolorpdfcommentcolor\HyColor@XZeroOneThreeFour\pc@goptd@icolor\pc@hyenc@icolorpdfcommentcolor\pdfmark[MW]pdfmark=/ANN,Subtype=/Widget,Raw=/TU (Milky Way\textCR(\pc@goptd@deadline)) /T (tooltip zref@488) /C [ ] /FT/Btn /F 768 /Ff 65536 /H/N /BS ¡¡ /W 0 ¿¿ (Kogut et al., 1996). Draine & Lazarian (1998) promptly proposed that it was arising from the dipole emission of fastly rotating ultrasmall grains. The candidate carriers were thought to be \HyColor@XZeroOneThreeFour\pc@goptd@color\pc@hyenc@colorpdfcommentcolor\HyColor@XZeroOneThreeFour\pc@goptd@fontcolor\pc@hyenc@fontcolorpdfcommentcolor\HyColor@XZeroOneThreeFour\pc@goptd@icolor\pc@hyenc@icolorpdfcommentcolor\pdfmark[PAH]pdfmark=/ANN,Subtype=/Widget,Raw=/TU (Polycyclic aromatic hydrocarbon\textCR(\pc@goptd@deadline)) /T (tooltip zref@489) /C [ ] /FT/Btn /F 768 /Ff 65536 /H/N /BS ¡¡ /W 0 ¿¿ s. The \HyColor@XZeroOneThreeFour\pc@goptd@color\pc@hyenc@colorpdfcommentcolor\HyColor@XZeroOneThreeFour\pc@goptd@fontcolor\pc@hyenc@fontcolorpdfcommentcolor\HyColor@XZeroOneThreeFour\pc@goptd@icolor\pc@hyenc@icolorpdfcommentcolor\pdfmark[WMAP]pdfmark=/ANN,Subtype=/Widget,Raw=/TU (Wilkinson Microwave Anisotropy Probe (3.2-13 mm; 2001-2010)\textCR(\pc@goptd@deadline)) /T (tooltip zref@490) /C [ ] /FT/Btn /F 768 /Ff 65536 /H/N /BS ¡¡ /W 0 ¿¿ and \HyColor@XZeroOneThreeFour\pc@goptd@color\pc@hyenc@colorpdfcommentcolor\HyColor@XZeroOneThreeFour\pc@goptd@fontcolor\pc@hyenc@fontcolorpdfcommentcolor\HyColor@XZeroOneThreeFour\pc@goptd@icolor\pc@hyenc@icolorpdfcommentcolor\pdfmark[Planck]pdfmark=/ANN,Subtype=/Widget,Raw=/TU (Planck space observatory (300 microns-1 cm; 2009-2013)\textCR(\pc@goptd@deadline)) /T (tooltip zref@491) /C [ ] /FT/Btn /F 768 /Ff 65536 /H/N /BS ¡¡ /W 0 ¿¿ data of the Galaxy were successfully fit with spinning dust models, including \HyColor@XZeroOneThreeFour\pc@goptd@color\pc@hyenc@colorpdfcommentcolor\HyColor@XZeroOneThreeFour\pc@goptd@fontcolor\pc@hyenc@fontcolorpdfcommentcolor\HyColor@XZeroOneThreeFour\pc@goptd@icolor\pc@hyenc@icolorpdfcommentcolor\pdfmark[PAH]pdfmark=/ANN,Subtype=/Widget,Raw=/TU (Polycyclic aromatic hydrocarbon\textCR(\pc@goptd@deadline)) /T (tooltip zref@492) /C [ ] /FT/Btn /F 768 /Ff 65536 /H/N /BS ¡¡ /W 0 ¿¿ s (e.g. Planck Collaboration et al., 2011b). In the \HyColor@XZeroOneThreeFour\pc@goptd@color\pc@hyenc@colorpdfcommentcolor\HyColor@XZeroOneThreeFour\pc@goptd@fontcolor\pc@hyenc@fontcolorpdfcommentcolor\HyColor@XZeroOneThreeFour\pc@goptd@icolor\pc@hyenc@icolorpdfcommentcolor\pdfmark[MW]pdfmark=/ANN,Subtype=/Widget,Raw=/TU (Milky Way\textCR(\pc@goptd@deadline)) /T (tooltip zref@493) /C [ ] /FT/Btn /F 768 /Ff 65536 /H/N /BS ¡¡ /W 0 ¿¿ , the \HyColor@XZeroOneThreeFour\pc@goptd@color\pc@hyenc@colorpdfcommentcolor\HyColor@XZeroOneThreeFour\pc@goptd@fontcolor\pc@hyenc@fontcolorpdfcommentcolor\HyColor@XZeroOneThreeFour\pc@goptd@icolor\pc@hyenc@icolorpdfcommentcolor\pdfmark[AME]pdfmark=/ANN,Subtype=/Widget,Raw=/TU (Anomalous microwave emission\textCR(\pc@goptd@deadline)) /T (tooltip zref@494) /C [ ] /FT/Btn /F 768 /Ff 65536 /H/N /BS ¡¡ /W 0 ¿¿ correlates with all tracers of dust emission (Hensley, Draine & Meisner, 2016). However, Hensley, Draine & Meisner (2016) showed that \HyColor@XZeroOneThreeFour\pc@goptd@color\pc@hyenc@colorpdfcommentcolor\HyColor@XZeroOneThreeFour\pc@goptd@fontcolor\pc@hyenc@fontcolorpdfcommentcolor\HyColor@XZeroOneThreeFour\pc@goptd@icolor\pc@hyenc@icolorpdfcommentcolor\pdfmark[AME]pdfmark=/ANN,Subtype=/Widget,Raw=/TU (Anomalous microwave emission\textCR(\pc@goptd@deadline)) /T (tooltip zref@495) /C [ ] /FT/Btn /F 768 /Ff 65536 /H/N /BS ¡¡ /W 0 ¿¿ /\HyColor@XZeroOneThreeFour\pc@goptd@color\pc@hyenc@colorpdfcommentcolor\HyColor@XZeroOneThreeFour\pc@goptd@fontcolor\pc@hyenc@fontcolorpdfcommentcolor\HyColor@XZeroOneThreeFour\pc@goptd@icolor\pc@hyenc@icolorpdfcommentcolor\pdfmark[TIR]pdfmark=/ANN,Subtype=/Widget,Raw=/TU (Total infrared\textCR(\pc@goptd@deadline)) /T (tooltip zref@496) /C [ ] /FT/Btn /F 768 /Ff 65536 /H/N /BS ¡¡ /W 0 ¿¿ ratio does not correlate with the \HyColor@XZeroOneThreeFour\pc@goptd@color\pc@hyenc@colorpdfcommentcolor\HyColor@XZeroOneThreeFour\pc@goptd@fontcolor\pc@hyenc@fontcolorpdfcommentcolor\HyColor@XZeroOneThreeFour\pc@goptd@icolor\pc@hyenc@icolorpdfcommentcolor\pdfmark[PAH]pdfmark=/ANN,Subtype=/Widget,Raw=/TU (Polycyclic aromatic hydrocarbon\textCR(\pc@goptd@deadline)) /T (tooltip zref@497) /C [ ] /FT/Btn /F 768 /Ff 65536 /H/N /BS ¡¡ /W 0 ¿¿ abundance. These authors thus proposed that the carriers of the \HyColor@XZeroOneThreeFour\pc@goptd@color\pc@hyenc@colorpdfcommentcolor\HyColor@XZeroOneThreeFour\pc@goptd@fontcolor\pc@hyenc@fontcolorpdfcommentcolor\HyColor@XZeroOneThreeFour\pc@goptd@icolor\pc@hyenc@icolorpdfcommentcolor\pdfmark[AME]pdfmark=/ANN,Subtype=/Widget,Raw=/TU (Anomalous microwave emission\textCR(\pc@goptd@deadline)) /T (tooltip zref@498) /C [ ] /FT/Btn /F 768 /Ff 65536 /H/N /BS ¡¡ /W 0 ¿¿ could be nano-silicates, rather than \HyColor@XZeroOneThreeFour\pc@goptd@color\pc@hyenc@colorpdfcommentcolor\HyColor@XZeroOneThreeFour\pc@goptd@fontcolor\pc@hyenc@fontcolorpdfcommentcolor\HyColor@XZeroOneThreeFour\pc@goptd@icolor\pc@hyenc@icolorpdfcommentcolor\pdfmark[PAH]pdfmark=/ANN,Subtype=/Widget,Raw=/TU (Polycyclic aromatic hydrocarbon\textCR(\pc@goptd@deadline)) /T (tooltip zref@499) /C [ ] /FT/Btn /F 768 /Ff 65536 /H/N /BS ¡¡ /W 0 ¿¿ s. ††margin: \entry WMAPWilkinson Microwave Anisotropy Probe ( mm; ).
In nearby galaxies, the first unambiguous detection of an \HyColor@XZeroOneThreeFour\pc@goptd@color\pc@hyenc@colorpdfcommentcolor\HyColor@XZeroOneThreeFour\pc@goptd@fontcolor\pc@hyenc@fontcolorpdfcommentcolor\HyColor@XZeroOneThreeFour\pc@goptd@icolor\pc@hyenc@icolorpdfcommentcolor\pdfmark[AME]pdfmark=/ANN,Subtype=/Widget,Raw=/TU (Anomalous microwave emission\textCR(\pc@goptd@deadline)) /T (tooltip zref@500) /C [ ] /FT/Btn /F 768 /Ff 65536 /H/N /BS ¡¡ /W 0 ¿¿ has been obtained in an outer region of NGC 6946 (Murphy et al., 2010; Scaife et al., 2010). Follow up observations showed evidence for \HyColor@XZeroOneThreeFour\pc@goptd@color\pc@hyenc@colorpdfcommentcolor\HyColor@XZeroOneThreeFour\pc@goptd@fontcolor\pc@hyenc@fontcolorpdfcommentcolor\HyColor@XZeroOneThreeFour\pc@goptd@icolor\pc@hyenc@icolorpdfcommentcolor\pdfmark[AME]pdfmark=/ANN,Subtype=/Widget,Raw=/TU (Anomalous microwave emission\textCR(\pc@goptd@deadline)) /T (tooltip zref@501) /C [ ] /FT/Btn /F 768 /Ff 65536 /H/N /BS ¡¡ /W 0 ¿¿ in 8 regions of this galaxy (Hensley, Murphy & Staguhn, 2015). This study showed that the spectral shape of this \HyColor@XZeroOneThreeFour\pc@goptd@color\pc@hyenc@colorpdfcommentcolor\HyColor@XZeroOneThreeFour\pc@goptd@fontcolor\pc@hyenc@fontcolorpdfcommentcolor\HyColor@XZeroOneThreeFour\pc@goptd@icolor\pc@hyenc@icolorpdfcommentcolor\pdfmark[AME]pdfmark=/ANN,Subtype=/Widget,Raw=/TU (Anomalous microwave emission\textCR(\pc@goptd@deadline)) /T (tooltip zref@502) /C [ ] /FT/Btn /F 768 /Ff 65536 /H/N /BS ¡¡ /W 0 ¿¿ is consistent with spinning dust, but with a stronger \HyColor@XZeroOneThreeFour\pc@goptd@color\pc@hyenc@colorpdfcommentcolor\HyColor@XZeroOneThreeFour\pc@goptd@fontcolor\pc@hyenc@fontcolorpdfcommentcolor\HyColor@XZeroOneThreeFour\pc@goptd@icolor\pc@hyenc@icolorpdfcommentcolor\pdfmark[AME]pdfmark=/ANN,Subtype=/Widget,Raw=/TU (Anomalous microwave emission\textCR(\pc@goptd@deadline)) /T (tooltip zref@503) /C [ ] /FT/Btn /F 768 /Ff 65536 /H/N /BS ¡¡ /W 0 ¿¿ -to-\HyColor@XZeroOneThreeFour\pc@goptd@color\pc@hyenc@colorpdfcommentcolor\HyColor@XZeroOneThreeFour\pc@goptd@fontcolor\pc@hyenc@fontcolorpdfcommentcolor\HyColor@XZeroOneThreeFour\pc@goptd@icolor\pc@hyenc@icolorpdfcommentcolor\pdfmark[PAH]pdfmark=/ANN,Subtype=/Widget,Raw=/TU (Polycyclic aromatic hydrocarbon\textCR(\pc@goptd@deadline)) /T (tooltip zref@504) /C [ ] /FT/Btn /F 768 /Ff 65536 /H/N /BS ¡¡ /W 0 ¿¿ -surface-density ratio, hinting that other grains could be the carriers. Overall, the \HyColor@XZeroOneThreeFour\pc@goptd@color\pc@hyenc@colorpdfcommentcolor\HyColor@XZeroOneThreeFour\pc@goptd@fontcolor\pc@hyenc@fontcolorpdfcommentcolor\HyColor@XZeroOneThreeFour\pc@goptd@icolor\pc@hyenc@icolorpdfcommentcolor\pdfmark[AME]pdfmark=/ANN,Subtype=/Widget,Raw=/TU (Anomalous microwave emission\textCR(\pc@goptd@deadline)) /T (tooltip zref@505) /C [ ] /FT/Btn /F 768 /Ff 65536 /H/N /BS ¡¡ /W 0 ¿¿ fraction is highly variable, in nearby galaxies. Peel et al. (2011) put upper limits on the \HyColor@XZeroOneThreeFour\pc@goptd@color\pc@hyenc@colorpdfcommentcolor\HyColor@XZeroOneThreeFour\pc@goptd@fontcolor\pc@hyenc@fontcolorpdfcommentcolor\HyColor@XZeroOneThreeFour\pc@goptd@icolor\pc@hyenc@icolorpdfcommentcolor\pdfmark[AME]pdfmark=/ANN,Subtype=/Widget,Raw=/TU (Anomalous microwave emission\textCR(\pc@goptd@deadline)) /T (tooltip zref@506) /C [ ] /FT/Btn /F 768 /Ff 65536 /H/N /BS ¡¡ /W 0 ¿¿ in M 82, NGC 253 and NGC 4945. These upper limits suggest that \HyColor@XZeroOneThreeFour\pc@goptd@color\pc@hyenc@colorpdfcommentcolor\HyColor@XZeroOneThreeFour\pc@goptd@fontcolor\pc@hyenc@fontcolorpdfcommentcolor\HyColor@XZeroOneThreeFour\pc@goptd@icolor\pc@hyenc@icolorpdfcommentcolor\pdfmark[AME]pdfmark=/ANN,Subtype=/Widget,Raw=/TU (Anomalous microwave emission\textCR(\pc@goptd@deadline)) /T (tooltip zref@507) /C [ ] /FT/Btn /F 768 /Ff 65536 /H/N /BS ¡¡ /W 0 ¿¿ /100 is lower than in the \HyColor@XZeroOneThreeFour\pc@goptd@color\pc@hyenc@colorpdfcommentcolor\HyColor@XZeroOneThreeFour\pc@goptd@fontcolor\pc@hyenc@fontcolorpdfcommentcolor\HyColor@XZeroOneThreeFour\pc@goptd@icolor\pc@hyenc@icolorpdfcommentcolor\pdfmark[MW]pdfmark=/ANN,Subtype=/Widget,Raw=/TU (Milky Way\textCR(\pc@goptd@deadline)) /T (tooltip zref@508) /C [ ] /FT/Btn /F 768 /Ff 65536 /H/N /BS ¡¡ /W 0 ¿¿ , in these objects. In M 31, Planck Collaboration et al. (2015b) report a measurement of the \HyColor@XZeroOneThreeFour\pc@goptd@color\pc@hyenc@colorpdfcommentcolor\HyColor@XZeroOneThreeFour\pc@goptd@fontcolor\pc@hyenc@fontcolorpdfcommentcolor\HyColor@XZeroOneThreeFour\pc@goptd@icolor\pc@hyenc@icolorpdfcommentcolor\pdfmark[AME]pdfmark=/ANN,Subtype=/Widget,Raw=/TU (Anomalous microwave emission\textCR(\pc@goptd@deadline)) /T (tooltip zref@509) /C [ ] /FT/Btn /F 768 /Ff 65536 /H/N /BS ¡¡ /W 0 ¿¿ , consistent with the Galactic properties. Finally, Bot et al. (2010), fitting the \HyColor@XZeroOneThreeFour\pc@goptd@color\pc@hyenc@colorpdfcommentcolor\HyColor@XZeroOneThreeFour\pc@goptd@fontcolor\pc@hyenc@fontcolorpdfcommentcolor\HyColor@XZeroOneThreeFour\pc@goptd@icolor\pc@hyenc@icolorpdfcommentcolor\pdfmark[NIR]pdfmark=/ANN,Subtype=/Widget,Raw=/TU (Near-infrared\textCR(\pc@goptd@deadline)) /T (tooltip zref@510) /C [ ] /FT/Btn /F 768 /Ff 65536 /H/N /BS ¡¡ /W 0 ¿¿ -to-radio \HyColor@XZeroOneThreeFour\pc@goptd@color\pc@hyenc@colorpdfcommentcolor\HyColor@XZeroOneThreeFour\pc@goptd@fontcolor\pc@hyenc@fontcolorpdfcommentcolor\HyColor@XZeroOneThreeFour\pc@goptd@icolor\pc@hyenc@icolorpdfcommentcolor\pdfmark[SED]pdfmark=/ANN,Subtype=/Widget,Raw=/TU (Spectral energy distribution\textCR(\pc@goptd@deadline)) /T (tooltip zref@511) /C [ ] /FT/Btn /F 768 /Ff 65536 /H/N /BS ¡¡ /W 0 ¿¿ of the \HyColor@XZeroOneThreeFour\pc@goptd@color\pc@hyenc@colorpdfcommentcolor\HyColor@XZeroOneThreeFour\pc@goptd@fontcolor\pc@hyenc@fontcolorpdfcommentcolor\HyColor@XZeroOneThreeFour\pc@goptd@icolor\pc@hyenc@icolorpdfcommentcolor\pdfmark[LMC]pdfmark=/ANN,Subtype=/Widget,Raw=/TU (Large Magellanic cloud\textCR(\pc@goptd@deadline)) /T (tooltip zref@512) /C [ ] /FT/Btn /F 768 /Ff 65536 /H/N /BS ¡¡ /W 0 ¿¿ and \HyColor@XZeroOneThreeFour\pc@goptd@color\pc@hyenc@colorpdfcommentcolor\HyColor@XZeroOneThreeFour\pc@goptd@fontcolor\pc@hyenc@fontcolorpdfcommentcolor\HyColor@XZeroOneThreeFour\pc@goptd@icolor\pc@hyenc@icolorpdfcommentcolor\pdfmark[SMC]pdfmark=/ANN,Subtype=/Widget,Raw=/TU (Small Magellanic cloud\textCR(\pc@goptd@deadline)) /T (tooltip zref@513) /C [ ] /FT/Btn /F 768 /Ff 65536 /H/N /BS ¡¡ /W 0 ¿¿ , temptatively explained the \HyColor@XZeroOneThreeFour\pc@goptd@color\pc@hyenc@colorpdfcommentcolor\HyColor@XZeroOneThreeFour\pc@goptd@fontcolor\pc@hyenc@fontcolorpdfcommentcolor\HyColor@XZeroOneThreeFour\pc@goptd@icolor\pc@hyenc@icolorpdfcommentcolor\pdfmark[submm]pdfmark=/ANN,Subtype=/Widget,Raw=/TU (Submillimeter\textCR(\pc@goptd@deadline)) /T (tooltip zref@514) /C [ ] /FT/Btn /F 768 /Ff 65536 /H/N /BS ¡¡ /W 0 ¿¿ /mm excess with the help of spinning dust, in combination with a modified \HyColor@XZeroOneThreeFour\pc@goptd@color\pc@hyenc@colorpdfcommentcolor\HyColor@XZeroOneThreeFour\pc@goptd@fontcolor\pc@hyenc@fontcolorpdfcommentcolor\HyColor@XZeroOneThreeFour\pc@goptd@icolor\pc@hyenc@icolorpdfcommentcolor\pdfmark[submm]pdfmark=/ANN,Subtype=/Widget,Raw=/TU (Submillimeter\textCR(\pc@goptd@deadline)) /T (tooltip zref@515) /C [ ] /FT/Btn /F 768 /Ff 65536 /H/N /BS ¡¡ /W 0 ¿¿ dust emissivity (cf. Section 7.1.5). They conclude that if spinning grains are responsible for this excess, their emission must peak at 139 GHz (\HyColor@XZeroOneThreeFour\pc@goptd@color\pc@hyenc@colorpdfcommentcolor\HyColor@XZeroOneThreeFour\pc@goptd@fontcolor\pc@hyenc@fontcolorpdfcommentcolor\HyColor@XZeroOneThreeFour\pc@goptd@icolor\pc@hyenc@icolorpdfcommentcolor\pdfmark[LMC]pdfmark=/ANN,Subtype=/Widget,Raw=/TU (Large Magellanic cloud\textCR(\pc@goptd@deadline)) /T (tooltip zref@516) /C [ ] /FT/Btn /F 768 /Ff 65536 /H/N /BS ¡¡ /W 0 ¿¿ ) and 160 GHz (\HyColor@XZeroOneThreeFour\pc@goptd@color\pc@hyenc@colorpdfcommentcolor\HyColor@XZeroOneThreeFour\pc@goptd@fontcolor\pc@hyenc@fontcolorpdfcommentcolor\HyColor@XZeroOneThreeFour\pc@goptd@icolor\pc@hyenc@icolorpdfcommentcolor\pdfmark[SMC]pdfmark=/ANN,Subtype=/Widget,Raw=/TU (Small Magellanic cloud\textCR(\pc@goptd@deadline)) /T (tooltip zref@517) /C [ ] /FT/Btn /F 768 /Ff 65536 /H/N /BS ¡¡ /W 0 ¿¿ ), implying large \HyColor@XZeroOneThreeFour\pc@goptd@color\pc@hyenc@colorpdfcommentcolor\HyColor@XZeroOneThreeFour\pc@goptd@fontcolor\pc@hyenc@fontcolorpdfcommentcolor\HyColor@XZeroOneThreeFour\pc@goptd@icolor\pc@hyenc@icolorpdfcommentcolor\pdfmark[ISRF]pdfmark=/ANN,Subtype=/Widget,Raw=/TU (Interstellar radiation field\textCR(\pc@goptd@deadline)) /T (tooltip zref@518) /C [ ] /FT/Btn /F 768 /Ff 65536 /H/N /BS ¡¡ /W 0 ¿¿ intensities and densities. Draine & Hensley (2012) argued that such fastly rotating grains would need a \HyColor@XZeroOneThreeFour\pc@goptd@color\pc@hyenc@colorpdfcommentcolor\HyColor@XZeroOneThreeFour\pc@goptd@fontcolor\pc@hyenc@fontcolorpdfcommentcolor\HyColor@XZeroOneThreeFour\pc@goptd@icolor\pc@hyenc@icolorpdfcommentcolor\pdfmark[PDR]pdfmark=/ANN,Subtype=/Widget,Raw=/TU (Photodissociation region\textCR(\pc@goptd@deadline)) /T (tooltip zref@519) /C [ ] /FT/Btn /F 768 /Ff 65536 /H/N /BS ¡¡ /W 0 ¿¿ phase with a total luminosity more than two orders of magnitude brighter than the \HyColor@XZeroOneThreeFour\pc@goptd@color\pc@hyenc@colorpdfcommentcolor\HyColor@XZeroOneThreeFour\pc@goptd@fontcolor\pc@hyenc@fontcolorpdfcommentcolor\HyColor@XZeroOneThreeFour\pc@goptd@icolor\pc@hyenc@icolorpdfcommentcolor\pdfmark[SMC]pdfmark=/ANN,Subtype=/Widget,Raw=/TU (Small Magellanic cloud\textCR(\pc@goptd@deadline)) /T (tooltip zref@520) /C [ ] /FT/Btn /F 768 /Ff 65536 /H/N /BS ¡¡ /W 0 ¿¿ .
8 EVIDENCE OF DUST EVOLUTION
[h]
9 DUST EVOLUTION PROCESSES
9.0.1 Grain Formation
The dust mass is built up by: (1) grain condensation in the ejecta of core-collapse \HyColor@XZeroOneThreeFour\pc@goptd@color\pc@hyenc@colorpdfcommentcolor\HyColor@XZeroOneThreeFour\pc@goptd@fontcolor\pc@hyenc@fontcolorpdfcommentcolor\HyColor@XZeroOneThreeFour\pc@goptd@icolor\pc@hyenc@icolorpdfcommentcolor\pdfmark[SN]pdfmark=/ANN,Subtype=/Widget,Raw=/TU (Supernova\textCR(\pc@goptd@deadline)) /T (tooltip zref@521) /C [ ] /FT/Btn /F 768 /Ff 65536 /H/N /BS ¡¡ /W 0 ¿¿ e and \HyColor@XZeroOneThreeFour\pc@goptd@color\pc@hyenc@colorpdfcommentcolor\HyColor@XZeroOneThreeFour\pc@goptd@fontcolor\pc@hyenc@fontcolorpdfcommentcolor\HyColor@XZeroOneThreeFour\pc@goptd@icolor\pc@hyenc@icolorpdfcommentcolor\pdfmark[AGB]pdfmark=/ANN,Subtype=/Widget,Raw=/TU (Asymptotic giant branch\textCR(\pc@goptd@deadline)) /T (tooltip zref@522) /C [ ] /FT/Btn /F 768 /Ff 65536 /H/N /BS ¡¡ /W 0 ¿¿ stars. (2) grain (re-)formation in the \HyColor@XZeroOneThreeFour\pc@goptd@color\pc@hyenc@colorpdfcommentcolor\HyColor@XZeroOneThreeFour\pc@goptd@fontcolor\pc@hyenc@fontcolorpdfcommentcolor\HyColor@XZeroOneThreeFour\pc@goptd@icolor\pc@hyenc@icolorpdfcommentcolor\pdfmark[ISM]pdfmark=/ANN,Subtype=/Widget,Raw=/TU (Interstellar medium\textCR(\pc@goptd@deadline)) /T (tooltip zref@523) /C [ ] /FT/Btn /F 768 /Ff 65536 /H/N /BS ¡¡ /W 0 ¿¿ , by accretion of atoms and molecules (grain growth, and mantle and ice formation).
9.0.2 Grain Processing
The grain constitution is altered in the \HyColor@XZeroOneThreeFour\pc@goptd@color\pc@hyenc@colorpdfcommentcolor\HyColor@XZeroOneThreeFour\pc@goptd@fontcolor\pc@hyenc@fontcolorpdfcommentcolor\HyColor@XZeroOneThreeFour\pc@goptd@icolor\pc@hyenc@icolorpdfcommentcolor\pdfmark[ISM]pdfmark=/ANN,Subtype=/Widget,Raw=/TU (Interstellar medium\textCR(\pc@goptd@deadline)) /T (tooltip zref@524) /C [ ] /FT/Btn /F 768 /Ff 65536 /H/N /BS ¡¡ /W 0 ¿¿ by: (1) shattering and fragmentation by grain-grain collisions in low-velocity shocks (modification of the size distribution); (2) structural modifications by high energy photons or cosmic ray impacts; (3) coagulation.
9.0.3 Grain Destruction
The elements constituting the grains are partially or fully removed by: (1) erosion and evaporation by thermal or kinetic sputtering (gas-grain collision in a hot gas or a shock); (2) photodesorption of atoms and molecules; (3) thermal evaporation; (4) astration (incorporation into stars).
9.1 The Empirical Effects of Star Formation Activity & Metallicity
Dust evolution is the modification of the constitution of a grain mixture under the effect of environmental processing. Most dust evolution processes can be linked to star formation: (1) formation of molecular clouds and their subsequent evaporation; (2) stellar ejecta; (3) \HyColor@XZeroOneThreeFour\pc@goptd@color\pc@hyenc@colorpdfcommentcolor\HyColor@XZeroOneThreeFour\pc@goptd@fontcolor\pc@hyenc@fontcolorpdfcommentcolor\HyColor@XZeroOneThreeFour\pc@goptd@icolor\pc@hyenc@icolorpdfcommentcolor\pdfmark[SN]pdfmark=/ANN,Subtype=/Widget,Raw=/TU (Supernova\textCR(\pc@goptd@deadline)) /T (tooltip zref@525) /C [ ] /FT/Btn /F 768 /Ff 65536 /H/N /BS ¡¡ /W 0 ¿¿ shock waves; (4) \HyColor@XZeroOneThreeFour\pc@goptd@color\pc@hyenc@colorpdfcommentcolor\HyColor@XZeroOneThreeFour\pc@goptd@fontcolor\pc@hyenc@fontcolorpdfcommentcolor\HyColor@XZeroOneThreeFour\pc@goptd@icolor\pc@hyenc@icolorpdfcommentcolor\pdfmark[UV]pdfmark=/ANN,Subtype=/Widget,Raw=/TU (Ultraviolet\textCR(\pc@goptd@deadline)) /T (tooltip zref@526) /C [ ] /FT/Btn /F 768 /Ff 65536 /H/N /BS ¡¡ /W 0 ¿¿ and high-energy radiation. The characteristic timescale of these processes is relatively short (of the order of the lifetime of massive stars; Myr) and their effect is usually localized around the star forming region. For these reasons, the \HyColor@XZeroOneThreeFour\pc@goptd@color\pc@hyenc@colorpdfcommentcolor\HyColor@XZeroOneThreeFour\pc@goptd@fontcolor\pc@hyenc@fontcolorpdfcommentcolor\HyColor@XZeroOneThreeFour\pc@goptd@icolor\pc@hyenc@icolorpdfcommentcolor\pdfmark[sSFR]pdfmark=/ANN,Subtype=/Widget,Raw=/TU (Specific star formation rate (SFR/M*)\textCR(\pc@goptd@deadline)) /T (tooltip zref@527) /C [ ] /FT/Btn /F 768 /Ff 65536 /H/N /BS ¡¡ /W 0 ¿¿ is an indicator of sustained dust processing. However, the dust lifecycle is a hysteresis. There is a longer term evolution, resulting from the progressive elemental enrichment of the \HyColor@XZeroOneThreeFour\pc@goptd@color\pc@hyenc@colorpdfcommentcolor\HyColor@XZeroOneThreeFour\pc@goptd@fontcolor\pc@hyenc@fontcolorpdfcommentcolor\HyColor@XZeroOneThreeFour\pc@goptd@icolor\pc@hyenc@icolorpdfcommentcolor\pdfmark[ISM]pdfmark=/ANN,Subtype=/Widget,Raw=/TU (Interstellar medium\textCR(\pc@goptd@deadline)) /T (tooltip zref@528) /C [ ] /FT/Btn /F 768 /Ff 65536 /H/N /BS ¡¡ /W 0 ¿¿ , which becomes evident on timescales of Gyr. This evolutionary process can be traced by the metallicity.
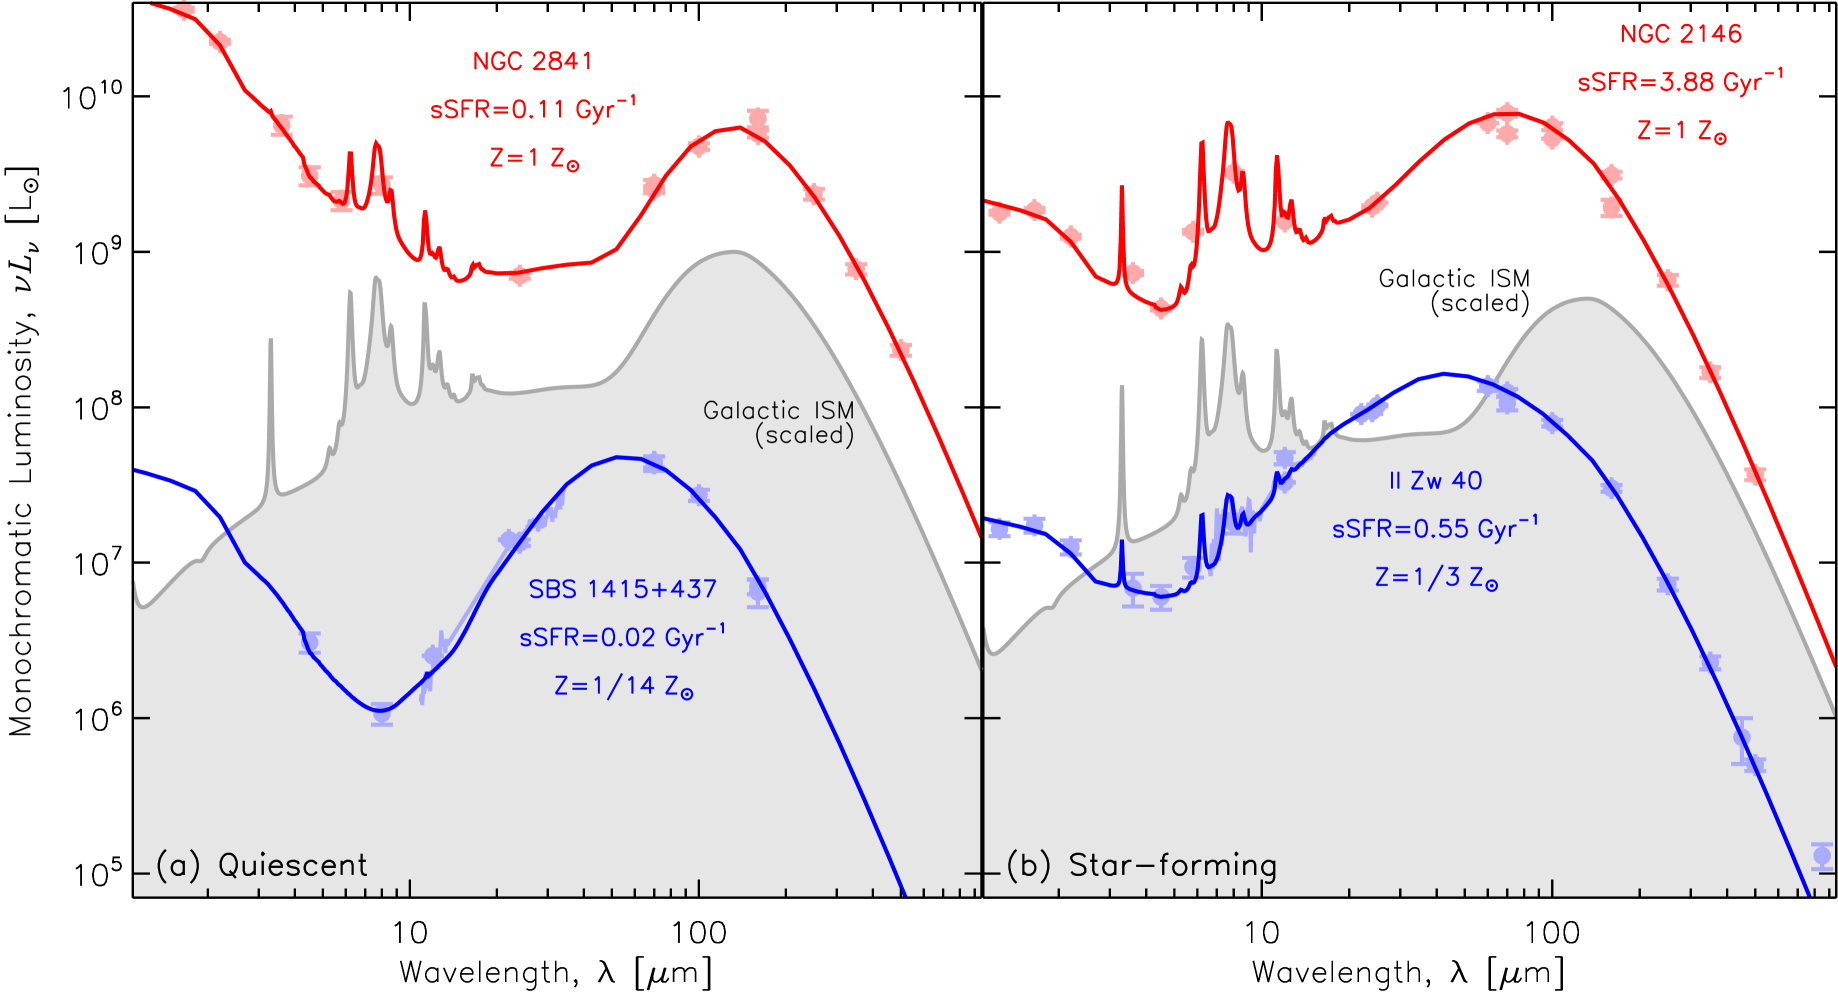
These two evolutionary timescales have an impact on the integrated \HyColor@XZeroOneThreeFour\pc@goptd@color\pc@hyenc@colorpdfcommentcolor\HyColor@XZeroOneThreeFour\pc@goptd@fontcolor\pc@hyenc@fontcolorpdfcommentcolor\HyColor@XZeroOneThreeFour\pc@goptd@icolor\pc@hyenc@icolorpdfcommentcolor\pdfmark[SED]pdfmark=/ANN,Subtype=/Widget,Raw=/TU (Spectral energy distribution\textCR(\pc@goptd@deadline)) /T (tooltip zref@557) /C [ ] /FT/Btn /F 768 /Ff 65536 /H/N /BS ¡¡ /W 0 ¿¿ s of nearby galaxies. Figure 7 illustrates that the effects of star formation activity and metallicity are not always easy to disentangle. Indeed, low-\HyColor@XZeroOneThreeFour\pc@goptd@color\pc@hyenc@colorpdfcommentcolor\HyColor@XZeroOneThreeFour\pc@goptd@fontcolor\pc@hyenc@fontcolorpdfcommentcolor\HyColor@XZeroOneThreeFour\pc@goptd@icolor\pc@hyenc@icolorpdfcommentcolor\pdfmark[]pdfmark=/ANN,Subtype=/Widget,Raw=/TU (Metallicity\textCR(\pc@goptd@deadline)) /T (tooltip zref@558) /C [ ] /FT/Btn /F 768 /Ff 65536 /H/N /BS ¡¡ /W 0 ¿¿ systems are often dominated by young stellar populations. In addition, their lower dust-to-gas mass ratio renders their \HyColor@XZeroOneThreeFour\pc@goptd@color\pc@hyenc@colorpdfcommentcolor\HyColor@XZeroOneThreeFour\pc@goptd@fontcolor\pc@hyenc@fontcolorpdfcommentcolor\HyColor@XZeroOneThreeFour\pc@goptd@icolor\pc@hyenc@icolorpdfcommentcolor\pdfmark[ISM]pdfmark=/ANN,Subtype=/Widget,Raw=/TU (Interstellar medium\textCR(\pc@goptd@deadline)) /T (tooltip zref@559) /C [ ] /FT/Btn /F 768 /Ff 65536 /H/N /BS ¡¡ /W 0 ¿¿ more transparent, and thus allows massive star formation to impact the \HyColor@XZeroOneThreeFour\pc@goptd@color\pc@hyenc@colorpdfcommentcolor\HyColor@XZeroOneThreeFour\pc@goptd@fontcolor\pc@hyenc@fontcolorpdfcommentcolor\HyColor@XZeroOneThreeFour\pc@goptd@icolor\pc@hyenc@icolorpdfcommentcolor\pdfmark[ISM]pdfmark=/ANN,Subtype=/Widget,Raw=/TU (Interstellar medium\textCR(\pc@goptd@deadline)) /T (tooltip zref@560) /C [ ] /FT/Btn /F 768 /Ff 65536 /H/N /BS ¡¡ /W 0 ¿¿ in a larger volume (cf. Section 3.1.3). In other words, some properties of dwarf galaxies may be the result of their hard and intense radiation field, rather than their low metallicity. In practice, dust evolution processes can be probed by comparing regions in a galaxy or by comparing integrated galaxies. Our ability to observe \HyColor@XZeroOneThreeFour\pc@goptd@color\pc@hyenc@colorpdfcommentcolor\HyColor@XZeroOneThreeFour\pc@goptd@fontcolor\pc@hyenc@fontcolorpdfcommentcolor\HyColor@XZeroOneThreeFour\pc@goptd@icolor\pc@hyenc@icolorpdfcommentcolor\pdfmark[ISM]pdfmark=/ANN,Subtype=/Widget,Raw=/TU (Interstellar medium\textCR(\pc@goptd@deadline)) /T (tooltip zref@561) /C [ ] /FT/Btn /F 768 /Ff 65536 /H/N /BS ¡¡ /W 0 ¿¿ dust evolution in real time is limited to \HyColor@XZeroOneThreeFour\pc@goptd@color\pc@hyenc@colorpdfcommentcolor\HyColor@XZeroOneThreeFour\pc@goptd@fontcolor\pc@hyenc@fontcolorpdfcommentcolor\HyColor@XZeroOneThreeFour\pc@goptd@icolor\pc@hyenc@icolorpdfcommentcolor\pdfmark[SN]pdfmark=/ANN,Subtype=/Widget,Raw=/TU (Supernova\textCR(\pc@goptd@deadline)) /T (tooltip zref@562) /C [ ] /FT/Btn /F 768 /Ff 65536 /H/N /BS ¡¡ /W 0 ¿¿ remnants (e.g. \HyColor@XZeroOneThreeFour\pc@goptd@color\pc@hyenc@colorpdfcommentcolor\HyColor@XZeroOneThreeFour\pc@goptd@fontcolor\pc@hyenc@fontcolorpdfcommentcolor\HyColor@XZeroOneThreeFour\pc@goptd@icolor\pc@hyenc@icolorpdfcommentcolor\pdfmark[SN]pdfmark=/ANN,Subtype=/Widget,Raw=/TU (Supernova\textCR(\pc@goptd@deadline)) /T (tooltip zref@563) /C [ ] /FT/Btn /F 768 /Ff 65536 /H/N /BS ¡¡ /W 0 ¿¿ 1987A; Dwek et al., 2010).
9.2 Localized Dust Processing
9.2.1 Grain Growth
There is clear evidence of \HyColor@XZeroOneThreeFour\pc@goptd@color\pc@hyenc@colorpdfcommentcolor\HyColor@XZeroOneThreeFour\pc@goptd@fontcolor\pc@hyenc@fontcolorpdfcommentcolor\HyColor@XZeroOneThreeFour\pc@goptd@icolor\pc@hyenc@icolorpdfcommentcolor\pdfmark[FIR]pdfmark=/ANN,Subtype=/Widget,Raw=/TU (Far-infrared\textCR(\pc@goptd@deadline)) /T (tooltip zref@564) /C [ ] /FT/Btn /F 768 /Ff 65536 /H/N /BS ¡¡ /W 0 ¿¿ opacity variation in the \HyColor@XZeroOneThreeFour\pc@goptd@color\pc@hyenc@colorpdfcommentcolor\HyColor@XZeroOneThreeFour\pc@goptd@fontcolor\pc@hyenc@fontcolorpdfcommentcolor\HyColor@XZeroOneThreeFour\pc@goptd@icolor\pc@hyenc@icolorpdfcommentcolor\pdfmark[MW]pdfmark=/ANN,Subtype=/Widget,Raw=/TU (Milky Way\textCR(\pc@goptd@deadline)) /T (tooltip zref@565) /C [ ] /FT/Btn /F 768 /Ff 65536 /H/N /BS ¡¡ /W 0 ¿¿ . The main factor seems to be the density of the medium. For instance, Stepnik et al. (2003) found that the \HyColor@XZeroOneThreeFour\pc@goptd@color\pc@hyenc@colorpdfcommentcolor\HyColor@XZeroOneThreeFour\pc@goptd@fontcolor\pc@hyenc@fontcolorpdfcommentcolor\HyColor@XZeroOneThreeFour\pc@goptd@icolor\pc@hyenc@icolorpdfcommentcolor\pdfmark[FIR]pdfmark=/ANN,Subtype=/Widget,Raw=/TU (Far-infrared\textCR(\pc@goptd@deadline)) /T (tooltip zref@566) /C [ ] /FT/Btn /F 768 /Ff 65536 /H/N /BS ¡¡ /W 0 ¿¿ dust cross-section per H atom increases by a factor of from the diffuse \HyColor@XZeroOneThreeFour\pc@goptd@color\pc@hyenc@colorpdfcommentcolor\HyColor@XZeroOneThreeFour\pc@goptd@fontcolor\pc@hyenc@fontcolorpdfcommentcolor\HyColor@XZeroOneThreeFour\pc@goptd@icolor\pc@hyenc@icolorpdfcommentcolor\pdfmark[ISM]pdfmark=/ANN,Subtype=/Widget,Raw=/TU (Interstellar medium\textCR(\pc@goptd@deadline)) /T (tooltip zref@567) /C [ ] /FT/Btn /F 768 /Ff 65536 /H/N /BS ¡¡ /W 0 ¿¿ to the molecular cloud they targeted. They noticed that this opacity variation is accompanied by the disappearance of the small grain emission. They concluded that grain coagulation could explain these variations (see also Köhler, Ysard & Jones, 2015, hereafter K15). In the diffuse \HyColor@XZeroOneThreeFour\pc@goptd@color\pc@hyenc@colorpdfcommentcolor\HyColor@XZeroOneThreeFour\pc@goptd@fontcolor\pc@hyenc@fontcolorpdfcommentcolor\HyColor@XZeroOneThreeFour\pc@goptd@icolor\pc@hyenc@icolorpdfcommentcolor\pdfmark[ISM]pdfmark=/ANN,Subtype=/Widget,Raw=/TU (Interstellar medium\textCR(\pc@goptd@deadline)) /T (tooltip zref@568) /C [ ] /FT/Btn /F 768 /Ff 65536 /H/N /BS ¡¡ /W 0 ¿¿ , Ysard et al. (2015) showed that the variation of emissivity, including the relation (cf. Section 4.1.1.1), could be explained by slight variations of the mantle thickness of the J17 model. This observed behaviour is also consistent with the progressive de-mantling and disaggregation of molecular cloud-formed, mantled and coagulated grains injected into the low density \HyColor@XZeroOneThreeFour\pc@goptd@color\pc@hyenc@colorpdfcommentcolor\HyColor@XZeroOneThreeFour\pc@goptd@fontcolor\pc@hyenc@fontcolorpdfcommentcolor\HyColor@XZeroOneThreeFour\pc@goptd@icolor\pc@hyenc@icolorpdfcommentcolor\pdfmark[ISM]pdfmark=/ANN,Subtype=/Widget,Raw=/TU (Interstellar medium\textCR(\pc@goptd@deadline)) /T (tooltip zref@569) /C [ ] /FT/Btn /F 768 /Ff 65536 /H/N /BS ¡¡ /W 0 ¿¿ , following cloud disruption. It is perhaps not unreasonable to hypothesise that dust growth in the \HyColor@XZeroOneThreeFour\pc@goptd@color\pc@hyenc@colorpdfcommentcolor\HyColor@XZeroOneThreeFour\pc@goptd@fontcolor\pc@hyenc@fontcolorpdfcommentcolor\HyColor@XZeroOneThreeFour\pc@goptd@icolor\pc@hyenc@icolorpdfcommentcolor\pdfmark[ISM]pdfmark=/ANN,Subtype=/Widget,Raw=/TU (Interstellar medium\textCR(\pc@goptd@deadline)) /T (tooltip zref@570) /C [ ] /FT/Btn /F 768 /Ff 65536 /H/N /BS ¡¡ /W 0 ¿¿ occurs on short timescales during cloud collapse rather than by dust growth in the quiescent diffuse \HyColor@XZeroOneThreeFour\pc@goptd@color\pc@hyenc@colorpdfcommentcolor\HyColor@XZeroOneThreeFour\pc@goptd@fontcolor\pc@hyenc@fontcolorpdfcommentcolor\HyColor@XZeroOneThreeFour\pc@goptd@icolor\pc@hyenc@icolorpdfcommentcolor\pdfmark[ISM]pdfmark=/ANN,Subtype=/Widget,Raw=/TU (Interstellar medium\textCR(\pc@goptd@deadline)) /T (tooltip zref@571) /C [ ] /FT/Btn /F 768 /Ff 65536 /H/N /BS ¡¡ /W 0 ¿¿ . In this alternative interpretation, the arrow of time is in the opposite sense and requires rapid dust growth, through accretion and coagulation, in dense molecular regions and slow de-mantling and disaggregation in the diffuse \HyColor@XZeroOneThreeFour\pc@goptd@color\pc@hyenc@colorpdfcommentcolor\HyColor@XZeroOneThreeFour\pc@goptd@fontcolor\pc@hyenc@fontcolorpdfcommentcolor\HyColor@XZeroOneThreeFour\pc@goptd@icolor\pc@hyenc@icolorpdfcommentcolor\pdfmark[ISM]pdfmark=/ANN,Subtype=/Widget,Raw=/TU (Interstellar medium\textCR(\pc@goptd@deadline)) /T (tooltip zref@572) /C [ ] /FT/Btn /F 768 /Ff 65536 /H/N /BS ¡¡ /W 0 ¿¿ .
In nearby galaxies, such studies are difficult to conduct, as the emissivity variations are smoothed out by the mixing of dense and diffuse regions. Even, when potential evolutionary trends are observed, their interpretation is often degenerate with other factors. The Magellanic clouds are the most obvious systems where this type of study can be attempted. The insights provided by depletion studies (cf. Section 6.3) show that there are clear variations of the fraction of heavy elements locked-up in dust, and these variations correlate with the density (Tchernyshyov et al., 2015; Jenkins & Wallerstein, 2017). Since the coagulation and the accretion of mantles lead to an increase of \HyColor@XZeroOneThreeFour\pc@goptd@color\pc@hyenc@colorpdfcommentcolor\HyColor@XZeroOneThreeFour\pc@goptd@fontcolor\pc@hyenc@fontcolorpdfcommentcolor\HyColor@XZeroOneThreeFour\pc@goptd@icolor\pc@hyenc@icolorpdfcommentcolor\pdfmark[FIR]pdfmark=/ANN,Subtype=/Widget,Raw=/TU (Far-infrared\textCR(\pc@goptd@deadline)) /T (tooltip zref@573) /C [ ] /FT/Btn /F 768 /Ff 65536 /H/N /BS ¡¡ /W 0 ¿¿ emissivity (e.g. K15, ), we should expect emissivity variations in the Magellanic clouds. Indeed, Roman-Duval et al. (2017) studied the trends of gas surface density (derived from H i and CO) as a function of dust surface density (derived from the \HyColor@XZeroOneThreeFour\pc@goptd@color\pc@hyenc@colorpdfcommentcolor\HyColor@XZeroOneThreeFour\pc@goptd@fontcolor\pc@hyenc@fontcolorpdfcommentcolor\HyColor@XZeroOneThreeFour\pc@goptd@icolor\pc@hyenc@icolorpdfcommentcolor\pdfmark[IR]pdfmark=/ANN,Subtype=/Widget,Raw=/TU (Infrared\textCR(\pc@goptd@deadline)) /T (tooltip zref@574) /C [ ] /FT/Btn /F 768 /Ff 65536 /H/N /BS ¡¡ /W 0 ¿¿ emission), in these galaxies. They found that the observed dust-to-gas mass ratio of the \HyColor@XZeroOneThreeFour\pc@goptd@color\pc@hyenc@colorpdfcommentcolor\HyColor@XZeroOneThreeFour\pc@goptd@fontcolor\pc@hyenc@fontcolorpdfcommentcolor\HyColor@XZeroOneThreeFour\pc@goptd@icolor\pc@hyenc@icolorpdfcommentcolor\pdfmark[LMC]pdfmark=/ANN,Subtype=/Widget,Raw=/TU (Large Magellanic cloud\textCR(\pc@goptd@deadline)) /T (tooltip zref@575) /C [ ] /FT/Btn /F 768 /Ff 65536 /H/N /BS ¡¡ /W 0 ¿¿ increases smoothly by a factor of from the diffuse to the dense regions. In the \HyColor@XZeroOneThreeFour\pc@goptd@color\pc@hyenc@colorpdfcommentcolor\HyColor@XZeroOneThreeFour\pc@goptd@fontcolor\pc@hyenc@fontcolorpdfcommentcolor\HyColor@XZeroOneThreeFour\pc@goptd@icolor\pc@hyenc@icolorpdfcommentcolor\pdfmark[SMC]pdfmark=/ANN,Subtype=/Widget,Raw=/TU (Small Magellanic cloud\textCR(\pc@goptd@deadline)) /T (tooltip zref@576) /C [ ] /FT/Btn /F 768 /Ff 65536 /H/N /BS ¡¡ /W 0 ¿¿ , the same variation occurs, with a factor of . They argue that optically thick H i and CO-free H2 gas (cf. Section 5.1.2) can not explain these trends, and that grain growth is thus the most likely explanation. However, we note that the possible increase of the dust opacity with density could explain part of this trend.
9.2.2 Size Distribution Variations
As we have seen in Section 6.2, there is a great diversity of extinction curves in the \HyColor@XZeroOneThreeFour\pc@goptd@color\pc@hyenc@colorpdfcommentcolor\HyColor@XZeroOneThreeFour\pc@goptd@fontcolor\pc@hyenc@fontcolorpdfcommentcolor\HyColor@XZeroOneThreeFour\pc@goptd@icolor\pc@hyenc@icolorpdfcommentcolor\pdfmark[MW]pdfmark=/ANN,Subtype=/Widget,Raw=/TU (Milky Way\textCR(\pc@goptd@deadline)) /T (tooltip zref@577) /C [ ] /FT/Btn /F 768 /Ff 65536 /H/N /BS ¡¡ /W 0 ¿¿ and nearby galaxies. A large part of these variations is thought to be the result of variations in the size distribution, small corresponding to an overabundance of small grains (e.g. Cartledge et al., 2005). Comparing the \HyColor@XZeroOneThreeFour\pc@goptd@color\pc@hyenc@colorpdfcommentcolor\HyColor@XZeroOneThreeFour\pc@goptd@fontcolor\pc@hyenc@fontcolorpdfcommentcolor\HyColor@XZeroOneThreeFour\pc@goptd@icolor\pc@hyenc@icolorpdfcommentcolor\pdfmark[SMC]pdfmark=/ANN,Subtype=/Widget,Raw=/TU (Small Magellanic cloud\textCR(\pc@goptd@deadline)) /T (tooltip zref@578) /C [ ] /FT/Btn /F 768 /Ff 65536 /H/N /BS ¡¡ /W 0 ¿¿ bar to the \HyColor@XZeroOneThreeFour\pc@goptd@color\pc@hyenc@colorpdfcommentcolor\HyColor@XZeroOneThreeFour\pc@goptd@fontcolor\pc@hyenc@fontcolorpdfcommentcolor\HyColor@XZeroOneThreeFour\pc@goptd@icolor\pc@hyenc@icolorpdfcommentcolor\pdfmark[SMC]pdfmark=/ANN,Subtype=/Widget,Raw=/TU (Small Magellanic cloud\textCR(\pc@goptd@deadline)) /T (tooltip zref@579) /C [ ] /FT/Btn /F 768 /Ff 65536 /H/N /BS ¡¡ /W 0 ¿¿ wing or the \HyColor@XZeroOneThreeFour\pc@goptd@color\pc@hyenc@colorpdfcommentcolor\HyColor@XZeroOneThreeFour\pc@goptd@fontcolor\pc@hyenc@fontcolorpdfcommentcolor\HyColor@XZeroOneThreeFour\pc@goptd@icolor\pc@hyenc@icolorpdfcommentcolor\pdfmark[LMC]pdfmark=/ANN,Subtype=/Widget,Raw=/TU (Large Magellanic cloud\textCR(\pc@goptd@deadline)) /T (tooltip zref@580) /C [ ] /FT/Btn /F 768 /Ff 65536 /H/N /BS ¡¡ /W 0 ¿¿ 2 supershell to the \HyColor@XZeroOneThreeFour\pc@goptd@color\pc@hyenc@colorpdfcommentcolor\HyColor@XZeroOneThreeFour\pc@goptd@fontcolor\pc@hyenc@fontcolorpdfcommentcolor\HyColor@XZeroOneThreeFour\pc@goptd@icolor\pc@hyenc@icolorpdfcommentcolor\pdfmark[LMC]pdfmark=/ANN,Subtype=/Widget,Raw=/TU (Large Magellanic cloud\textCR(\pc@goptd@deadline)) /T (tooltip zref@581) /C [ ] /FT/Btn /F 768 /Ff 65536 /H/N /BS ¡¡ /W 0 ¿¿ average (Figure 6), it appears that there are more small grains in regions of massive star formation. In the same way, comparing the extinction curves in the \HyColor@XZeroOneThreeFour\pc@goptd@color\pc@hyenc@colorpdfcommentcolor\HyColor@XZeroOneThreeFour\pc@goptd@fontcolor\pc@hyenc@fontcolorpdfcommentcolor\HyColor@XZeroOneThreeFour\pc@goptd@icolor\pc@hyenc@icolorpdfcommentcolor\pdfmark[MW]pdfmark=/ANN,Subtype=/Widget,Raw=/TU (Milky Way\textCR(\pc@goptd@deadline)) /T (tooltip zref@582) /C [ ] /FT/Btn /F 768 /Ff 65536 /H/N /BS ¡¡ /W 0 ¿¿ , \HyColor@XZeroOneThreeFour\pc@goptd@color\pc@hyenc@colorpdfcommentcolor\HyColor@XZeroOneThreeFour\pc@goptd@fontcolor\pc@hyenc@fontcolorpdfcommentcolor\HyColor@XZeroOneThreeFour\pc@goptd@icolor\pc@hyenc@icolorpdfcommentcolor\pdfmark[LMC]pdfmark=/ANN,Subtype=/Widget,Raw=/TU (Large Magellanic cloud\textCR(\pc@goptd@deadline)) /T (tooltip zref@583) /C [ ] /FT/Btn /F 768 /Ff 65536 /H/N /BS ¡¡ /W 0 ¿¿ and \HyColor@XZeroOneThreeFour\pc@goptd@color\pc@hyenc@colorpdfcommentcolor\HyColor@XZeroOneThreeFour\pc@goptd@fontcolor\pc@hyenc@fontcolorpdfcommentcolor\HyColor@XZeroOneThreeFour\pc@goptd@icolor\pc@hyenc@icolorpdfcommentcolor\pdfmark[SMC]pdfmark=/ANN,Subtype=/Widget,Raw=/TU (Small Magellanic cloud\textCR(\pc@goptd@deadline)) /T (tooltip zref@584) /C [ ] /FT/Btn /F 768 /Ff 65536 /H/N /BS ¡¡ /W 0 ¿¿ , we also notice that there is a potential increase of the small grain fraction when the metallicity decreases. As pointed out in Section 9.1, the two effects are degenerate.
Constraining the size distribution from the \HyColor@XZeroOneThreeFour\pc@goptd@color\pc@hyenc@colorpdfcommentcolor\HyColor@XZeroOneThreeFour\pc@goptd@fontcolor\pc@hyenc@fontcolorpdfcommentcolor\HyColor@XZeroOneThreeFour\pc@goptd@icolor\pc@hyenc@icolorpdfcommentcolor\pdfmark[IR]pdfmark=/ANN,Subtype=/Widget,Raw=/TU (Infrared\textCR(\pc@goptd@deadline)) /T (tooltip zref@585) /C [ ] /FT/Btn /F 768 /Ff 65536 /H/N /BS ¡¡ /W 0 ¿¿ emission is more difficult due to the degeneracy between size and \HyColor@XZeroOneThreeFour\pc@goptd@color\pc@hyenc@colorpdfcommentcolor\HyColor@XZeroOneThreeFour\pc@goptd@fontcolor\pc@hyenc@fontcolorpdfcommentcolor\HyColor@XZeroOneThreeFour\pc@goptd@icolor\pc@hyenc@icolorpdfcommentcolor\pdfmark[ISRF]pdfmark=/ANN,Subtype=/Widget,Raw=/TU (Interstellar radiation field\textCR(\pc@goptd@deadline)) /T (tooltip zref@586) /C [ ] /FT/Btn /F 768 /Ff 65536 /H/N /BS ¡¡ /W 0 ¿¿ distributions (cf. Section 5.0.2.1). However, Lisenfeld et al. (2002) and Galliano et al. (2003) attempted the modelling of the \HyColor@XZeroOneThreeFour\pc@goptd@color\pc@hyenc@colorpdfcommentcolor\HyColor@XZeroOneThreeFour\pc@goptd@fontcolor\pc@hyenc@fontcolorpdfcommentcolor\HyColor@XZeroOneThreeFour\pc@goptd@icolor\pc@hyenc@icolorpdfcommentcolor\pdfmark[IR]pdfmark=/ANN,Subtype=/Widget,Raw=/TU (Infrared\textCR(\pc@goptd@deadline)) /T (tooltip zref@587) /C [ ] /FT/Btn /F 768 /Ff 65536 /H/N /BS ¡¡ /W 0 ¿¿ \HyColor@XZeroOneThreeFour\pc@goptd@color\pc@hyenc@colorpdfcommentcolor\HyColor@XZeroOneThreeFour\pc@goptd@fontcolor\pc@hyenc@fontcolorpdfcommentcolor\HyColor@XZeroOneThreeFour\pc@goptd@icolor\pc@hyenc@icolorpdfcommentcolor\pdfmark[SED]pdfmark=/ANN,Subtype=/Widget,Raw=/TU (Spectral energy distribution\textCR(\pc@goptd@deadline)) /T (tooltip zref@588) /C [ ] /FT/Btn /F 768 /Ff 65536 /H/N /BS ¡¡ /W 0 ¿¿ of the dwarf galaxy NGC 1569, varying the size distribution. They both concluded that the dust in this object is dominated by nano-grains. Interestingly enough, the extinction curve corresponding to the grain properties of Galliano et al. (2003) was qualitatively similar to the \HyColor@XZeroOneThreeFour\pc@goptd@color\pc@hyenc@colorpdfcommentcolor\HyColor@XZeroOneThreeFour\pc@goptd@fontcolor\pc@hyenc@fontcolorpdfcommentcolor\HyColor@XZeroOneThreeFour\pc@goptd@icolor\pc@hyenc@icolorpdfcommentcolor\pdfmark[SMC]pdfmark=/ANN,Subtype=/Widget,Raw=/TU (Small Magellanic cloud\textCR(\pc@goptd@deadline)) /T (tooltip zref@589) /C [ ] /FT/Btn /F 768 /Ff 65536 /H/N /BS ¡¡ /W 0 ¿¿ , with a steep \HyColor@XZeroOneThreeFour\pc@goptd@color\pc@hyenc@colorpdfcommentcolor\HyColor@XZeroOneThreeFour\pc@goptd@fontcolor\pc@hyenc@fontcolorpdfcommentcolor\HyColor@XZeroOneThreeFour\pc@goptd@icolor\pc@hyenc@icolorpdfcommentcolor\pdfmark[FUV]pdfmark=/ANN,Subtype=/Widget,Raw=/TU (Far-ultraviolet\textCR(\pc@goptd@deadline)) /T (tooltip zref@590) /C [ ] /FT/Btn /F 768 /Ff 65536 /H/N /BS ¡¡ /W 0 ¿¿ -rise and a weak bump. Galliano et al. (2005) found the same result for three other dwarf galaxies. In the \HyColor@XZeroOneThreeFour\pc@goptd@color\pc@hyenc@colorpdfcommentcolor\HyColor@XZeroOneThreeFour\pc@goptd@fontcolor\pc@hyenc@fontcolorpdfcommentcolor\HyColor@XZeroOneThreeFour\pc@goptd@icolor\pc@hyenc@icolorpdfcommentcolor\pdfmark[LMC]pdfmark=/ANN,Subtype=/Widget,Raw=/TU (Large Magellanic cloud\textCR(\pc@goptd@deadline)) /T (tooltip zref@591) /C [ ] /FT/Btn /F 768 /Ff 65536 /H/N /BS ¡¡ /W 0 ¿¿ , Paradis et al. (2009) also concluded to a drastic increase of the fraction of very small grains, especially around 30 Dor. It is possible that, even if a fraction of hot equilibrium dust has been mistaken for small grains by these studies, these systems harbor, on average, smaller grains than normal galaxies. \HyColor@XZeroOneThreeFour\pc@goptd@color\pc@hyenc@colorpdfcommentcolor\HyColor@XZeroOneThreeFour\pc@goptd@fontcolor\pc@hyenc@fontcolorpdfcommentcolor\HyColor@XZeroOneThreeFour\pc@goptd@icolor\pc@hyenc@icolorpdfcommentcolor\pdfmark[SN]pdfmark=/ANN,Subtype=/Widget,Raw=/TU (Supernova\textCR(\pc@goptd@deadline)) /T (tooltip zref@592) /C [ ] /FT/Btn /F 768 /Ff 65536 /H/N /BS ¡¡ /W 0 ¿¿ -triggered shock waves, which are abundant in star forming dwarf galaxies (cf. Section 3.1.3), by fragmenting large grains, could explain the peculiar \HyColor@XZeroOneThreeFour\pc@goptd@color\pc@hyenc@colorpdfcommentcolor\HyColor@XZeroOneThreeFour\pc@goptd@fontcolor\pc@hyenc@fontcolorpdfcommentcolor\HyColor@XZeroOneThreeFour\pc@goptd@icolor\pc@hyenc@icolorpdfcommentcolor\pdfmark[SED]pdfmark=/ANN,Subtype=/Widget,Raw=/TU (Spectral energy distribution\textCR(\pc@goptd@deadline)) /T (tooltip zref@593) /C [ ] /FT/Btn /F 768 /Ff 65536 /H/N /BS ¡¡ /W 0 ¿¿ s and extinction curves of dwarf galaxies (e.g. Fig. 17 of Bocchio, Jones & Slavin, 2014, ).
9.2.3 Grain Destruction
The dust destruction efficiency in \HyColor@XZeroOneThreeFour\pc@goptd@color\pc@hyenc@colorpdfcommentcolor\HyColor@XZeroOneThreeFour\pc@goptd@fontcolor\pc@hyenc@fontcolorpdfcommentcolor\HyColor@XZeroOneThreeFour\pc@goptd@icolor\pc@hyenc@icolorpdfcommentcolor\pdfmark[SN]pdfmark=/ANN,Subtype=/Widget,Raw=/TU (Supernova\textCR(\pc@goptd@deadline)) /T (tooltip zref@594) /C [ ] /FT/Btn /F 768 /Ff 65536 /H/N /BS ¡¡ /W 0 ¿¿ -triggered shock waves was recently re-estimated using the J17 model to evaluate the role of dust mantles, and to calculate the emission and extinction from shocked dust (Bocchio, Jones & Slavin, 2014). Further constraints were put on the silicate destruction time, using hydrodynamical simulations (Slavin, Dwek & Jones, 2015). The main conclusions of these studies are the following. (1) \HyColor@XZeroOneThreeFour\pc@goptd@color\pc@hyenc@colorpdfcommentcolor\HyColor@XZeroOneThreeFour\pc@goptd@fontcolor\pc@hyenc@fontcolorpdfcommentcolor\HyColor@XZeroOneThreeFour\pc@goptd@icolor\pc@hyenc@icolorpdfcommentcolor\pdfmark[a-C(:H)]pdfmark=/ANN,Subtype=/Widget,Raw=/TU ((hydrogenated) amorphous carbon\textCR(\pc@goptd@deadline)) /T (tooltip zref@595) /C [ ] /FT/Btn /F 768 /Ff 65536 /H/N /BS ¡¡ /W 0 ¿¿ grains are quickly destroyed, even in a shock, which is counter to earlier work (e.g. Jones, Tielens & Hollenbach, 1996) that used the properties of graphite and an amorphous carbon other than \HyColor@XZeroOneThreeFour\pc@goptd@color\pc@hyenc@colorpdfcommentcolor\HyColor@XZeroOneThreeFour\pc@goptd@fontcolor\pc@hyenc@fontcolorpdfcommentcolor\HyColor@XZeroOneThreeFour\pc@goptd@icolor\pc@hyenc@icolorpdfcommentcolor\pdfmark[a-C(:H)]pdfmark=/ANN,Subtype=/Widget,Raw=/TU ((hydrogenated) amorphous carbon\textCR(\pc@goptd@deadline)) /T (tooltip zref@596) /C [ ] /FT/Btn /F 768 /Ff 65536 /H/N /BS ¡¡ /W 0 ¿¿ . It implies that the re-formation of carbonaceous dust in the dense regions of the \HyColor@XZeroOneThreeFour\pc@goptd@color\pc@hyenc@colorpdfcommentcolor\HyColor@XZeroOneThreeFour\pc@goptd@fontcolor\pc@hyenc@fontcolorpdfcommentcolor\HyColor@XZeroOneThreeFour\pc@goptd@icolor\pc@hyenc@icolorpdfcommentcolor\pdfmark[ISM]pdfmark=/ANN,Subtype=/Widget,Raw=/TU (Interstellar medium\textCR(\pc@goptd@deadline)) /T (tooltip zref@597) /C [ ] /FT/Btn /F 768 /Ff 65536 /H/N /BS ¡¡ /W 0 ¿¿ is a strong requirement (cf. Section 9.2.1). (2) Silicate grains appear to be more resilient, with a mean lifetime of Gyr (Slavin, Dwek & Jones, 2015), one order of magnitude larger than the previous estimate of Myr (Jones, Tielens & Hollenbach, 1996).
9.2.3.1 Photodestruction of small grains
In Galactic \HyColor@XZeroOneThreeFour\pc@goptd@color\pc@hyenc@colorpdfcommentcolor\HyColor@XZeroOneThreeFour\pc@goptd@fontcolor\pc@hyenc@fontcolorpdfcommentcolor\HyColor@XZeroOneThreeFour\pc@goptd@icolor\pc@hyenc@icolorpdfcommentcolor\pdfmark[PDR]pdfmark=/ANN,Subtype=/Widget,Raw=/TU (Photodissociation region\textCR(\pc@goptd@deadline)) /T (tooltip zref@598) /C [ ] /FT/Btn /F 768 /Ff 65536 /H/N /BS ¡¡ /W 0 ¿¿ s, Boulanger et al. (1998, Fig. 3) showed that the \HyColor@XZeroOneThreeFour\pc@goptd@color\pc@hyenc@colorpdfcommentcolor\HyColor@XZeroOneThreeFour\pc@goptd@fontcolor\pc@hyenc@fontcolorpdfcommentcolor\HyColor@XZeroOneThreeFour\pc@goptd@icolor\pc@hyenc@icolorpdfcommentcolor\pdfmark[UIB]pdfmark=/ANN,Subtype=/Widget,Raw=/TU (Unidentified infrared band\textCR(\pc@goptd@deadline)) /T (tooltip zref@599) /C [ ] /FT/Btn /F 768 /Ff 65536 /H/N /BS ¡¡ /W 0 ¿¿ strength departs from a linear dependence on the \HyColor@XZeroOneThreeFour\pc@goptd@color\pc@hyenc@colorpdfcommentcolor\HyColor@XZeroOneThreeFour\pc@goptd@fontcolor\pc@hyenc@fontcolorpdfcommentcolor\HyColor@XZeroOneThreeFour\pc@goptd@icolor\pc@hyenc@icolorpdfcommentcolor\pdfmark[ISRF]pdfmark=/ANN,Subtype=/Widget,Raw=/TU (Interstellar radiation field\textCR(\pc@goptd@deadline)) /T (tooltip zref@600) /C [ ] /FT/Btn /F 768 /Ff 65536 /H/N /BS ¡¡ /W 0 ¿¿ intensity, \HyColor@XZeroOneThreeFour\pc@goptd@color\pc@hyenc@colorpdfcommentcolor\HyColor@XZeroOneThreeFour\pc@goptd@fontcolor\pc@hyenc@fontcolorpdfcommentcolor\HyColor@XZeroOneThreeFour\pc@goptd@icolor\pc@hyenc@icolorpdfcommentcolor\pdfmark[]pdfmark=/ANN,Subtype=/Widget,Raw=/TU (Interstellar radiation field intensity\textCR(\pc@goptd@deadline)) /T (tooltip zref@601) /C [ ] /FT/Btn /F 768 /Ff 65536 /H/N /BS ¡¡ /W 0 ¿¿ , for \pdfmark[U]pdfmark=/ANN,Subtype=/Widget,Raw=/TU (Interstellar radiation field intensity\textCR(\pc@goptd@deadline)) /T (tooltip zref@602) /C [ ] /FT/Btn /F 768 /Ff 65536 /H/N /BS ¡¡ /W 0 ¿¿ ≳1000\pdfmark[UIB]pdfmark=/ANN,Subtype=/Widget,Raw=/TU (Unidentified infrared band\textCR(\pc@goptd@deadline)) /T (tooltip zref@603) /C [ ] /FT/Btn /F 768 /Ff 65536 /H/N /BS ¡¡ /W 0 ¿¿ s are most likely not coming from high \HyColor@XZeroOneThreeFour\pc@goptd@color\pc@hyenc@colorpdfcommentcolor\HyColor@XZeroOneThreeFour\pc@goptd@fontcolor\pc@hyenc@fontcolorpdfcommentcolor\HyColor@XZeroOneThreeFour\pc@goptd@icolor\pc@hyenc@icolorpdfcommentcolor\pdfmark[ISRF]pdfmark=/ANN,Subtype=/Widget,Raw=/TU (Interstellar radiation field\textCR(\pc@goptd@deadline)) /T (tooltip zref@604) /C [ ] /FT/Btn /F 768 /Ff 65536 /H/N /BS ¡¡ /W 0 ¿¿ regions. More recently, work on radiative transfer modelling of the dust emission in Galactic \HyColor@XZeroOneThreeFour\pc@goptd@color\pc@hyenc@colorpdfcommentcolor\HyColor@XZeroOneThreeFour\pc@goptd@fontcolor\pc@hyenc@fontcolorpdfcommentcolor\HyColor@XZeroOneThreeFour\pc@goptd@icolor\pc@hyenc@icolorpdfcommentcolor\pdfmark[PDR]pdfmark=/ANN,Subtype=/Widget,Raw=/TU (Photodissociation region\textCR(\pc@goptd@deadline)) /T (tooltip zref@605) /C [ ] /FT/Btn /F 768 /Ff 65536 /H/N /BS ¡¡ /W 0 ¿¿ s has shown that the small grains are significantly under abundant, with respect to the diffuse \HyColor@XZeroOneThreeFour\pc@goptd@color\pc@hyenc@colorpdfcommentcolor\HyColor@XZeroOneThreeFour\pc@goptd@fontcolor\pc@hyenc@fontcolorpdfcommentcolor\HyColor@XZeroOneThreeFour\pc@goptd@icolor\pc@hyenc@icolorpdfcommentcolor\pdfmark[ISM]pdfmark=/ANN,Subtype=/Widget,Raw=/TU (Interstellar medium\textCR(\pc@goptd@deadline)) /T (tooltip zref@606) /C [ ] /FT/Btn /F 768 /Ff 65536 /H/N /BS ¡¡ /W 0 ¿¿ (Arab et al., 2012).
This phenomenon is widely observed in nearby galaxies. First, the \HyColor@XZeroOneThreeFour\pc@goptd@color\pc@hyenc@colorpdfcommentcolor\HyColor@XZeroOneThreeFour\pc@goptd@fontcolor\pc@hyenc@fontcolorpdfcommentcolor\HyColor@XZeroOneThreeFour\pc@goptd@icolor\pc@hyenc@icolorpdfcommentcolor\pdfmark[UIB]pdfmark=/ANN,Subtype=/Widget,Raw=/TU (Unidentified infrared band\textCR(\pc@goptd@deadline)) /T (tooltip zref@607) /C [ ] /FT/Btn /F 768 /Ff 65536 /H/N /BS ¡¡ /W 0 ¿¿ carriers appear cleared out of the hotter parts of extragalactic, star forming regions (e.g. Galametz et al., 2013; Wu et al., 2015). This destruction impacts a larger volume in blue compact galaxies. For example, in NGC 5253, the equivalent width increases with the distance from the \HyColor@XZeroOneThreeFour\pc@goptd@color\pc@hyenc@colorpdfcommentcolor\HyColor@XZeroOneThreeFour\pc@goptd@fontcolor\pc@hyenc@fontcolorpdfcommentcolor\HyColor@XZeroOneThreeFour\pc@goptd@icolor\pc@hyenc@icolorpdfcommentcolor\pdfmark[SSC]pdfmark=/ANN,Subtype=/Widget,Raw=/TU (Super Star Cluster\textCR(\pc@goptd@deadline)) /T (tooltip zref@608) /C [ ] /FT/Btn /F 768 /Ff 65536 /H/N /BS ¡¡ /W 0 ¿¿ region, over several hundreds of parsecs (Beirão et al., 2006). Second, the ratio of \HyColor@XZeroOneThreeFour\pc@goptd@color\pc@hyenc@colorpdfcommentcolor\HyColor@XZeroOneThreeFour\pc@goptd@fontcolor\pc@hyenc@fontcolorpdfcommentcolor\HyColor@XZeroOneThreeFour\pc@goptd@icolor\pc@hyenc@icolorpdfcommentcolor\pdfmark[LIRG]pdfmark=/ANN,Subtype=/Widget,Raw=/TU (Luminous infrared galaxy (1.E11 Lsun ¡ L(IR) ¡ 1.E12 Lsun)\textCR(\pc@goptd@deadline)) /T (tooltip zref@609) /C [ ] /FT/Btn /F 768 /Ff 65536 /H/N /BS ¡¡ /W 0 ¿¿ s and \HyColor@XZeroOneThreeFour\pc@goptd@color\pc@hyenc@colorpdfcommentcolor\HyColor@XZeroOneThreeFour\pc@goptd@fontcolor\pc@hyenc@fontcolorpdfcommentcolor\HyColor@XZeroOneThreeFour\pc@goptd@icolor\pc@hyenc@icolorpdfcommentcolor\pdfmark[ULIRG]pdfmark=/ANN,Subtype=/Widget,Raw=/TU (Ultraluminous infrared galaxy (L(IR) ¿ 1.E12 Lsun)\textCR(\pc@goptd@deadline)) /T (tooltip zref@610) /C [ ] /FT/Btn /F 768 /Ff 65536 /H/N /BS ¡¡ /W 0 ¿¿ s decreases when increases (e.g. Imanishi et al., 2010). Since quantifies the \HyColor@XZeroOneThreeFour\pc@goptd@color\pc@hyenc@colorpdfcommentcolor\HyColor@XZeroOneThreeFour\pc@goptd@fontcolor\pc@hyenc@fontcolorpdfcommentcolor\HyColor@XZeroOneThreeFour\pc@goptd@icolor\pc@hyenc@icolorpdfcommentcolor\pdfmark[SFR]pdfmark=/ANN,Subtype=/Widget,Raw=/TU (Star formation rate\textCR(\pc@goptd@deadline)) /T (tooltip zref@611) /C [ ] /FT/Btn /F 768 /Ff 65536 /H/N /BS ¡¡ /W 0 ¿¿ (cf. Section 5.1.1), this relation indicates that the \HyColor@XZeroOneThreeFour\pc@goptd@color\pc@hyenc@colorpdfcommentcolor\HyColor@XZeroOneThreeFour\pc@goptd@fontcolor\pc@hyenc@fontcolorpdfcommentcolor\HyColor@XZeroOneThreeFour\pc@goptd@icolor\pc@hyenc@icolorpdfcommentcolor\pdfmark[UIB]pdfmark=/ANN,Subtype=/Widget,Raw=/TU (Unidentified infrared band\textCR(\pc@goptd@deadline)) /T (tooltip zref@612) /C [ ] /FT/Btn /F 768 /Ff 65536 /H/N /BS ¡¡ /W 0 ¿¿ destruction can be seen at the scale of the whole galaxy. Finally, there are well-known correlations between the \HyColor@XZeroOneThreeFour\pc@goptd@color\pc@hyenc@colorpdfcommentcolor\HyColor@XZeroOneThreeFour\pc@goptd@fontcolor\pc@hyenc@fontcolorpdfcommentcolor\HyColor@XZeroOneThreeFour\pc@goptd@icolor\pc@hyenc@icolorpdfcommentcolor\pdfmark[UIB]pdfmark=/ANN,Subtype=/Widget,Raw=/TU (Unidentified infrared band\textCR(\pc@goptd@deadline)) /T (tooltip zref@613) /C [ ] /FT/Btn /F 768 /Ff 65536 /H/N /BS ¡¡ /W 0 ¿¿ equivalent width and various tracers of the intensity and hardness of the radiation field, such as the ionic line ratio [Ne iii]15.56μm/[Ne ii]12.81μm (Madden et al., 2006; Gordon et al., 2008; Lebouteiller et al., 2011). These correlations are observed both within spatially resolved sources and among integrated galaxies. These results suggests that scaling a diffuse \HyColor@XZeroOneThreeFour\pc@goptd@color\pc@hyenc@colorpdfcommentcolor\HyColor@XZeroOneThreeFour\pc@goptd@fontcolor\pc@hyenc@fontcolorpdfcommentcolor\HyColor@XZeroOneThreeFour\pc@goptd@icolor\pc@hyenc@icolorpdfcommentcolor\pdfmark[ISM]pdfmark=/ANN,Subtype=/Widget,Raw=/TU (Interstellar medium\textCR(\pc@goptd@deadline)) /T (tooltip zref@614) /C [ ] /FT/Btn /F 768 /Ff 65536 /H/N /BS ¡¡ /W 0 ¿¿ -type dust emission to regions of enhanced radiation field, such as in Figure 3-c, is not appropriate.
9.2.3.2 Sputtering: grain evolution in hot plasmas
The superwind of M 82 exhibits filaments of dust and gas around the central outflows. \HyColor@XZeroOneThreeFour\pc@goptd@color\pc@hyenc@colorpdfcommentcolor\HyColor@XZeroOneThreeFour\pc@goptd@fontcolor\pc@hyenc@fontcolorpdfcommentcolor\HyColor@XZeroOneThreeFour\pc@goptd@icolor\pc@hyenc@icolorpdfcommentcolor\pdfmark[PAH]pdfmark=/ANN,Subtype=/Widget,Raw=/TU (Polycyclic aromatic hydrocarbon\textCR(\pc@goptd@deadline)) /T (tooltip zref@615) /C [ ] /FT/Btn /F 768 /Ff 65536 /H/N /BS ¡¡ /W 0 ¿¿ s or carbonaceous nano-particles embedded in such energetic regions would be exposed to soft X-rays ( keV) and a hot gas ( K; Section 3.1.5). In such regions, their survival time is only Myr, and that their destruction is principally due to collisions with the hot gas rather than by X-ray photo-destruction (Micelotta, Jones & Tielens, 2010). Yet, \HyColor@XZeroOneThreeFour\pc@goptd@color\pc@hyenc@colorpdfcommentcolor\HyColor@XZeroOneThreeFour\pc@goptd@fontcolor\pc@hyenc@fontcolorpdfcommentcolor\HyColor@XZeroOneThreeFour\pc@goptd@icolor\pc@hyenc@icolorpdfcommentcolor\pdfmark[UIB]pdfmark=/ANN,Subtype=/Widget,Raw=/TU (Unidentified infrared band\textCR(\pc@goptd@deadline)) /T (tooltip zref@616) /C [ ] /FT/Btn /F 768 /Ff 65536 /H/N /BS ¡¡ /W 0 ¿¿ s are detected in these outflows (e.g. Yamagishi et al., 2012; Beirão et al., 2015). Thus, they are likely protected in the entrained cold gas that is being ablated into the hot outflowing gas, rather than present in the hot gas itself (Micelotta, Jones & Tielens, 2010; Bocchio et al., 2012, 2013).
9.3 Cosmic Dust Evolution
9.3.1 Dust-Related Scaling Relations
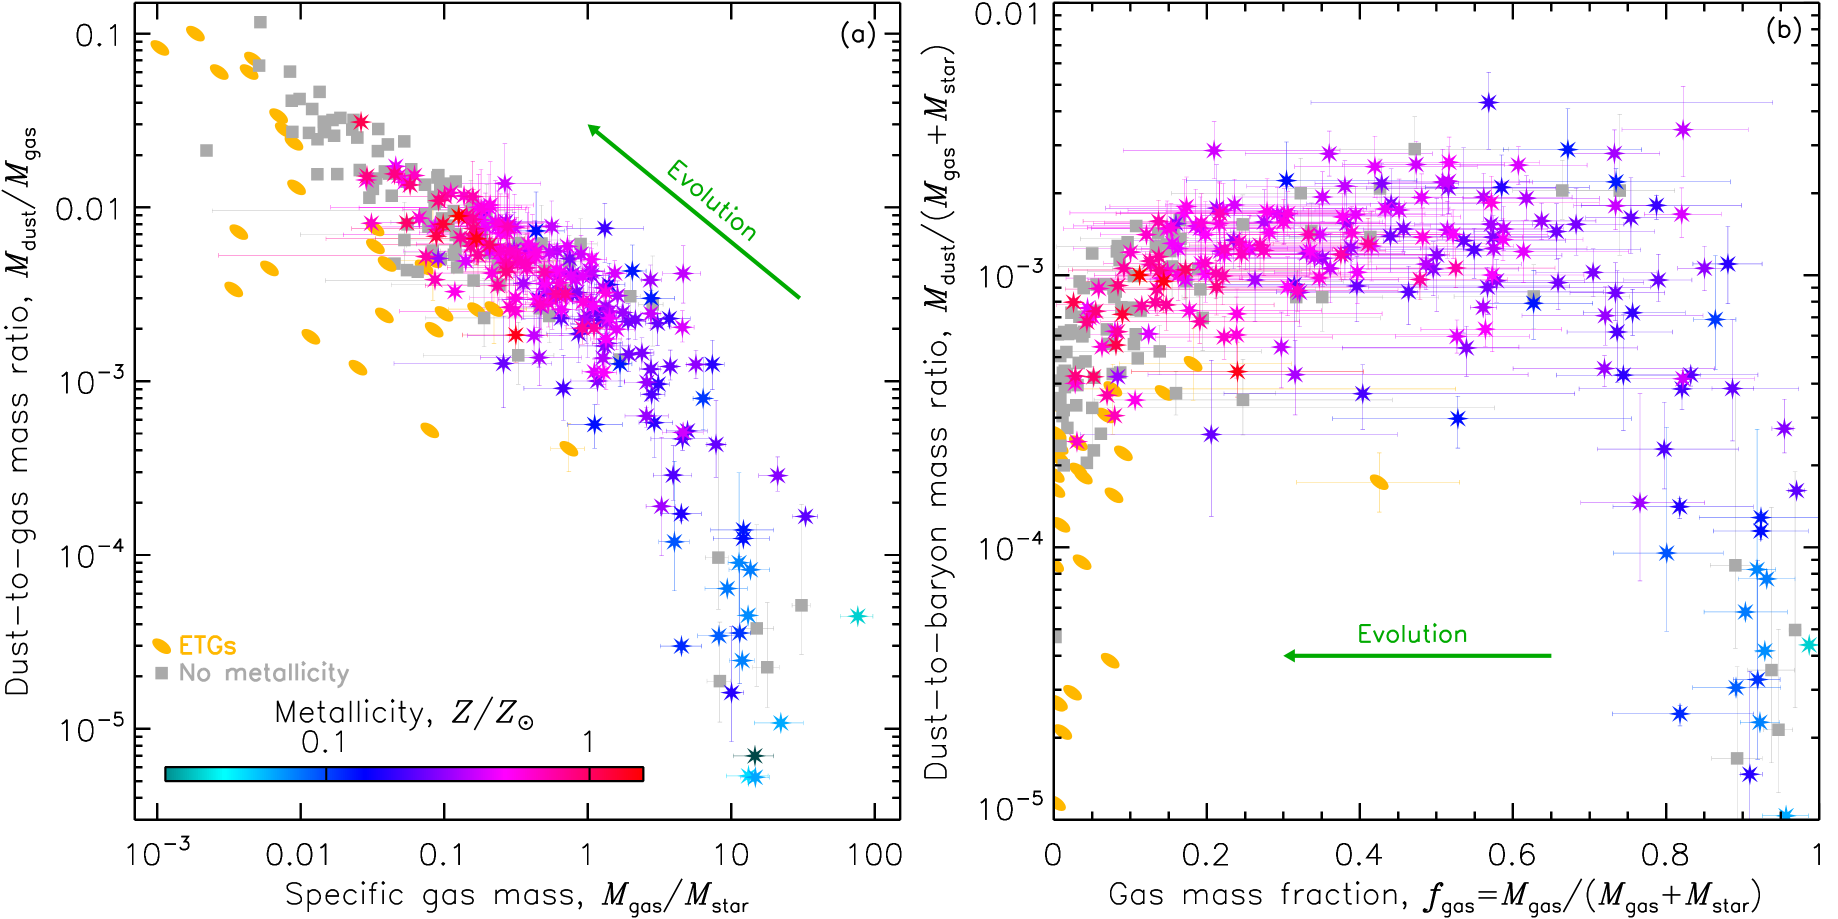
The correlation between combinations of global parameters, such as , , or \HyColor@XZeroOneThreeFour\pc@goptd@color\pc@hyenc@colorpdfcommentcolor\HyColor@XZeroOneThreeFour\pc@goptd@fontcolor\pc@hyenc@fontcolorpdfcommentcolor\HyColor@XZeroOneThreeFour\pc@goptd@icolor\pc@hyenc@icolorpdfcommentcolor\pdfmark[SFR]pdfmark=/ANN,Subtype=/Widget,Raw=/TU (Star formation rate\textCR(\pc@goptd@deadline)) /T (tooltip zref@619) /C [ ] /FT/Btn /F 768 /Ff 65536 /H/N /BS ¡¡ /W 0 ¿¿ , across galaxy types, provides observational clues of cosmic evolution. Dust-related scaling relations have thrived on \HyColor@XZeroOneThreeFour\pc@goptd@color\pc@hyenc@colorpdfcommentcolor\HyColor@XZeroOneThreeFour\pc@goptd@fontcolor\pc@hyenc@fontcolorpdfcommentcolor\HyColor@XZeroOneThreeFour\pc@goptd@icolor\pc@hyenc@icolorpdfcommentcolor\pdfmark[Herschel]pdfmark=/ANN,Subtype=/Widget,Raw=/TU (Herschel space observatory (55-672 microns; 2009-2013)\textCR(\pc@goptd@deadline)) /T (tooltip zref@620) /C [ ] /FT/Btn /F 768 /Ff 65536 /H/N /BS ¡¡ /W 0 ¿¿ data, as this observatory has provided reliable dust mass estimates for statistical samples of galaxies, with various selection criteria (e.g. Cortese et al., 2012; Rémy-Ruyer et al., 2015; Clark et al., 2015; De Vis et al., 2017a). Figure 8-a displays the evolution of the dust-to-gas mass ratio, as a function of the specific gas mass. When a galaxy evolves, its gas content is converted into stars, reducing the ratio. At the same time, the \HyColor@XZeroOneThreeFour\pc@goptd@color\pc@hyenc@colorpdfcommentcolor\HyColor@XZeroOneThreeFour\pc@goptd@fontcolor\pc@hyenc@fontcolorpdfcommentcolor\HyColor@XZeroOneThreeFour\pc@goptd@icolor\pc@hyenc@icolorpdfcommentcolor\pdfmark[ISM]pdfmark=/ANN,Subtype=/Widget,Raw=/TU (Interstellar medium\textCR(\pc@goptd@deadline)) /T (tooltip zref@621) /C [ ] /FT/Btn /F 768 /Ff 65536 /H/N /BS ¡¡ /W 0 ¿¿ is enriched in dust, increasing the ratio. We also see that Early-Type Galaxies (\HyColor@XZeroOneThreeFour\pc@goptd@color\pc@hyenc@colorpdfcommentcolor\HyColor@XZeroOneThreeFour\pc@goptd@fontcolor\pc@hyenc@fontcolorpdfcommentcolor\HyColor@XZeroOneThreeFour\pc@goptd@icolor\pc@hyenc@icolorpdfcommentcolor\pdfmark[ETG]pdfmark=/ANN,Subtype=/Widget,Raw=/TU (Early-type (evolved) galaxy\textCR(\pc@goptd@deadline)) /T (tooltip zref@622) /C [ ] /FT/Btn /F 768 /Ff 65536 /H/N /BS ¡¡ /W 0 ¿¿ ), which are X-ray bright sources, lie notably below the correlation. This is possibly the result of thermal sputtering of the grains in a hot plasma ( K; De Vis et al., 2017a). Figure 8-b demonstrates the effect of astration on the dust content. It shows the dust build-up, early-on (), then a plateau, and a net mass loss at ().
9.3.2 Dust-to-Gas Mass Ratio Evolution with Metallicity
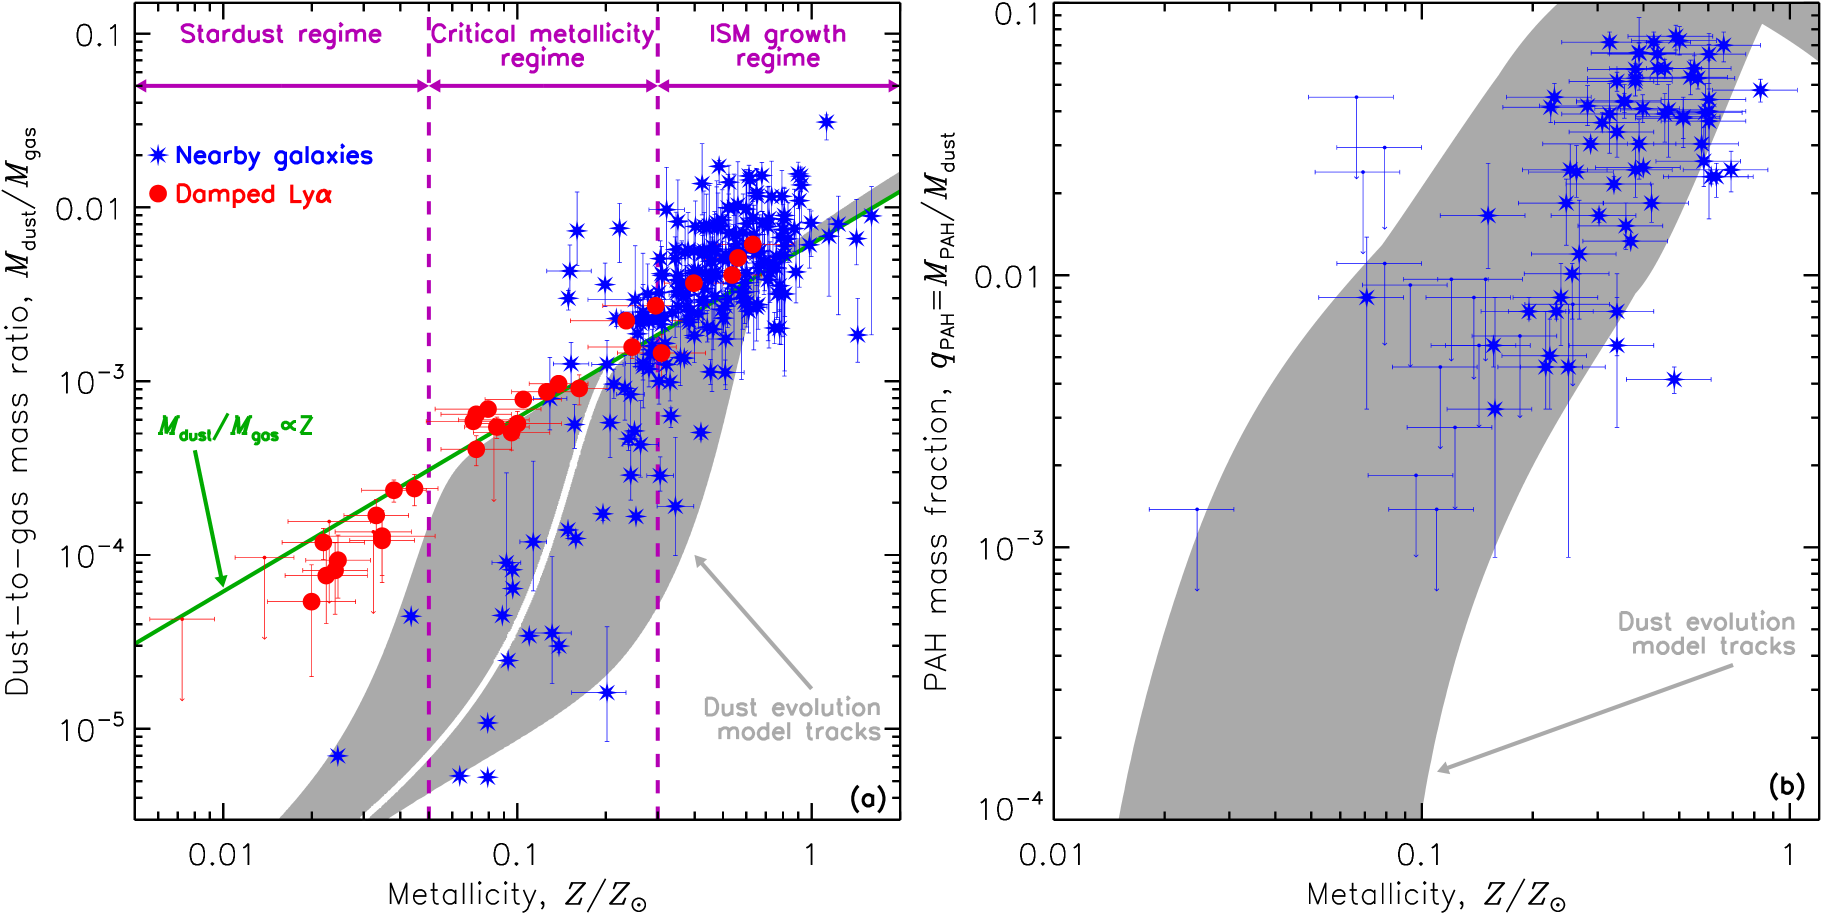
An important scaling relation, often used to constrain dust evolution models, is the trend of dust-to-gas mass ratio with metallicity (e.g. Lisenfeld & Ferrara, 1998; Draine et al., 2007; Galliano, Dwek & Chanial, 2008; Rémy-Ruyer et al., 2014; De Vis et al., 2017b). Figure 9-a shows this relation for nearby galaxies (in blue). It is clearly non-linear, suggesting that dust production is less efficient at early stages. There are several sources of uncertainties that could bias this relation. (1) To derive the dust mass, the dust constitution has been assumed homogeneous throughout the whole sample. However, the expected variations of the grain mixture constitution (cf. Section 9.2.1) could alter the dust mass by a factor (K15), which is only a minor effect on a trend spanning four orders of magnitude. (2) The estimate of the gas mass could be inaccurate. In particular, the absence of molecular gas mass constraints is problematic. However, we note that Rémy-Ruyer et al. (2014) using CO-derived H2 masses and exploring the effects of different CO-to-H2 conversion factors, found a similar trend. As noted by De Vis et al. (2017a), the displayed sample is not H2-dominated, and the uncertainty on the total gas mass is not expected to be larger than a factor of . (3) Low-metallicity galaxies usually have large H i halos surrounding their dust emitting region (cf. Section 3.1.3). A dust-to-gas mass ratio encompassing the whole halo would therefore be underestimated (see the discussion in Draine et al., 2007; Rémy-Ruyer et al., 2014). Although, this effect has been partially corrected for by Rémy-Ruyer et al. (2014), based on the available H i maps of their sample. In particular, the H i mass of the lowest metallicity source in Figure 9-a, I Zw 18, has been corrected. It is therefore difficult to understand how the non-linearity of the trend would result from sole measurement biases.
We compare the nearby galaxy trend to the \HyColor@XZeroOneThreeFour\pc@goptd@color\pc@hyenc@colorpdfcommentcolor\HyColor@XZeroOneThreeFour\pc@goptd@fontcolor\pc@hyenc@fontcolorpdfcommentcolor\HyColor@XZeroOneThreeFour\pc@goptd@icolor\pc@hyenc@icolorpdfcommentcolor\pdfmark[DLA]pdfmark=/ANN,Subtype=/Widget,Raw=/TU (Damped Lyman-alpha systems\textCR(\pc@goptd@deadline)) /T (tooltip zref@627) /C [ ] /FT/Btn /F 768 /Ff 65536 /H/N /BS ¡¡ /W 0 ¿¿ sample of De Cia et al. (2016), in Figure 9-a. The dust-to-gas mass ratio and the metallicity of \HyColor@XZeroOneThreeFour\pc@goptd@color\pc@hyenc@colorpdfcommentcolor\HyColor@XZeroOneThreeFour\pc@goptd@fontcolor\pc@hyenc@fontcolorpdfcommentcolor\HyColor@XZeroOneThreeFour\pc@goptd@icolor\pc@hyenc@icolorpdfcommentcolor\pdfmark[DLA]pdfmark=/ANN,Subtype=/Widget,Raw=/TU (Damped Lyman-alpha systems\textCR(\pc@goptd@deadline)) /T (tooltip zref@628) /C [ ] /FT/Btn /F 768 /Ff 65536 /H/N /BS ¡¡ /W 0 ¿¿ s are all estimated from redshifted \HyColor@XZeroOneThreeFour\pc@goptd@color\pc@hyenc@colorpdfcommentcolor\HyColor@XZeroOneThreeFour\pc@goptd@fontcolor\pc@hyenc@fontcolorpdfcommentcolor\HyColor@XZeroOneThreeFour\pc@goptd@icolor\pc@hyenc@icolorpdfcommentcolor\pdfmark[UV]pdfmark=/ANN,Subtype=/Widget,Raw=/TU (Ultraviolet\textCR(\pc@goptd@deadline)) /T (tooltip zref@629) /C [ ] /FT/Btn /F 768 /Ff 65536 /H/N /BS ¡¡ /W 0 ¿¿ absorption lines (Section 6.3). These sources show an almost perfectly linear trend down to . Their dust-to-metal mass ratio varies by only a factor of over the whole metallicity range.
9.3.3 Models of Global Dust Evolution
It is possible to model the dust evolution of a galaxy, over cosmic time, by accounting for the balance between the production and destruction mechanisms. This approach was initiated by Dwek & Scalo (1980), who included grain processing in gas enrichment models. The main physical ingredients are the following. (1) The star formation history of the galaxy is the driving mechanism. It can be parameterized, with different time-scales, episodic bursts or can be regulated by the inflow and outflow rates. (2) At a given time, different stellar populations are born (\HyColor@XZeroOneThreeFour\pc@goptd@color\pc@hyenc@colorpdfcommentcolor\HyColor@XZeroOneThreeFour\pc@goptd@fontcolor\pc@hyenc@fontcolorpdfcommentcolor\HyColor@XZeroOneThreeFour\pc@goptd@icolor\pc@hyenc@icolorpdfcommentcolor\pdfmark[IMF]pdfmark=/ANN,Subtype=/Widget,Raw=/TU (Initial mass function\textCR(\pc@goptd@deadline)) /T (tooltip zref@630) /C [ ] /FT/Btn /F 768 /Ff 65536 /H/N /BS ¡¡ /W 0 ¿¿ dependent), they destroy a fraction of the dust by astration. (3) At the end of their lifetime, stars inject newly formed heavy elements and dust in the \HyColor@XZeroOneThreeFour\pc@goptd@color\pc@hyenc@colorpdfcommentcolor\HyColor@XZeroOneThreeFour\pc@goptd@fontcolor\pc@hyenc@fontcolorpdfcommentcolor\HyColor@XZeroOneThreeFour\pc@goptd@icolor\pc@hyenc@icolorpdfcommentcolor\pdfmark[ISM]pdfmark=/ANN,Subtype=/Widget,Raw=/TU (Interstellar medium\textCR(\pc@goptd@deadline)) /T (tooltip zref@631) /C [ ] /FT/Btn /F 768 /Ff 65536 /H/N /BS ¡¡ /W 0 ¿¿ . The stellar yields of core-collapse \HyColor@XZeroOneThreeFour\pc@goptd@color\pc@hyenc@colorpdfcommentcolor\HyColor@XZeroOneThreeFour\pc@goptd@fontcolor\pc@hyenc@fontcolorpdfcommentcolor\HyColor@XZeroOneThreeFour\pc@goptd@icolor\pc@hyenc@icolorpdfcommentcolor\pdfmark[SN]pdfmark=/ANN,Subtype=/Widget,Raw=/TU (Supernova\textCR(\pc@goptd@deadline)) /T (tooltip zref@632) /C [ ] /FT/Btn /F 768 /Ff 65536 /H/N /BS ¡¡ /W 0 ¿¿ e and \HyColor@XZeroOneThreeFour\pc@goptd@color\pc@hyenc@colorpdfcommentcolor\HyColor@XZeroOneThreeFour\pc@goptd@fontcolor\pc@hyenc@fontcolorpdfcommentcolor\HyColor@XZeroOneThreeFour\pc@goptd@icolor\pc@hyenc@icolorpdfcommentcolor\pdfmark[AGB]pdfmark=/ANN,Subtype=/Widget,Raw=/TU (Asymptotic giant branch\textCR(\pc@goptd@deadline)) /T (tooltip zref@633) /C [ ] /FT/Btn /F 768 /Ff 65536 /H/N /BS ¡¡ /W 0 ¿¿ stars are however quite uncertain (see the discussion in Matsuura et al., 2015). (4) Grains grow in the \HyColor@XZeroOneThreeFour\pc@goptd@color\pc@hyenc@colorpdfcommentcolor\HyColor@XZeroOneThreeFour\pc@goptd@fontcolor\pc@hyenc@fontcolorpdfcommentcolor\HyColor@XZeroOneThreeFour\pc@goptd@icolor\pc@hyenc@icolorpdfcommentcolor\pdfmark[ISM]pdfmark=/ANN,Subtype=/Widget,Raw=/TU (Interstellar medium\textCR(\pc@goptd@deadline)) /T (tooltip zref@634) /C [ ] /FT/Btn /F 768 /Ff 65536 /H/N /BS ¡¡ /W 0 ¿¿ , by accretion. However, the associated sticking coefficients are uncertain. (5) Finally, as massive stars die, dust is destroyed by their \HyColor@XZeroOneThreeFour\pc@goptd@color\pc@hyenc@colorpdfcommentcolor\HyColor@XZeroOneThreeFour\pc@goptd@fontcolor\pc@hyenc@fontcolorpdfcommentcolor\HyColor@XZeroOneThreeFour\pc@goptd@icolor\pc@hyenc@icolorpdfcommentcolor\pdfmark[SN]pdfmark=/ANN,Subtype=/Widget,Raw=/TU (Supernova\textCR(\pc@goptd@deadline)) /T (tooltip zref@635) /C [ ] /FT/Btn /F 768 /Ff 65536 /H/N /BS ¡¡ /W 0 ¿¿ -triggered shock waves, whose efficiency is also uncertain (cf. Section 9.2.3). Most studies develop one-zone models. The evolution of the size distribution can be tracked (e.g. Hirashita, 2015).
Despite the noted uncertainty in the efficiency of the individual processes, these models provide consistent trends of dust-to-gas ratio with metallicity, which enlighten the observations discussed in Section 9.3.2. We display the area covered by different dust evolution tracks in Figure 9-a. These tracks correspond to different star formation histories. We can see that they describe remarkably the nearby galaxy distribution. They can be characterized by the three following regimes. (1) At low-\HyColor@XZeroOneThreeFour\pc@goptd@color\pc@hyenc@colorpdfcommentcolor\HyColor@XZeroOneThreeFour\pc@goptd@fontcolor\pc@hyenc@fontcolorpdfcommentcolor\HyColor@XZeroOneThreeFour\pc@goptd@icolor\pc@hyenc@icolorpdfcommentcolor\pdfmark[]pdfmark=/ANN,Subtype=/Widget,Raw=/TU (Metallicity\textCR(\pc@goptd@deadline)) /T (tooltip zref@636) /C [ ] /FT/Btn /F 768 /Ff 65536 /H/N /BS ¡¡ /W 0 ¿¿ , the grains are mainly condensed in stellar ejecta, the dust-to-gas ratio is proportional to metallicity, but with a low dust-to-metal ratio. (2) At intermediate metallicities, grain growth in the \HyColor@XZeroOneThreeFour\pc@goptd@color\pc@hyenc@colorpdfcommentcolor\HyColor@XZeroOneThreeFour\pc@goptd@fontcolor\pc@hyenc@fontcolorpdfcommentcolor\HyColor@XZeroOneThreeFour\pc@goptd@icolor\pc@hyenc@icolorpdfcommentcolor\pdfmark[ISM]pdfmark=/ANN,Subtype=/Widget,Raw=/TU (Interstellar medium\textCR(\pc@goptd@deadline)) /T (tooltip zref@637) /C [ ] /FT/Btn /F 768 /Ff 65536 /H/N /BS ¡¡ /W 0 ¿¿ starts to become important, as there are more heavy elements to be accreted. The overall dust production efficiency increases. (3) At metallicity close to solar, we reach a linear regime, dominated by grain growth. The nearby galaxy trend in Figure 9-a therefore suggests that grain growth is a crucial process (see also Section 9.2.3). The scatter among the different objects can be explained by different star formation histories. On the contrary, the \HyColor@XZeroOneThreeFour\pc@goptd@color\pc@hyenc@colorpdfcommentcolor\HyColor@XZeroOneThreeFour\pc@goptd@fontcolor\pc@hyenc@fontcolorpdfcommentcolor\HyColor@XZeroOneThreeFour\pc@goptd@icolor\pc@hyenc@icolorpdfcommentcolor\pdfmark[DLA]pdfmark=/ANN,Subtype=/Widget,Raw=/TU (Damped Lyman-alpha systems\textCR(\pc@goptd@deadline)) /T (tooltip zref@638) /C [ ] /FT/Btn /F 768 /Ff 65536 /H/N /BS ¡¡ /W 0 ¿¿ trend does not seem to agree with the displayed dust evolution models. This disagreement is currently debated. It might be due to the particular history of these systems. For example, it is possible to have a quasi-linear trend, down to low-\HyColor@XZeroOneThreeFour\pc@goptd@color\pc@hyenc@colorpdfcommentcolor\HyColor@XZeroOneThreeFour\pc@goptd@fontcolor\pc@hyenc@fontcolorpdfcommentcolor\HyColor@XZeroOneThreeFour\pc@goptd@icolor\pc@hyenc@icolorpdfcommentcolor\pdfmark[]pdfmark=/ANN,Subtype=/Widget,Raw=/TU (Metallicity\textCR(\pc@goptd@deadline)) /T (tooltip zref@639) /C [ ] /FT/Btn /F 768 /Ff 65536 /H/N /BS ¡¡ /W 0 ¿¿ , with an episodic star formation history (Zhukovska, 2014).
9.3.4 The Aromatic Feature Strength Evolution with Metallicity
The \HyColor@XZeroOneThreeFour\pc@goptd@color\pc@hyenc@colorpdfcommentcolor\HyColor@XZeroOneThreeFour\pc@goptd@fontcolor\pc@hyenc@fontcolorpdfcommentcolor\HyColor@XZeroOneThreeFour\pc@goptd@icolor\pc@hyenc@icolorpdfcommentcolor\pdfmark[UIB]pdfmark=/ANN,Subtype=/Widget,Raw=/TU (Unidentified infrared band\textCR(\pc@goptd@deadline)) /T (tooltip zref@640) /C [ ] /FT/Btn /F 768 /Ff 65536 /H/N /BS ¡¡ /W 0 ¿¿ equivalent width clearly rises with metallicity. It was first demonstrated by Engelbracht et al. (2005), using broadband photometry, and by Madden et al. (2006), with spectroscopic observations. Engelbracht et al. (2005) argued that there were two regimes: a high \HyColor@XZeroOneThreeFour\pc@goptd@color\pc@hyenc@colorpdfcommentcolor\HyColor@XZeroOneThreeFour\pc@goptd@fontcolor\pc@hyenc@fontcolorpdfcommentcolor\HyColor@XZeroOneThreeFour\pc@goptd@icolor\pc@hyenc@icolorpdfcommentcolor\pdfmark[UIB]pdfmark=/ANN,Subtype=/Widget,Raw=/TU (Unidentified infrared band\textCR(\pc@goptd@deadline)) /T (tooltip zref@641) /C [ ] /FT/Btn /F 768 /Ff 65536 /H/N /BS ¡¡ /W 0 ¿¿ fraction above ; and a low value, below. However, Galliano, Dwek & Chanial (2008, hereafter G08a) demonstrated that this was a bias, due to the fact that the continuum dominates the \HyColor@XZeroOneThreeFour\pc@goptd@color\pc@hyenc@colorpdfcommentcolor\HyColor@XZeroOneThreeFour\pc@goptd@fontcolor\pc@hyenc@fontcolorpdfcommentcolor\HyColor@XZeroOneThreeFour\pc@goptd@icolor\pc@hyenc@icolorpdfcommentcolor\pdfmark[MIR]pdfmark=/ANN,Subtype=/Widget,Raw=/TU (Mid-infrared\textCR(\pc@goptd@deadline)) /T (tooltip zref@642) /C [ ] /FT/Btn /F 768 /Ff 65536 /H/N /BS ¡¡ /W 0 ¿¿ broadbands when the \HyColor@XZeroOneThreeFour\pc@goptd@color\pc@hyenc@colorpdfcommentcolor\HyColor@XZeroOneThreeFour\pc@goptd@fontcolor\pc@hyenc@fontcolorpdfcommentcolor\HyColor@XZeroOneThreeFour\pc@goptd@icolor\pc@hyenc@icolorpdfcommentcolor\pdfmark[UIB]pdfmark=/ANN,Subtype=/Widget,Raw=/TU (Unidentified infrared band\textCR(\pc@goptd@deadline)) /T (tooltip zref@643) /C [ ] /FT/Btn /F 768 /Ff 65536 /H/N /BS ¡¡ /W 0 ¿¿ strength becomes weak. Trends constrained with spectroscopy appear rather smooth, although there is significant scatter (Figure 9-b). It was rapidly proposed that the origin of this phenomenon was the enhanced destruction of the \HyColor@XZeroOneThreeFour\pc@goptd@color\pc@hyenc@colorpdfcommentcolor\HyColor@XZeroOneThreeFour\pc@goptd@fontcolor\pc@hyenc@fontcolorpdfcommentcolor\HyColor@XZeroOneThreeFour\pc@goptd@icolor\pc@hyenc@icolorpdfcommentcolor\pdfmark[UIB]pdfmark=/ANN,Subtype=/Widget,Raw=/TU (Unidentified infrared band\textCR(\pc@goptd@deadline)) /T (tooltip zref@644) /C [ ] /FT/Btn /F 768 /Ff 65536 /H/N /BS ¡¡ /W 0 ¿¿ carriers in the \HyColor@XZeroOneThreeFour\pc@goptd@color\pc@hyenc@colorpdfcommentcolor\HyColor@XZeroOneThreeFour\pc@goptd@fontcolor\pc@hyenc@fontcolorpdfcommentcolor\HyColor@XZeroOneThreeFour\pc@goptd@icolor\pc@hyenc@icolorpdfcommentcolor\pdfmark[UV]pdfmark=/ANN,Subtype=/Widget,Raw=/TU (Ultraviolet\textCR(\pc@goptd@deadline)) /T (tooltip zref@645) /C [ ] /FT/Btn /F 768 /Ff 65536 /H/N /BS ¡¡ /W 0 ¿¿ permeated \HyColor@XZeroOneThreeFour\pc@goptd@color\pc@hyenc@colorpdfcommentcolor\HyColor@XZeroOneThreeFour\pc@goptd@fontcolor\pc@hyenc@fontcolorpdfcommentcolor\HyColor@XZeroOneThreeFour\pc@goptd@icolor\pc@hyenc@icolorpdfcommentcolor\pdfmark[ISM]pdfmark=/ANN,Subtype=/Widget,Raw=/TU (Interstellar medium\textCR(\pc@goptd@deadline)) /T (tooltip zref@646) /C [ ] /FT/Btn /F 768 /Ff 65536 /H/N /BS ¡¡ /W 0 ¿¿ of dwarf galaxies (cf. Section 9.2.3.1), illustrating again the degeneracy between star formation activity and metallicity (cf. Section 9.1). Indeed, the \HyColor@XZeroOneThreeFour\pc@goptd@color\pc@hyenc@colorpdfcommentcolor\HyColor@XZeroOneThreeFour\pc@goptd@fontcolor\pc@hyenc@fontcolorpdfcommentcolor\HyColor@XZeroOneThreeFour\pc@goptd@icolor\pc@hyenc@icolorpdfcommentcolor\pdfmark[UIB]pdfmark=/ANN,Subtype=/Widget,Raw=/TU (Unidentified infrared band\textCR(\pc@goptd@deadline)) /T (tooltip zref@647) /C [ ] /FT/Btn /F 768 /Ff 65536 /H/N /BS ¡¡ /W 0 ¿¿ strength appears slightly better correlated with tracers of the \HyColor@XZeroOneThreeFour\pc@goptd@color\pc@hyenc@colorpdfcommentcolor\HyColor@XZeroOneThreeFour\pc@goptd@fontcolor\pc@hyenc@fontcolorpdfcommentcolor\HyColor@XZeroOneThreeFour\pc@goptd@icolor\pc@hyenc@icolorpdfcommentcolor\pdfmark[ISRF]pdfmark=/ANN,Subtype=/Widget,Raw=/TU (Interstellar radiation field\textCR(\pc@goptd@deadline)) /T (tooltip zref@648) /C [ ] /FT/Btn /F 768 /Ff 65536 /H/N /BS ¡¡ /W 0 ¿¿ hardness than with metallicity (e.g. Gordon et al., 2008; Wu, Hogg & Moustakas, 2011).
@goptd@color\pc@hyenc@colorpdfcommentcolor\HyColor@XZeroOneThreeFour\pc@goptd@fontcolor\pc@hyenc@fontcolorpdfcommentcolor\HyColor@XZeroOneThreeFour\pc@goptd@icolor\pc@hyenc@icolorpdfcommentcolor\pdfmark[UIB]pdfmark=/ANN,Subtype=/Widget,Raw=/TU (Unidentified infrared band\textCR(\pc@goptd@deadline)) /T (tooltip zref@649) /C [ ] /FT/Btn /F 768 /Ff 65536 /H/N /BS ¡¡ /W 0 ¿¿ carrier destruction is indubitably an important process in low-\HyColor@XZeroOneThreeFour\pc@goptd@color\pc@hyenc@colorpdfcommentcolor\HyColor@XZeroOneThreeFour\pc@goptd@fontcolor\pc@hyenc@fontcolorpdfcommentcolor\HyColor@XZeroOneThreeFour\pc@goptd@icolor\pc@hyenc@icolorpdfcommentcolor\pdfmark[]pdfmark=/ANN,Subtype=/Widget,Raw=/TU (Metallicity\textCR(\pc@goptd@deadline)) /T (tooltip zref@650) /C [ ] /FT/Btn /F 768 /Ff 65536 /H/N /BS ¡¡ /W 0 ¿¿ systems, but it does not exclude the possible deficiency of their formation. G08a hypothesized that the \HyColor@XZeroOneThreeFour\pc@goptd@color\pc@hyenc@colorpdfcommentcolor\HyColor@XZeroOneThreeFour\pc@goptd@fontcolor\pc@hyenc@fontcolorpdfcommentcolor\HyColor@XZeroOneThreeFour\pc@goptd@icolor\pc@hyenc@icolorpdfcommentcolor\pdfmark[UIB]pdfmark=/ANN,Subtype=/Widget,Raw=/TU (Unidentified infrared band\textCR(\pc@goptd@deadline)) /T (tooltip zref@651) /C [ ] /FT/Btn /F 768 /Ff 65536 /H/N /BS ¡¡ /W 0 ¿¿ carriers could be mostly produced by the long-lived \HyColor@XZeroOneThreeFour\pc@goptd@color\pc@hyenc@colorpdfcommentcolor\HyColor@XZeroOneThreeFour\pc@goptd@fontcolor\pc@hyenc@fontcolorpdfcommentcolor\HyColor@XZeroOneThreeFour\pc@goptd@icolor\pc@hyenc@icolorpdfcommentcolor\pdfmark[AGB]pdfmark=/ANN,Subtype=/Widget,Raw=/TU (Asymptotic giant branch\textCR(\pc@goptd@deadline)) /T (tooltip zref@652) /C [ ] /FT/Btn /F 768 /Ff 65536 /H/N /BS ¡¡ /W 0 ¿¿ stars. This delayed injection mechanism could explain the trend (tracks on Figure 9-b). However, as we have seen in Section 9.2.3, the \HyColor@XZeroOneThreeFour\pc@goptd@color\pc@hyenc@colorpdfcommentcolor\HyColor@XZeroOneThreeFour\pc@goptd@fontcolor\pc@hyenc@fontcolorpdfcommentcolor\HyColor@XZeroOneThreeFour\pc@goptd@icolor\pc@hyenc@icolorpdfcommentcolor\pdfmark[UIB]pdfmark=/ANN,Subtype=/Widget,Raw=/TU (Unidentified infrared band\textCR(\pc@goptd@deadline)) /T (tooltip zref@653) /C [ ] /FT/Btn /F 768 /Ff 65536 /H/N /BS ¡¡ /W 0 ¿¿ carriers are very volatile and need to reform in the \HyColor@XZeroOneThreeFour\pc@goptd@color\pc@hyenc@colorpdfcommentcolor\HyColor@XZeroOneThreeFour\pc@goptd@fontcolor\pc@hyenc@fontcolorpdfcommentcolor\HyColor@XZeroOneThreeFour\pc@goptd@icolor\pc@hyenc@icolorpdfcommentcolor\pdfmark[ISM]pdfmark=/ANN,Subtype=/Widget,Raw=/TU (Interstellar medium\textCR(\pc@goptd@deadline)) /T (tooltip zref@654) /C [ ] /FT/Btn /F 768 /Ff 65536 /H/N /BS ¡¡ /W 0 ¿¿ . Alternatively, Seok, Hirashita & Asano (2014) showed that a dust evolution model in which \HyColor@XZeroOneThreeFour\pc@goptd@color\pc@hyenc@colorpdfcommentcolor\HyColor@XZeroOneThreeFour\pc@goptd@fontcolor\pc@hyenc@fontcolorpdfcommentcolor\HyColor@XZeroOneThreeFour\pc@goptd@icolor\pc@hyenc@icolorpdfcommentcolor\pdfmark[PAH]pdfmark=/ANN,Subtype=/Widget,Raw=/TU (Polycyclic aromatic hydrocarbon\textCR(\pc@goptd@deadline)) /T (tooltip zref@655) /C [ ] /FT/Btn /F 768 /Ff 65536 /H/N /BS ¡¡ /W 0 ¿¿ s are formed by fragmentation of large carbonaceous grains can explain the observed PAH trend. Observationally, Sandstrom et al. (2010), modelling the \HyColor@XZeroOneThreeFour\pc@goptd@color\pc@hyenc@colorpdfcommentcolor\HyColor@XZeroOneThreeFour\pc@goptd@fontcolor\pc@hyenc@fontcolorpdfcommentcolor\HyColor@XZeroOneThreeFour\pc@goptd@icolor\pc@hyenc@icolorpdfcommentcolor\pdfmark[MIR]pdfmark=/ANN,Subtype=/Widget,Raw=/TU (Mid-infrared\textCR(\pc@goptd@deadline)) /T (tooltip zref@656) /C [ ] /FT/Btn /F 768 /Ff 65536 /H/N /BS ¡¡ /W 0 ¿¿ spectra of several regions in the \HyColor@XZeroOneThreeFour\pc@goptd@color\pc@hyenc@colorpdfcommentcolor\HyColor@XZeroOneThreeFour\pc@goptd@fontcolor\pc@hyenc@fontcolorpdfcommentcolor\HyColor@XZeroOneThreeFour\pc@goptd@icolor\pc@hyenc@icolorpdfcommentcolor\pdfmark[SMC]pdfmark=/ANN,Subtype=/Widget,Raw=/TU (Small Magellanic cloud\textCR(\pc@goptd@deadline)) /T (tooltip zref@657) /C [ ] /FT/Btn /F 768 /Ff 65536 /H/N /BS ¡¡ /W 0 ¿¿ , found that the \HyColor@XZeroOneThreeFour\pc@goptd@color\pc@hyenc@colorpdfcommentcolor\HyColor@XZeroOneThreeFour\pc@goptd@fontcolor\pc@hyenc@fontcolorpdfcommentcolor\HyColor@XZeroOneThreeFour\pc@goptd@icolor\pc@hyenc@icolorpdfcommentcolor\pdfmark[PAH]pdfmark=/ANN,Subtype=/Widget,Raw=/TU (Polycyclic aromatic hydrocarbon\textCR(\pc@goptd@deadline)) /T (tooltip zref@658) /C [ ] /FT/Btn /F 768 /Ff 65536 /H/N /BS ¡¡ /W 0 ¿¿ mass fraction correlates better with the molecular gas. They proposed that \HyColor@XZeroOneThreeFour\pc@goptd@color\pc@hyenc@colorpdfcommentcolor\HyColor@XZeroOneThreeFour\pc@goptd@fontcolor\pc@hyenc@fontcolorpdfcommentcolor\HyColor@XZeroOneThreeFour\pc@goptd@icolor\pc@hyenc@icolorpdfcommentcolor\pdfmark[PAH]pdfmark=/ANN,Subtype=/Widget,Raw=/TU (Polycyclic aromatic hydrocarbon\textCR(\pc@goptd@deadline)) /T (tooltip zref@659) /C [ ] /FT/Btn /F 768 /Ff 65536 /H/N /BS ¡¡ /W 0 ¿¿ s could form in molecular clouds. The trend with metallicity would then result from the lower filling factor of the molecular gas at low-\HyColor@XZeroOneThreeFour\pc@goptd@color\pc@hyenc@colorpdfcommentcolor\HyColor@XZeroOneThreeFour\pc@goptd@fontcolor\pc@hyenc@fontcolorpdfcommentcolor\HyColor@XZeroOneThreeFour\pc@goptd@icolor\pc@hyenc@icolorpdfcommentcolor\pdfmark[]pdfmark=/ANN,Subtype=/Widget,Raw=/TU (Metallicity\textCR(\pc@goptd@deadline)) /T (tooltip zref@660) /C [ ] /FT/Btn /F 768 /Ff 65536 /H/N /BS ¡¡ /W 0 ¿¿ . This interesting scenario is probably not complete, as the \HyColor@XZeroOneThreeFour\pc@goptd@color\pc@hyenc@colorpdfcommentcolor\HyColor@XZeroOneThreeFour\pc@goptd@fontcolor\pc@hyenc@fontcolorpdfcommentcolor\HyColor@XZeroOneThreeFour\pc@goptd@icolor\pc@hyenc@icolorpdfcommentcolor\pdfmark[PAH]pdfmark=/ANN,Subtype=/Widget,Raw=/TU (Polycyclic aromatic hydrocarbon\textCR(\pc@goptd@deadline)) /T (tooltip zref@661) /C [ ] /FT/Btn /F 768 /Ff 65536 /H/N /BS ¡¡ /W 0 ¿¿ fractions they find in shielded regions are still a factor of lower than in the \HyColor@XZeroOneThreeFour\pc@goptd@color\pc@hyenc@colorpdfcommentcolor\HyColor@XZeroOneThreeFour\pc@goptd@fontcolor\pc@hyenc@fontcolorpdfcommentcolor\HyColor@XZeroOneThreeFour\pc@goptd@icolor\pc@hyenc@icolorpdfcommentcolor\pdfmark[MW]pdfmark=/ANN,Subtype=/Widget,Raw=/TU (Milky Way\textCR(\pc@goptd@deadline)) /T (tooltip zref@662) /C [ ] /FT/Btn /F 768 /Ff 65536 /H/N /BS ¡¡ /W 0 ¿¿ . This is not surprising as the C/O ratio is about twice lower in the \HyColor@XZeroOneThreeFour\pc@goptd@color\pc@hyenc@colorpdfcommentcolor\HyColor@XZeroOneThreeFour\pc@goptd@fontcolor\pc@hyenc@fontcolorpdfcommentcolor\HyColor@XZeroOneThreeFour\pc@goptd@icolor\pc@hyenc@icolorpdfcommentcolor\pdfmark[SMC]pdfmark=/ANN,Subtype=/Widget,Raw=/TU (Small Magellanic cloud\textCR(\pc@goptd@deadline)) /T (tooltip zref@663) /C [ ] /FT/Btn /F 768 /Ff 65536 /H/N /BS ¡¡ /W 0 ¿¿ (Table 2). There is no simple answer to this open question, but it appears that to explain the paucity of \HyColor@XZeroOneThreeFour\pc@goptd@color\pc@hyenc@colorpdfcommentcolor\HyColor@XZeroOneThreeFour\pc@goptd@fontcolor\pc@hyenc@fontcolorpdfcommentcolor\HyColor@XZeroOneThreeFour\pc@goptd@icolor\pc@hyenc@icolorpdfcommentcolor\pdfmark[UIB]pdfmark=/ANN,Subtype=/Widget,Raw=/TU (Unidentified infrared band\textCR(\pc@goptd@deadline)) /T (tooltip zref@664) /C [ ] /FT/Btn /F 768 /Ff 65536 /H/N /BS ¡¡ /W 0 ¿¿ s in low-\HyColor@XZeroOneThreeFour\pc@goptd@color\pc@hyenc@colorpdfcommentcolor\HyColor@XZeroOneThreeFour\pc@goptd@fontcolor\pc@hyenc@fontcolorpdfcommentcolor\HyColor@XZeroOneThreeFour\pc@goptd@icolor\pc@hyenc@icolorpdfcommentcolor\pdfmark[]pdfmark=/ANN,Subtype=/Widget,Raw=/TU (Metallicity\textCR(\pc@goptd@deadline)) /T (tooltip zref@665) /C [ ] /FT/Btn /F 768 /Ff 65536 /H/N /BS ¡¡ /W 0 ¿¿ environments, one needs to articulate their photodestruction with the deficiency of their formation process.
[FUTURE CHALLENGES]
-
1.
Current dust models do not provide a parameterization of the grain mixture constitution as a function of the physical conditions. As we have discussed, local evolution processes, like the photodestruction of small grains or the mantle growth and evaporation, bias our interpretations, when using models with a fixed constitution. Working towards being able to predict, even in a simplified way, the grain properties for an arbitray gas density and \HyColor@XZeroOneThreeFour\pc@goptd@color\pc@hyenc@colorpdfcommentcolor\HyColor@XZeroOneThreeFour\pc@goptd@fontcolor\pc@hyenc@fontcolorpdfcommentcolor\HyColor@XZeroOneThreeFour\pc@goptd@icolor\pc@hyenc@icolorpdfcommentcolor\pdfmark[ISRF]pdfmark=/ANN,Subtype=/Widget,Raw=/TU (Interstellar radiation field\textCR(\pc@goptd@deadline)) /T (tooltip zref@666) /C [ ] /FT/Btn /F 768 /Ff 65536 /H/N /BS ¡¡ /W 0 ¿¿ intensity, is necessary to interpret the already existing observations.
-
2.
We are now at a time where nearby galaxies have been observed in detail, over the whole electromagnetic spectrum. We are thus compelled to think beyond integrated broadband fluxes to go on progressing.
- Spatially resolved studies
-
() are possible in the \HyColor@XZeroOneThreeFour\pc@goptd@color\pc@hyenc@colorpdfcommentcolor\HyColor@XZeroOneThreeFour\pc@goptd@fontcolor\pc@hyenc@fontcolorpdfcommentcolor\HyColor@XZeroOneThreeFour\pc@goptd@icolor\pc@hyenc@icolorpdfcommentcolor\pdfmark[MIR]pdfmark=/ANN,Subtype=/Widget,Raw=/TU (Mid-infrared\textCR(\pc@goptd@deadline)) /T (tooltip zref@667) /C [ ] /FT/Btn /F 768 /Ff 65536 /H/N /BS ¡¡ /W 0 ¿¿ , with \HyColor@XZeroOneThreeFour\pc@goptd@color\pc@hyenc@colorpdfcommentcolor\HyColor@XZeroOneThreeFour\pc@goptd@fontcolor\pc@hyenc@fontcolorpdfcommentcolor\HyColor@XZeroOneThreeFour\pc@goptd@icolor\pc@hyenc@icolorpdfcommentcolor\pdfmark[JWST]pdfmark=/ANN,Subtype=/Widget,Raw=/TU (James Webb Space Telescope (0.6-27 microns; 2018-)\textCR(\pc@goptd@deadline)) /T (tooltip zref@668) /C [ ] /FT/Btn /F 768 /Ff 65536 /H/N /BS ¡¡ /W 0 ¿¿ , and in the \HyColor@XZeroOneThreeFour\pc@goptd@color\pc@hyenc@colorpdfcommentcolor\HyColor@XZeroOneThreeFour\pc@goptd@fontcolor\pc@hyenc@fontcolorpdfcommentcolor\HyColor@XZeroOneThreeFour\pc@goptd@icolor\pc@hyenc@icolorpdfcommentcolor\pdfmark[submm]pdfmark=/ANN,Subtype=/Widget,Raw=/TU (Submillimeter\textCR(\pc@goptd@deadline)) /T (tooltip zref@669) /C [ ] /FT/Btn /F 768 /Ff 65536 /H/N /BS ¡¡ /W 0 ¿¿ , with \HyColor@XZeroOneThreeFour\pc@goptd@color\pc@hyenc@colorpdfcommentcolor\HyColor@XZeroOneThreeFour\pc@goptd@fontcolor\pc@hyenc@fontcolorpdfcommentcolor\HyColor@XZeroOneThreeFour\pc@goptd@icolor\pc@hyenc@icolorpdfcommentcolor\pdfmark[ALMA]pdfmark=/ANN,Subtype=/Widget,Raw=/TU (Atacama large millimeter array (300 microns-1 cm; 2011)\textCR(\pc@goptd@deadline)) /T (tooltip zref@670) /C [ ] /FT/Btn /F 768 /Ff 65536 /H/N /BS ¡¡ /W 0 ¿¿ . These could help resolve the dust heating in dense extragalactic \HyColor@XZeroOneThreeFour\pc@goptd@color\pc@hyenc@colorpdfcommentcolor\HyColor@XZeroOneThreeFour\pc@goptd@fontcolor\pc@hyenc@fontcolorpdfcommentcolor\HyColor@XZeroOneThreeFour\pc@goptd@icolor\pc@hyenc@icolorpdfcommentcolor\pdfmark[PDR]pdfmark=/ANN,Subtype=/Widget,Raw=/TU (Photodissociation region\textCR(\pc@goptd@deadline)) /T (tooltip zref@671) /C [ ] /FT/Btn /F 768 /Ff 65536 /H/N /BS ¡¡ /W 0 ¿¿ s (Equation 1) and thus provide constraints on the dust properties in high \HyColor@XZeroOneThreeFour\pc@goptd@color\pc@hyenc@colorpdfcommentcolor\HyColor@XZeroOneThreeFour\pc@goptd@fontcolor\pc@hyenc@fontcolorpdfcommentcolor\HyColor@XZeroOneThreeFour\pc@goptd@icolor\pc@hyenc@icolorpdfcommentcolor\pdfmark[ISRF]pdfmark=/ANN,Subtype=/Widget,Raw=/TU (Interstellar radiation field\textCR(\pc@goptd@deadline)) /T (tooltip zref@672) /C [ ] /FT/Btn /F 768 /Ff 65536 /H/N /BS ¡¡ /W 0 ¿¿ conditions.
- FIR spectroscopy
-
(\HyColor@XZeroOneThreeFour\pc@goptd@color\pc@hyenc@colorpdfcommentcolor\HyColor@XZeroOneThreeFour\pc@goptd@fontcolor\pc@hyenc@fontcolorpdfcommentcolor\HyColor@XZeroOneThreeFour\pc@goptd@icolor\pc@hyenc@icolorpdfcommentcolor\pdfmark[SPICA]pdfmark=/ANN,Subtype=/Widget,Raw=/TU (MIR–FIR space telescope (12−210 microns; launch in 2025)\textCR(\pc@goptd@deadline)) /T (tooltip zref@673) /C [ ] /FT/Btn /F 768 /Ff 65536 /H/N /BS ¡¡ /W 0 ¿¿ ) would be valuable for: (1) better constraining the shape of the \HyColor@XZeroOneThreeFour\pc@goptd@color\pc@hyenc@colorpdfcommentcolor\HyColor@XZeroOneThreeFour\pc@goptd@fontcolor\pc@hyenc@fontcolorpdfcommentcolor\HyColor@XZeroOneThreeFour\pc@goptd@icolor\pc@hyenc@icolorpdfcommentcolor\pdfmark[SED]pdfmark=/ANN,Subtype=/Widget,Raw=/TU (Spectral energy distribution\textCR(\pc@goptd@deadline)) /T (tooltip zref@674) /C [ ] /FT/Btn /F 768 /Ff 65536 /H/N /BS ¡¡ /W 0 ¿¿ ; and (2) identifying new solid state features.
- Multi-process studies
-
are the key to solving the degeneracies inherent to dust models. \HyColor@XZeroOneThreeFour\pc@goptd@color\pc@hyenc@colorpdfcommentcolor\HyColor@XZeroOneThreeFour\pc@goptd@fontcolor\pc@hyenc@fontcolorpdfcommentcolor\HyColor@XZeroOneThreeFour\pc@goptd@icolor\pc@hyenc@icolorpdfcommentcolor\pdfmark[LUVOIR]pdfmark=/ANN,Subtype=/Widget,Raw=/TU (UV-NIR space telescope (in preparation)\textCR(\pc@goptd@deadline)) /T (tooltip zref@675) /C [ ] /FT/Btn /F 768 /Ff 65536 /H/N /BS ¡¡ /W 0 ¿¿ could provide valuable constraints on the extinction, depletion, \HyColor@XZeroOneThreeFour\pc@goptd@color\pc@hyenc@colorpdfcommentcolor\HyColor@XZeroOneThreeFour\pc@goptd@fontcolor\pc@hyenc@fontcolorpdfcommentcolor\HyColor@XZeroOneThreeFour\pc@goptd@icolor\pc@hyenc@icolorpdfcommentcolor\pdfmark[DIB]pdfmark=/ANN,Subtype=/Widget,Raw=/TU (Diffuse interstellar band\textCR(\pc@goptd@deadline)) /T (tooltip zref@676) /C [ ] /FT/Btn /F 768 /Ff 65536 /H/N /BS ¡¡ /W 0 ¿¿ s and \HyColor@XZeroOneThreeFour\pc@goptd@color\pc@hyenc@colorpdfcommentcolor\HyColor@XZeroOneThreeFour\pc@goptd@fontcolor\pc@hyenc@fontcolorpdfcommentcolor\HyColor@XZeroOneThreeFour\pc@goptd@icolor\pc@hyenc@icolorpdfcommentcolor\pdfmark[ERE]pdfmark=/ANN,Subtype=/Widget,Raw=/TU (Extended red emission\textCR(\pc@goptd@deadline)) /T (tooltip zref@677) /C [ ] /FT/Btn /F 768 /Ff 65536 /H/N /BS ¡¡ /W 0 ¿¿ of regions or galaxies which have been observed with the previous \HyColor@XZeroOneThreeFour\pc@goptd@color\pc@hyenc@colorpdfcommentcolor\HyColor@XZeroOneThreeFour\pc@goptd@fontcolor\pc@hyenc@fontcolorpdfcommentcolor\HyColor@XZeroOneThreeFour\pc@goptd@icolor\pc@hyenc@icolorpdfcommentcolor\pdfmark[IR]pdfmark=/ANN,Subtype=/Widget,Raw=/TU (Infrared\textCR(\pc@goptd@deadline)) /T (tooltip zref@678) /C [ ] /FT/Btn /F 768 /Ff 65536 /H/N /BS ¡¡ /W 0 ¿¿ –\HyColor@XZeroOneThreeFour\pc@goptd@color\pc@hyenc@colorpdfcommentcolor\HyColor@XZeroOneThreeFour\pc@goptd@fontcolor\pc@hyenc@fontcolorpdfcommentcolor\HyColor@XZeroOneThreeFour\pc@goptd@icolor\pc@hyenc@icolorpdfcommentcolor\pdfmark[submm]pdfmark=/ANN,Subtype=/Widget,Raw=/TU (Submillimeter\textCR(\pc@goptd@deadline)) /T (tooltip zref@679) /C [ ] /FT/Btn /F 768 /Ff 65536 /H/N /BS ¡¡ /W 0 ¿¿ telescopes.
-
3.
The increase in sensitivity of the next generation of instruments will be a challenge for data analysis methods. More precise fluxes will require proper accounts of foreground and background emissions, especially if we are interested in the diffuse \HyColor@XZeroOneThreeFour\pc@goptd@color\pc@hyenc@colorpdfcommentcolor\HyColor@XZeroOneThreeFour\pc@goptd@fontcolor\pc@hyenc@fontcolorpdfcommentcolor\HyColor@XZeroOneThreeFour\pc@goptd@icolor\pc@hyenc@icolorpdfcommentcolor\pdfmark[ISM]pdfmark=/ANN,Subtype=/Widget,Raw=/TU (Interstellar medium\textCR(\pc@goptd@deadline)) /T (tooltip zref@680) /C [ ] /FT/Btn /F 768 /Ff 65536 /H/N /BS ¡¡ /W 0 ¿¿ of galaxies. More complex spatial and spectral decomposition methods, with rigorous treatment of the uncertainties, will be necessary.
JWST\HyColor@XZeroOneThreeFour\pc@goptd@color\pc@hyenc@colorpdfcommentcolor\HyColor@XZeroOneThreeFour\pc@goptd@fontcolor\pc@hyenc@fontcolorpdfcommentcolor\HyColor@XZeroOneThreeFour\pc@goptd@icolor\pc@hyenc@icolorpdfcommentcolor\pdfmark[NIR]pdfmark=/ANN,Subtype=/Widget,Raw=/TU (Near-infrared\textCR(\pc@goptd@deadline)) /T (tooltip zref@681) /C [ ] /FT/Btn /F 768 /Ff 65536 /H/N /BS ¡¡ /W 0 ¿¿ –\HyColor@XZeroOneThreeFour\pc@goptd@color\pc@hyenc@colorpdfcommentcolor\HyColor@XZeroOneThreeFour\pc@goptd@fontcolor\pc@hyenc@fontcolorpdfcommentcolor\HyColor@XZeroOneThreeFour\pc@goptd@icolor\pc@hyenc@icolorpdfcommentcolor\pdfmark[MIR]pdfmark=/ANN,Subtype=/Widget,Raw=/TU (Mid-infrared\textCR(\pc@goptd@deadline)) /T (tooltip zref@682) /C [ ] /FT/Btn /F 768 /Ff 65536 /H/N /BS ¡¡ /W 0 ¿¿ space telescope (; launch in 2019), with sub-arcsec resolution. \entrySPICA\HyColor@XZeroOneThreeFour\pc@goptd@color\pc@hyenc@colorpdfcommentcolor\HyColor@XZeroOneThreeFour\pc@goptd@fontcolor\pc@hyenc@fontcolorpdfcommentcolor\HyColor@XZeroOneThreeFour\pc@goptd@icolor\pc@hyenc@icolorpdfcommentcolor\pdfmark[MIR]pdfmark=/ANN,Subtype=/Widget,Raw=/TU (Mid-infrared\textCR(\pc@goptd@deadline)) /T (tooltip zref@683) /C [ ] /FT/Btn /F 768 /Ff 65536 /H/N /BS ¡¡ /W 0 ¿¿ –\HyColor@XZeroOneThreeFour\pc@goptd@color\pc@hyenc@colorpdfcommentcolor\HyColor@XZeroOneThreeFour\pc@goptd@fontcolor\pc@hyenc@fontcolorpdfcommentcolor\HyColor@XZeroOneThreeFour\pc@goptd@icolor\pc@hyenc@icolorpdfcommentcolor\pdfmark[FIR]pdfmark=/ANN,Subtype=/Widget,Raw=/TU (Far-infrared\textCR(\pc@goptd@deadline)) /T (tooltip zref@684) /C [ ] /FT/Btn /F 768 /Ff 65536 /H/N /BS ¡¡ /W 0 ¿¿ space telescope (; launch in ), with unprecedented sensitivity. \entryLUVOIR\HyColor@XZeroOneThreeFour\pc@goptd@color\pc@hyenc@colorpdfcommentcolor\HyColor@XZeroOneThreeFour\pc@goptd@fontcolor\pc@hyenc@fontcolorpdfcommentcolor\HyColor@XZeroOneThreeFour\pc@goptd@icolor\pc@hyenc@icolorpdfcommentcolor\pdfmark[UV]pdfmark=/ANN,Subtype=/Widget,Raw=/TU (Ultraviolet\textCR(\pc@goptd@deadline)) /T (tooltip zref@685) /C [ ] /FT/Btn /F 768 /Ff 65536 /H/N /BS ¡¡ /W 0 ¿¿ –\HyColor@XZeroOneThreeFour\pc@goptd@color\pc@hyenc@colorpdfcommentcolor\HyColor@XZeroOneThreeFour\pc@goptd@fontcolor\pc@hyenc@fontcolorpdfcommentcolor\HyColor@XZeroOneThreeFour\pc@goptd@icolor\pc@hyenc@icolorpdfcommentcolor\pdfmark[NIR]pdfmark=/ANN,Subtype=/Widget,Raw=/TU (Near-infrared\textCR(\pc@goptd@deadline)) /T (tooltip zref@686) /C [ ] /FT/Btn /F 768 /Ff 65536 /H/N /BS ¡¡ /W 0 ¿¿ space telescope (in preparation).
DISCLOSURE STATEMENT
The authors are not aware of any affiliations, memberships, funding, or financial holdings that might be perceived as affecting the objectivity of this review.
ACKNOWLEDGMENTS
We thank Vincent Guillet for providing us with the polarization model of Figure 1, Ilse De Looze for Figure 2, Timothé Roland and Ronin Wu for the data of Figure 5-a, and Pieter De Vis for the data in Figure 8. We thank Maarten Baes, Diane Cormier, Pieter De Vis, Vincent Guillet, Sacha Hony, Vianney Lebouteiller, Suzanne Madden, Takashi Onaka and Sébastien Viaene, for useful discussions and comments, as well as the scientific editor, Bruce Draine. We acknowledge support from the EU FP7 project DustPedia (Grant No. 606847). F.G. acknowledges support by the Agence Nationale pour la Recherche through the program SYMPATICO (Projet ANR-11-BS56-0023) and the PRC 1311 between CNRS and JSPS. M.G. acknowledges funding from the European Research Council (ERC) under the European Union Horizon 2020 programme (MagneticYSOs project, grant No 679937).
References
- Allamandola, Tielens & Barker (1985) Allamandola LJ, Tielens AGGM, Barker JR. 1985. ApJ 290:L25–L28
- Aloisi et al. (2003) Aloisi A, Savaglio S, Heckman TM, Hoopes CG, Leitherer C, Sembach KR. 2003. ApJ 595:760–778
- Alton et al. (1994) Alton PB, Draper PW, Gledhill TM, Stockdale DP, Scarrott SM, Wolstencroft RD. 1994. MNRAS 270:238
- Alton et al. (1998) Alton PB, Trewhella M, Davies JI, Evans R, Bianchi S, et al. 1998. A&A 335:807–822
- Alton et al. (2000) Alton PB, Xilouris EM, Bianchi S, Davies J, Kylafis N. 2000. A&A 356:795–807
- Alton et al. (2004) Alton PB, Xilouris EM, Misiriotis A, Dasyra KM, Dumke M. 2004. A&A 425:109–120
- Amanullah et al. (2014) Amanullah R, Goobar A, Johansson J, Banerjee DPK, Venkataraman V, et al. 2014. ApJ 788:L21
- Aniano et al. (2012) Aniano G, Draine BT, Calzetti D, Dale DA, Engelbracht CW, et al. 2012. ApJ 756:138
- Antonucci (1993) Antonucci R. 1993. ARA&A 31:473–521
- Antonucci & Miller (1985) Antonucci RRJ, Miller JS. 1985. ApJ 297:621–632
- Arab et al. (2012) Arab H, Abergel A, Habart E, Bernard-Salas J, Ayasso H, et al. 2012. A&A 541:A19
- Asano et al. (2013) Asano RS, Takeuchi TT, Hirashita H, Inoue AK. 2013. Earth, Planets, and Space 65:213–222
- Baes et al. (2003) Baes M, Davies JI, Dejonghe H, Sabatini S, Roberts S, et al. 2003. MNRAS 343:1081–1094
- Baes et al. (2010) Baes M, Fritz J, Gadotti DA, Smith DJB, Dunne L, et al. 2010. A&A 518:L39
- Bailey et al. (2015) Bailey M, van Loon JT, Sarre PJ, Beckman JE. 2015. MNRAS 454:4013–4026
- Battisti, Calzetti & Chary (2016) Battisti AJ, Calzetti D, Chary RR. 2016. ApJ 818:13
- Beirão et al. (2015) Beirão P, Armus L, Lehnert MD, Guillard P, Heckman T, et al. 2015. MNRAS 451:2640–2655
- Beirão et al. (2006) Beirão P, Brandl BR, Devost D, Smith JD, Hao L, Houck JR. 2006. ApJ 643:L1–L4
- Bendo et al. (2012) Bendo GJ, Boselli A, Dariush A, Pohlen M, Roussel H, et al. 2012. MNRAS 419:1833–1859
- Bendo et al. (2006) Bendo GJ, Dale DA, Draine BT, Engelbracht CW, Kennicutt Jr. RC, et al. 2006. ApJ 652:283–305
- Bendo et al. (2008) Bendo GJ, Draine BT, Engelbracht CW, Helou G, Thornley MD, et al. 2008. MNRAS 389:629–650
- Bendo et al. (2002) Bendo GJ, Joseph RD, Wells M, Gallais P, Haas M, et al. 2002. AJ 123:3067–3107
- Bendo et al. (2010) Bendo GJ, Wilson CD, Pohlen M, Sauvage M, Auld R, et al. 2010. A&A 518:L65
- Berlind et al. (1997) Berlind AA, Quillen AC, Pogge RW, Sellgren K. 1997. AJ 114:107–114
- Bianchi et al. (1996) Bianchi L, Clayton GC, Bohlin RC, Hutchings JB, Massey P. 1996. ApJ 471:203
- Bianchi (2007) Bianchi S. 2007. A&A 471:765–773
- Bianchi (2008) Bianchi S. 2008. A&A 490:461–475
- Block et al. (2010) Block DL, Puerari I, Elmegreen BG, Bournaud F. 2010. ApJ 718:L1–L6
- Block et al. (1994) Block DL, Witt AN, Grosbol P, Stockton A, Moneti A. 1994. A&A 288:383–395
- Bocchio et al. (2016) Bocchio M, Bianchi S, Hunt LK, Schneider R. 2016. A&A 586:A8
- Bocchio, Jones & Slavin (2014) Bocchio M, Jones AP, Slavin JD. 2014. A&A 570:A32
- Bocchio et al. (2013) Bocchio M, Jones AP, Verstraete L, Xilouris EM, Micelotta ER, Bianchi S. 2013. A&A 556:A6
- Bocchio et al. (2012) Bocchio M, Micelotta ER, Gautier AL, Jones AP. 2012. A&A 545:A124
- Bolte et al. (1989) Bolte M, Saddlemyer L, Mendes de Oliveira C, Hodder P. 1989. PASP 101:921–924
- Boquien et al. (2011) Boquien M, Calzetti D, Combes F, Henkel C, Israel F, et al. 2011. AJ 142:111
- Boquien et al. (2010) Boquien M, Duc PA, Galliano F, Braine J, Lisenfeld U, et al. 2010. AJ 140:2124–2144
- Boselli et al. (2010) Boselli A, Ciesla L, Buat V, Cortese L, Auld R, et al. 2010. A&A 518:L61
- Boselli et al. (2012) Boselli A, Ciesla L, Cortese L, Buat V, Boquien M, et al. 2012. A&A 540:A54
- Boselli et al. (2003) Boselli A, Sauvage M, Lequeux J, Donati A, Gavazzi G. 2003. A&A 406:867–877
- Bot et al. (2010) Bot C, Ysard N, Paradis D, Bernard JP, Lagache G, et al. 2010. A&A 523:A20+
- Boudet et al. (2005) Boudet N, Mutschke H, Nayral C, Jäger C, Bernard JP, et al. 2005. ApJ 633:272–281
- Boulanger et al. (1998) Boulanger F, Abergel A, Bernard JP, Cesarsky D, Puget JL, et al. 1998. The Nature of Small Interstellar Dust Particles. In Star Formation with the Infrared Space Observatory, eds. J Yun, L Liseau, vol. 132 of Astronomical Society of the Pacific Conference Series
- Boulanger & Perault (1988) Boulanger F, Perault M. 1988. ApJ 330:964–985
- Bressan et al. (2006) Bressan A, Panuzzo P, Buson L, Clemens M, Granato GL, et al. 2006. ApJ 639:L55–L58
- Calzetti (2001) Calzetti D. 2001. PASP 113:1449–1485
- Calzetti et al. (2000) Calzetti D, Armus L, Bohlin RC, Kinney AL, Koornneef J, Storchi-Bergmann T. 2000. ApJ 533:682–695
- Calzetti et al. (2007) Calzetti D, Kennicutt RC, Engelbracht CW, Leitherer C, Draine BT, et al. 2007. ApJ 666:870–895
- Calzetti, Kinney & Storchi-Bergmann (1994) Calzetti D, Kinney AL, Storchi-Bergmann T. 1994. ApJ 429:582–601 (C94)
- Campbell et al. (2015) Campbell EK, Holz M, Gerlich D, Maier JP. 2015. Nature 523:322–323
- Cardelli, Clayton & Mathis (1989) Cardelli JA, Clayton GC, Mathis JS. 1989. ApJ 345:245–256 (C89)
- Cartledge et al. (2005) Cartledge SIB, Clayton GC, Gordon KD, Rachford BL, Draine BT, et al. 2005. ApJ 630:355–367
- Chevance et al. (2016) Chevance M, Madden SC, Lebouteiller V, Godard B, Cormier D, et al. 2016. A&A 590:A36
- Clark et al. (2015) Clark CJR, Dunne L, Gomez HL, Maddox S, De Vis P, et al. 2015. MNRAS 452:397–430
- Clayton et al. (2015) Clayton GC, Gordon KD, Bianchi LC, Massa DL, Fitzpatrick EL, et al. 2015. ApJ 815:14
- Clayton et al. (2003) Clayton GC, Gordon KD, Salama F, Allamandola LJ, Martin PG, et al. 2003. ApJ 592:947–952
- Clayton et al. (1996) Clayton GC, Green J, Wolff MJ, Zellner NEB, Code AD, et al. 1996. ApJ 460:313
- Clayton et al. (2004) Clayton GC, Wolff MJ, Gordon KD, Smith PS, Nordsieck KH, Babler BL. 2004. AJ 127:3382–3387
- Clements et al. (1996) Clements DL, Sutherland WJ, McMahon RG, Saunders W. 1996. MNRAS 279:477–497
- Cole et al. (1999) Cole AA, Nordsieck KH, Gibson SJ, Harris WM. 1999. AJ 118:2280–2291
- Combes et al. (2012) Combes F, Boquien M, Kramer C, Xilouris EM, Bertoldi F, et al. 2012. A&A 539:A67
- Conroy, Schiminovich & Blanton (2010) Conroy C, Schiminovich D, Blanton MR. 2010. ApJ 718:184–198 (C10)
- Contursi et al. (2013) Contursi A, Poglitsch A, Grácia Carpio J, Veilleux S, Sturm E, et al. 2013. A&A 549:A118
- Cordiner et al. (2011) Cordiner MA, Cox NLJ, Evans CJ, Trundle C, Smith KT, et al. 2011. ApJ 726:39
- Cordiner et al. (2008) Cordiner MA, Smith KT, Cox NLJ, Evans CJ, Hunter I, et al. 2008. A&A 492:L5–L8
- Cormier et al. (2015) Cormier D, Madden SC, Lebouteiller V, Abel N, Hony S, et al. 2015. A&A 578:A53
- Corrales & Paerels (2015) Corrales LR, Paerels F. 2015. MNRAS 453:1121–1135
- Cortese et al. (2012) Cortese L, Ciesla L, Boselli A, Bianchi S, Gomez H, et al. 2012. A&A 540:A52
- Cox et al. (2006) Cox NLJ, Cordiner MA, Cami J, Foing BH, Sarre PJ, et al. 2006. A&A 447:991–1009
- Cox et al. (2007) Cox NLJ, Cordiner MA, Ehrenfreund P, Kaper L, Sarre PJ, et al. 2007. A&A 470:941–955
- Cox & Patat (2008) Cox NLJ, Patat F. 2008. A&A 485:L9–L12
- Crenshaw et al. (2001) Crenshaw DM, Kraemer SB, Bruhweiler FC, Ruiz JR. 2001. ApJ 555:633–640
- Crinklaw, Federman & Joseph (1994) Crinklaw G, Federman SR, Joseph CL. 1994. ApJ 424:748–753
- Crocker et al. (2013) Crocker AF, Calzetti D, Thilker DA, Aniano G, Draine BT, et al. 2013. ApJ 762:79
- Croxall et al. (2012) Croxall KV, Smith JD, Wolfire MG, Roussel H, Sandstrom KM, et al. 2012. ApJ 747:81
- da Cunha, Charlot & Elbaz (2008) da Cunha E, Charlot S, Elbaz D. 2008. MNRAS 388:1595–1617
- Dalcanton et al. (2015) Dalcanton JJ, Fouesneau M, Hogg DW, Lang D, Leroy AK, et al. 2015. ApJ 814:3
- Dale et al. (2017) Dale DA, Cook DO, Roussel H, Turner JA, Armus L, et al. 2017. ApJ 837:90
- Dale et al. (2001) Dale DA, Helou G, Contursi A, Silbermann NA, Kolhatkar S. 2001. ApJ 549:215–227
- Darbon, Perrin & Sivan (1998) Darbon S, Perrin JM, Sivan JP. 1998. A&A 333:264–268
- Dasyra et al. (2005) Dasyra KM, Xilouris EM, Misiriotis A, Kylafis ND. 2005. A&A 437:447–456
- Davies et al. (1999) Davies JI, Alton P, Trewhella M, Evans R, Bianchi S. 1999. MNRAS 304:495–500
- Davies et al. (1997) Davies JI, Trewhella M, Jones H, Lisk C, Madden A, Moss J. 1997. MNRAS 288:679–690
- Davis & Greenstein (1951) Davis Jr. L, Greenstein JL. 1951. ApJ 114:206
- De Cia et al. (2016) De Cia A, Ledoux C, Mattsson L, Petitjean P, Srianand R, et al. 2016. A&A 596:A97
- De Geyter et al. (2015) De Geyter G, Baes M, De Looze I, Bendo GJ, Bourne N, et al. 2015. MNRAS 451:1728–1739
- De Looze et al. (2012a) De Looze I, Baes M, Bendo GJ, Ciesla L, Cortese L, et al. 2012a. MNRAS 427:2797–2811
- De Looze et al. (2012b) De Looze I, Baes M, Fritz J, Verstappen J. 2012b. MNRAS 419:895–903
- De Marchi & Panagia (2014) De Marchi G, Panagia N. 2014. MNRAS 445:93–106
- De Vis et al. (2017a) De Vis P, Dunne L, Maddox S, Gomez HL, Clark CJR, et al. 2017a. MNRAS 464:4680–4705
- De Vis et al. (2017b) De Vis P, Gomez HL, Schofield SP, Maddox S, Dunne L, et al. 2017b. ArXiv e-prints
- Deshmukh et al. (2013) Deshmukh SP, Tate BT, Vagshette ND, Pandey SK, Patil MK. 2013. Research in Astronomy and Astrophysics 13:885–898
- Devereux & Young (1990) Devereux NA, Young JS. 1990. ApJ 359:42–56
- Dewangan, Singh & Bhat (1999) Dewangan GC, Singh KP, Bhat PN. 1999. AJ 118:785–796
- Dietz et al. (1989) Dietz RD, Gehrz RD, Jones TJ, Grasdalen GL, Smith J, et al. 1989. AJ 98:1260–1264
- Disney, Davies & Phillipps (1989) Disney M, Davies J, Phillipps S. 1989. MNRAS 239:939–976
- Dobashi et al. (2008) Dobashi K, Bernard JP, Hughes A, Paradis D, Reach WT, Kawamura A. 2008. A&A 484:205–223
- D’Odorico et al. (1989) D’Odorico S, di Serego Alighieri S, Pettini M, Magain P, Nissen PE, Panagia N. 1989. A&A 215:21–32
- Dolginov & Mitrofanov (1976) Dolginov AZ, Mitrofanov IG. 1976. Ap&SS 43:291–317
- Dong et al. (2014) Dong H, Li Z, Wang QD, Lauer TR, Olsen K, et al. 2014. ApJ 785:136
- Draine (1978) Draine BT. 1978. ApJS 36:595–619
- Draine & Anderson (1985) Draine BT, Anderson N. 1985. ApJ 292:494–499
- Draine et al. (2014) Draine BT, Aniano G, Krause O, Groves B, Sandstrom K, et al. 2014. ApJ 780:172
- Draine & Bond (2004) Draine BT, Bond NA. 2004. ApJ 617:987–1003
- Draine et al. (2007) Draine BT, Dale DA, Bendo G, Gordon KD, Smith JDT, et al. 2007. ApJ 663:866–894
- Draine & Hensley (2012) Draine BT, Hensley B. 2012. ApJ 757:103
- Draine & Lazarian (1998) Draine BT, Lazarian A. 1998. ApJ 494:L19+
- Draine & Li (2007) Draine BT, Li A. 2007. ApJ 657:810–837 (DL07)
- Duley & Williams (1981) Duley WW, Williams DA. 1981. MNRAS 196:269–274
- Dumke, Krause & Wielebinski (2004) Dumke M, Krause M, Wielebinski R. 2004. A&A 414:475–486
- Dwek et al. (2010) Dwek E, Arendt RG, Bouchet P, Burrows DN, Challis P, et al. 2010. ApJ 722:425–434
- Dwek & Scalo (1980) Dwek E, Scalo JM. 1980. ApJ 239:193–211
- Elias-Rosa et al. (2006) Elias-Rosa N, Benetti S, Cappellaro E, Turatto M, Mazzali PA, et al. 2006. MNRAS 369:1880–1900
- Engelbracht et al. (2005) Engelbracht CW, Gordon KD, Rieke GH, Werner MW, Dale DA, Latter WB. 2005. ApJ 628:L29–L32
- Evans et al. (2014) Evans PA, Willingale R, Osborne JP, O’Brien PT, Tanvir NR, et al. 2014. MNRAS 444:250–267
- Fendt, Beck & Neininger (1998) Fendt C, Beck R, Neininger N. 1998. A&A 335:123–133
- Finkelman et al. (2010) Finkelman I, Brosch N, Kniazev AY, Väisänen P, Buckley DAH, et al. 2010. MNRAS 409:727–736
- Fitzpatrick (1999) Fitzpatrick EL. 1999. PASP 111:63–75
- Fitzpatrick & Massa (2005) Fitzpatrick EL, Massa D. 2005. AJ 130:1127–1140
- Friis et al. (2015) Friis M, De Cia A, Krühler T, Fynbo JPU, Ledoux C, et al. 2015. MNRAS 451:167–183
- Fukui et al. (2015) Fukui Y, Torii K, Onishi T, Yamamoto H, Okamoto R, et al. 2015. ApJ 798:6
- Galametz et al. (2013) Galametz M, Hony S, Galliano F, Madden SC, Albrecht M, et al. 2013. MNRAS 431:1596–1617
- Galametz et al. (2012) Galametz M, Kennicutt RC, Albrecht M, Aniano G, Armus L, et al. 2012. MNRAS 425:763–787
- Galametz et al. (2009) Galametz M, Madden S, Galliano F, Hony S, Schuller F, et al. 2009. A&A 508:645–664
- Galliano (????) Galliano F, A Dust SED Model with Hierarchical Bayesian Inference (I). submitted
- Galliano, Dwek & Chanial (2008) Galliano F, Dwek E, Chanial P. 2008. ApJ 672:214–243 (G08a)
- Galliano et al. (2011) Galliano F, Hony S, Bernard JP, Bot C, Madden SC, et al. 2011. A&A 536:A88
- Galliano et al. (2005) Galliano F, Madden SC, Jones AP, Wilson CD, Bernard JP. 2005. A&A 434:867–885
- Galliano et al. (2003) Galliano F, Madden SC, Jones AP, Wilson CD, Bernard JP, Le Peintre F. 2003. A&A 407:159–176
- Galliano et al. (2008) Galliano F, Madden SC, Tielens AGGM, Peeters E, Jones AP. 2008. ApJ 679:310–345 (G08b)
- Gao et al. (2013) Gao J, Jiang BW, Li A, Xue MY. 2013. ApJ 776:7
- Gillett, Forrest & Merrill (1973) Gillett FC, Forrest WJ, Merrill KM. 1973. ApJ 183:87–93
- Gordon et al. (2003) Gordon KD, Clayton GC, Misselt KA, Landolt AU, Wolff MJ. 2003. ApJ 594:279–293 (G03)
- Gordon et al. (2000) Gordon KD, Clayton GC, Witt AN, Misselt KA. 2000. ApJ 533:236–244
- Gordon et al. (2008) Gordon KD, Engelbracht CW, Rieke GH, Misselt KA, Smith JDT, Kennicutt Jr. RC. 2008. ApJ 682:336–354
- Goudfrooij & de Jong (1995) Goudfrooij P, de Jong T. 1995. A&A 298:784
- Goudfrooij et al. (1994) Goudfrooij P, de Jong T, Hansen L, Norgaard-Nielsen HU. 1994. MNRAS 271:833
- Gould & Salpeter (1963) Gould RJ, Salpeter EE. 1963. ApJ 138:393
- Greaves et al. (2000) Greaves JS, Holland WS, Jenness T, Hawarden TG. 2000. Nature 404:732–733
- Guillet et al. (2017) Guillet V, Fanciullo L, Verstraete L, Boulanger F, Jones AP, et al. 2017. ArXiv e-prints
- Guseva et al. (2013) Guseva NG, Izotov YI, Fricke KJ, Henkel C. 2013. A&A 555:A90
- Haas et al. (1998) Haas M, Lemke D, Stickel M, Hippelein H, Kunkel M, et al. 1998. A&A 338:L33–L36
- Hall (1949) Hall JS. 1949. Science 109:166–167
- Hao et al. (2011) Hao CN, Kennicutt RC, Johnson BD, Calzetti D, Dale DA, Moustakas J. 2011. ApJ 741:124
- Heckman & Lehnert (2000) Heckman TM, Lehnert MD. 2000. ApJ 537:690–696
- Heger (1922) Heger ML. 1922. Lick Observatory Bulletin 10:141–145
- Helou et al. (2001) Helou G, Malhotra S, Hollenbach DJ, Dale DA, Contursi A. 2001. ApJ 548:L73–L76
- Hemachandra et al. (2015) Hemachandra D, Barmby P, Peeters E, Willner SP, Ashby MLN, et al. 2015. MNRAS 454:818–830
- Hensley, Murphy & Staguhn (2015) Hensley B, Murphy E, Staguhn J. 2015. MNRAS 449:809–819
- Hensley, Draine & Meisner (2016) Hensley BS, Draine BT, Meisner AM. 2016. ApJ 827:45
- Herbig (1995) Herbig GH. 1995. ARA&A 33:19–74
- Hildebrand (1983) Hildebrand RH. 1983. QJRAS 24:267
- Hill et al. (1995) Hill RS, Cheng KP, Bohlin RC, O’Connell RW, Roberts MS, et al. 1995. ApJ 446:622
- Hiltner (1949) Hiltner WA. 1949. Science 109:165
- Hinz et al. (2012) Hinz JL, Engelbracht CW, Skibba R, Crocker A, Donovan Meyer J, et al. 2012. ApJ 756:75
- Hippelein et al. (2003) Hippelein H, Haas M, Tuffs RJ, Lemke D, Stickel M, et al. 2003. A&A 407:137–146
- Hirashita (2015) Hirashita H. 2015. MNRAS 447:2937–2950
- Hobbs et al. (2009) Hobbs LM, York DG, Thorburn JA, Snow TP, Bishof M, et al. 2009. ApJ 705:32–45
- Hony et al. (2011) Hony S, Kemper F, Woods PM, van Loon JT, Gorjian V, et al. 2011. A&A 531:A137
- Hony et al. (2001) Hony S, Van Kerckhoven C, Peeters E, Tielens AGGM, Hudgins DM, Allamandola LJ. 2001. A&A 370:1030–1043
- Hopkins, Quataert & Murray (2012) Hopkins PF, Quataert E, Murray N. 2012. MNRAS 421:3522–3537
- Houck et al. (2004) Houck JR, Charmandaris V, Brandl BR, Weedman D, Herter T, et al. 2004. ApJS 154:211–214
- Huang et al. (2017) Huang X, Raha Z, Aldering G, Antilogus P, Bailey S, et al. 2017. ApJ 836:157
- Huchtmeier, Seiradakis & Materne (1981) Huchtmeier WK, Seiradakis JH, Materne J. 1981. A&A 102:134–141
- Hunt et al. (2015) Hunt LK, Draine BT, Bianchi S, Gordon KD, Aniano G, et al. 2015. A&A 576:A33
- Hunt & Giovanardi (1992) Hunt LK, Giovanardi C. 1992. AJ 104:1018–1038
- Hunt et al. (2010) Hunt LK, Thuan TX, Izotov YI, Sauvage M. 2010. ApJ 712:164–187
- Hunter, Elmegreen & Martin (2006) Hunter DA, Elmegreen BG, Martin E. 2006. AJ 132:801–818
- Hutton, Ferreras & Yershov (2015) Hutton S, Ferreras I, Yershov V. 2015. MNRAS 452:1412–1420
- Imanishi et al. (2010) Imanishi M, Nakagawa T, Shirahata M, Ohyama Y, Onaka T. 2010. ApJ 721:1233–1261
- Israel (1997) Israel FP. 1997. A&A 328:471–482
- Israel et al. (2010) Israel FP, Wall WF, Raban D, Reach WT, Bot C, et al. 2010. A&A 519:A67+
- Izotov et al. (2006) Izotov YI, Stasińska G, Meynet G, Guseva NG, Thuan TX. 2006. A&A 448:955–970
- James et al. (2014) James BL, Aloisi A, Heckman T, Sohn ST, Wolfe MA. 2014. ApJ 795:109
- Jenkins (2009) Jenkins EB. 2009. ApJ 700:1299–1348
- Jenkins & Wallerstein (2017) Jenkins EB, Wallerstein G. 2017. ApJ 838:85
- Jones et al. (2015) Jones AG, Bendo GJ, Baes M, Boquien M, Boselli A, et al. 2015. MNRAS 448:168–187
- Jones et al. (2013) Jones AP, Fanciullo L, Köhler M, Verstraete L, Guillet V, et al. 2013. A&A 558:A62
- Jones et al. (2017) Jones AP, Köhler M, Ysard N, Bocchio M, Verstraete L. 2017. A&A 602:A46 (J17)
- Jones, Tielens & Hollenbach (1996) Jones AP, Tielens AGGM, Hollenbach DJ. 1996. ApJ 469:740
- Jones (2000) Jones TJ. 2000. AJ 120:2920–2927
- Joseph et al. (1984) Joseph RD, Meikle WPS, Robertson NA, Wright GS. 1984. MNRAS 209:111–122
- Jura et al. (1987) Jura M, Kim DW, Knapp GR, Guhathakurta P. 1987. ApJ 312:L11–L15
- Juvela & Ysard (2012) Juvela M, Ysard N. 2012. A&A 539:A71
- Kaneda, Onaka & Sakon (2007) Kaneda H, Onaka T, Sakon I. 2007. ApJ 666:L21–L24
- Kapala et al. (2017) Kapala MJ, Groves B, Sandstrom K, Jarrett T, da Cunha E, et al. 2017. ApJ 842:128
- Kawabata et al. (2014) Kawabata KS, Akitaya H, Yamanaka M, Itoh R, Maeda K, et al. 2014. ApJ 795:L4
- Kelly et al. (2012) Kelly BC, Shetty R, Stutz AM, Kauffmann J, Goodman AA, Launhardt R. 2012. ApJ 752:55
- Kemper, Vriend & Tielens (2004) Kemper F, Vriend WJ, Tielens AGGM. 2004. ApJ 609:826–837
- Kogut et al. (1996) Kogut A, Banday AJ, Bennett CL, Gorski KM, Hinshaw G, et al. 1996. ApJ 464:L5
- Köhler, Ysard & Jones (2015) Köhler M, Ysard N, Jones AP. 2015. A&A 579:A15 (K15)
- Kondo et al. (2012) Kondo T, Kaneda H, Oyabu S, Ishihara D, Mori T, et al. 2012. ApJ 751:L18
- Korn et al. (2002) Korn AJ, Keller SC, Kaufer A, Langer N, Przybilla N, et al. 2002. A&A 385:143–151
- Lan, Ménard & Zhu (2015) Lan TW, Ménard B, Zhu G. 2015. MNRAS 452:3629–3649
- Lawton et al. (2008) Lawton B, Churchill CW, York BA, Ellison SL, Snow TP, et al. 2008. AJ 136:994–1012
- Le Petit et al. (2006) Le Petit F, Nehmé C, Le Bourlot J, Roueff E. 2006. ApJS 164:506–529
- Lebouteiller et al. (2011) Lebouteiller V, Barry DJ, Spoon HWW, Bernard-Salas J, Sloan GC, et al. 2011. ApJS 196:8
- Lebouteiller et al. (2013) Lebouteiller V, Heap S, Hubeny I, Kunth D. 2013. A&A 553:A16
- Lebouteiller et al. (2017) Lebouteiller V, Péquignot D, Cormier D, Madden S, Pakull MW, et al. 2017. A&A 602:A45
- Lee et al. (2009) Lee JC, Xiang J, Ravel B, Kortright J, Flanagan K. 2009. ApJ 702:970–979
- Léger & Puget (1984) Léger A, Puget JL. 1984. A&A 137:L5–L8
- Leroy et al. (2011) Leroy AK, Bolatto A, Gordon K, Sandstrom K, Gratier P, et al. 2011. ApJ 737:12
- Li & Greenberg (2002) Li A, Greenberg JM. 2002. ApJ 577:789–794
- Li et al. (2010) Li Y, Calzetti D, Kennicutt RC, Hong S, Engelbracht CW, et al. 2010. ApJ 725:677–691
- Lisenfeld & Ferrara (1998) Lisenfeld U, Ferrara A. 1998. ApJ 496:145
- Lisenfeld et al. (2002) Lisenfeld U, Israel FP, Stil JM, Sievers A. 2002. A&A 382:860–871
- Lobo Gomes et al. (2015) Lobo Gomes A, Magalhães AM, Pereyra A, Rodrigues CV. 2015. ApJ 806:94
- Lonsdale Persson & Helou (1987) Lonsdale Persson CJ, Helou G. 1987. ApJ 314:513–524
- Lu et al. (2003) Lu N, Helou G, Werner MW, Dinerstein HL, Dale DA, et al. 2003. ApJ 588:199–217
- Lutz et al. (1996) Lutz D, Feuchtgruber H, Genzel R, Kunze D, Rigopoulou D, et al. 1996. A&A 315:L269–L272
- Madden et al. (2006) Madden SC, Galliano F, Jones AP, Sauvage M. 2006. A&A 446:877–896
- Madden et al. (1997) Madden SC, Poglitsch A, Geis N, Stacey GJ, Townes CH. 1997. ApJ 483:200–+
- Maiolino et al. (2001) Maiolino R, Marconi A, Salvati M, Risaliti G, Severgnini P, et al. 2001. A&A 365:28–36
- Malhotra et al. (1996) Malhotra S, Helou G, van Buren D, Kong M, Beichman CA, et al. 1996. A&A 315:L161–L164
- Mallouris (2003) Mallouris C. 2003. ApJS 147:265–303
- Mason et al. (2007) Mason RE, Wright GS, Adamson A, Pendleton Y. 2007. ApJ 656:798–804
- Matsuura et al. (2015) Matsuura M, Dwek E, Barlow MJ, Babler B, Baes M, et al. 2015. ApJ 800:50
- Meijerink et al. (2005) Meijerink R, Tilanus RPJ, Dullemond CP, Israel FP, van der Werf PP. 2005. A&A 430:427–434
- Melisse & Israel (1994) Melisse JPM, Israel FP. 1994. A&A 285:51–68
- Mennella et al. (1998) Mennella V, Brucato JR, Colangeli L, Palumbo P, Rotundi A, Bussoletti E. 1998. ApJ 496:1058
- Mentuch, Abraham & Zibetti (2010) Mentuch E, Abraham RG, Zibetti S. 2010. ApJ 725:1971–1983
- Meny et al. (2007) Meny C, Gromov V, Boudet N, Bernard JP, Paradis D, Nayral C. 2007. A&A 468:171–188
- Micelotta, Jones & Tielens (2010) Micelotta ER, Jones AP, Tielens AGGM. 2010. A&A 510:A37
- Montgomery & Clemens (2014) Montgomery JD, Clemens DP. 2014. ApJ 786:41
- Mori et al. (2012) Mori TI, Sakon I, Onaka T, Kaneda H, Umehata H, Ohsawa R. 2012. ApJ 744:68
- Muñoz-Mateos et al. (2009a) Muñoz-Mateos JC, Gil de Paz A, Boissier S, Zamorano J, Dale DA, et al. 2009a. ApJ 701:1965–1991
- Muñoz-Mateos et al. (2009b) Muñoz-Mateos JC, Gil de Paz A, Zamorano J, Boissier S, Dale DA, et al. 2009b. ApJ 703:1569–1596
- Murphy et al. (2010) Murphy EJ, Helou G, Condon JJ, Schinnerer E, Turner JL, et al. 2010. ApJ 709:L108–L113
- Nandy et al. (1981) Nandy K, Morgan DH, Willis AJ, Wilson R, Gondhalekar PM. 1981. MNRAS 196:955–966
- Oey (1996) Oey MS. 1996. ApJ 467:666
- Oliveira et al. (2013) Oliveira JM, van Loon JT, Sloan GC, Sewiło M, Kraemer KE, et al. 2013. MNRAS 428:3001–3033
- Onaka et al. (2010) Onaka T, Matsumoto H, Sakon I, Kaneda H. 2010. A&A 514:A15
- Padoan et al. (2001) Padoan P, Kim S, Goodman A, Staveley-Smith L. 2001. ApJ 555:L33–L36
- Paradis et al. (2012) Paradis D, Paladini R, Noriega-Crespo A, Mény C, Piacentini F, et al. 2012. A&A 537:A113
- Paradis et al. (2009) Paradis D, Reach WT, Bernard J, Block M, Engelbracht CW, et al. 2009. AJ 138:196–209
- Patat et al. (2015) Patat F, Taubenberger S, Cox NLJ, Baade D, Clocchiatti A, et al. 2015. A&A 577:A53
- Peña-Guerrero et al. (2012) Peña-Guerrero MA, Peimbert A, Peimbert M, Ruiz MT. 2012. ApJ 746:115
- Peel et al. (2011) Peel MW, Dickinson C, Davies RD, Clements DL, Beswick RJ. 2011. MNRAS 416:L99–L103
- Peeters et al. (2002) Peeters E, Martín-Hernández NL, Damour F, Cox P, Roelfsema PR, et al. 2002. A&A 381:571–605
- Peeters, Spoon & Tielens (2004) Peeters E, Spoon HWW, Tielens AGGM. 2004. ApJ 613:986–1003
- Perrin, Darbon & Sivan (1995) Perrin JM, Darbon S, Sivan JP. 1995. A&A 304:L21
- Phillips et al. (1987) Phillips MM, Phillips AC, Heathcote SR, Blanco VM, Geisler D, et al. 1987. PASP 99:592–605
- Pierini et al. (2004) Pierini D, Gordon KD, Witt AN, Madsen GJ. 2004. ApJ 617:1022–1046
- Pierini et al. (2002) Pierini D, Majeed A, Boroson TA, Witt AN. 2002. ApJ 569:184–203
- Planck Collaboration et al. (2014) Planck Collaboration, Abergel A, Ade PAR, Aghanim N, Alves MIR, et al. 2014. A&A 571:A11
- Planck Collaboration et al. (2015a) Planck Collaboration, Ade PAR, Aghanim N, Alina D, Alves MIR, et al. 2015a. A&A 576:A105
- Planck Collaboration et al. (2016) Planck Collaboration, Ade PAR, Aghanim N, Alves MIR, Aniano G, et al. 2016. A&A 586:A132
- Planck Collaboration et al. (2011a) Planck Collaboration, Ade PAR, Aghanim N, Arnaud M, Ashdown M, et al. 2011a. A&A 536:A17
- Planck Collaboration et al. (2011b) Planck Collaboration, Ade PAR, Aghanim N, Arnaud M, Ashdown M, et al. 2011b. A&A 536:A20
- Planck Collaboration et al. (2015b) Planck Collaboration, Ade PAR, Aghanim N, Arnaud M, Ashdown M, et al. 2015b. A&A 582:A28
- Poglitsch et al. (1995) Poglitsch A, Krabbe A, Madden SC, Nikola T, Geis N, et al. 1995. ApJ 454:293–+
- Popescu & Tuffs (2003) Popescu CC, Tuffs RJ. 2003. A&A 410:L21–L24
- Popescu et al. (2011) Popescu CC, Tuffs RJ, Dopita MA, Fischera J, Kylafis ND, Madore BF. 2011. A&A 527:A109
- Reach et al. (2000) Reach WT, Boulanger F, Contursi A, Lequeux J. 2000. A&A 361:895–900
- Reach et al. (1995) Reach WT, Dwek E, Fixsen DJ, Hewagama T, Mather JC, et al. 1995. ApJ 451:188–+
- Reines, Johnson & Goss (2008) Reines AE, Johnson KE, Goss WM. 2008. AJ 135:2222–2239
- Reines, Johnson & Hunt (2008) Reines AE, Johnson KE, Hunt LK. 2008. AJ 136:1415–1426
- Reines et al. (2010) Reines AE, Nidever DL, Whelan DG, Johnson KE. 2010. ApJ 708:26–37
- Rémy-Ruyer et al. (2014) Rémy-Ruyer A, Madden SC, Galliano F, Galametz M, Takeuchi TT, et al. 2014. A&A 563:A31
- Rémy-Ruyer et al. (2013) Rémy-Ruyer A, Madden SC, Galliano F, Hony S, Sauvage M, et al. 2013. A&A 557:A95
- Rémy-Ruyer et al. (2015) Rémy-Ruyer A, Madden SC, Galliano F, Lebouteiller V, Baes M, et al. 2015. A&A 582:A121
- Ritchey & Wallerstein (2015) Ritchey AM, Wallerstein G. 2015. PASP 127:223
- Rodrigues et al. (1997) Rodrigues CV, Magalhães AM, Coyne GV, Piirola SJV. 1997. ApJ 485:618–637
- Rodríguez-Ardila, Contini & Viegas (2005) Rodríguez-Ardila A, Contini M, Viegas SM. 2005. MNRAS 357:220–234
- Roman-Duval et al. (2017) Roman-Duval J, Bot C, Chastenet J, Gordon K. 2017. ApJ 841:72
- Roman-Duval et al. (2014) Roman-Duval J, Gordon KD, Meixner M, Bot C, Bolatto A, et al. 2014. ApJ 797:86
- Rosa & Benvenuti (1994) Rosa MR, Benvenuti P. 1994. A&A 291:1–17
- Roth & Blades (1997) Roth KC, Blades JC. 1997. ApJ 474:L95–L98
- Roussel et al. (2001) Roussel H, Vigroux L, Bosma A, Sauvage M, Bonoli C, et al. 2001. A&A 369:473–509
- Rubin et al. (2009) Rubin D, Hony S, Madden SC, Tielens AGGM, Meixner M, et al. 2009. A&A 494:647–661
- Sadler & Gerhard (1985) Sadler EM, Gerhard OE. 1985. MNRAS 214:177–187
- Sales, Pastoriza & Riffel (2010) Sales DA, Pastoriza MG, Riffel R. 2010. ApJ 725:605–614
- Sandford, Bernstein & Materese (2013) Sandford SA, Bernstein MP, Materese CK. 2013. ApJS 205:8
- Sandstrom et al. (2012) Sandstrom KM, Bolatto AD, Bot C, Draine BT, Ingalls JG, et al. 2012. ApJ 744:20
- Sandstrom et al. (2010) Sandstrom KM, Bolatto AD, Draine BT, Bot C, Stanimirović S. 2010. ApJ 715:701–723
- Sauvage et al. (1996) Sauvage M, Blommaert J, Boulanger F, Cesarsky CJ, Cesarsky DA, et al. 1996. A&A 315:L89–L92
- Savage & Bohlin (1979) Savage BD, Bohlin RC. 1979. ApJ 229:136–146
- Savage & Sembach (1996) Savage BD, Sembach KR. 1996. ARA&A 34:279–330
- Scaife et al. (2010) Scaife AMM, Nikolic B, Green DA, Beck R, Davies ML, et al. 2010. MNRAS 406:L45–L49
- Scarrott et al. (1996) Scarrott SM, Foley NB, Gledhill TM, Wolstencroft RD. 1996. MNRAS 282:252–262
- Sellgren (1984) Sellgren K. 1984. ApJ 277:623–633
- Sembach et al. (2001) Sembach KR, Howk JC, Savage BD, Shull JM. 2001. AJ 121:992–1002
- Seok, Hirashita & Asano (2014) Seok JY, Hirashita H, Asano RS. 2014. MNRAS 439:2186–2196
- Serkowski, Mathewson & Ford (1975) Serkowski K, Mathewson DS, Ford VL. 1975. ApJ 196:261–290
- Shetty et al. (2009) Shetty R, Kauffmann J, Schnee S, Goodman AA. 2009. ApJ 696:676–680
- Slavin, Dwek & Jones (2015) Slavin JD, Dwek E, Jones AP. 2015. ApJ 803:7
- Smith & Hancock (2009) Smith BJ, Hancock M. 2009. AJ 138:130–145
- Smith et al. (2017) Smith JDT, Croxall K, Draine B, De Looze I, Sandstrom K, et al. 2017. ApJ 834:5
- Smith et al. (2007) Smith JDT, Draine BT, Dale DA, Moustakas J, Kennicutt RC, et al. 2007. ApJ 656:770–791 (S07)
- Smith et al. (2012) Smith MWL, Gomez HL, Eales SA, Ciesla L, Boselli A, et al. 2012. ApJ 748:123
- Smith, Valencic & Corrales (2016) Smith RK, Valencic LA, Corrales L. 2016. ApJ 818:143
- Sofia et al. (2006) Sofia UJ, Gordon KD, Clayton GC, Misselt K, Wolff MJ, et al. 2006. ApJ 636:753–764
- Sollerman et al. (2005) Sollerman J, Cox N, Mattila S, Ehrenfreund P, Kaper L, et al. 2005. A&A 429:559–567
- Spoon et al. (2006) Spoon HWW, Tielens AGGM, Armus L, Sloan GC, Sargent B, et al. 2006. ApJ 638:759–765
- Stecher (1965) Stecher TP. 1965. ApJ 142:1683
- Stein (1966) Stein W. 1966. ApJ 144:318
- Stepnik et al. (2003) Stepnik B, Abergel A, Bernard J, Boulanger F, Cambrésy L, et al. 2003. A&A 398:551–563
- Stevens, Amure & Gear (2005) Stevens JA, Amure M, Gear WK. 2005. MNRAS 357:361–380
- Stierwalt et al. (2014) Stierwalt S, Armus L, Charmandaris V, Diaz-Santos T, Marshall J, et al. 2014. ApJ 790:124
- Tabatabaei et al. (2014) Tabatabaei FS, Braine J, Xilouris EM, Kramer C, Boquien M, et al. 2014. A&A 561:A95
- Tchernyshyov et al. (2015) Tchernyshyov K, Meixner M, Seale J, Fox A, Friedman SD, et al. 2015. ApJ 811:78
- Tempel, Tamm & Tenjes (2010) Tempel E, Tamm A, Tenjes P. 2010. A&A 509:A91
- Thorburn et al. (2003) Thorburn JA, Hobbs LM, McCall BJ, Oka T, Welty DE, et al. 2003. ApJ 584:339–356
- Thuan, Sauvage & Madden (1999) Thuan TX, Sauvage M, Madden S. 1999. ApJ 516:783–787
- Trewhella et al. (2000) Trewhella M, Davies JI, Alton PB, Bianchi S, Madore BF. 2000. ApJ 543:153–160
- Tuffs et al. (1996) Tuffs RJ, Lemke D, Xu C, Davies JI, Gabriel C, et al. 1996. A&A 315:L149–L152
- van Loon et al. (2013) van Loon JT, Bailey M, Tatton BL, Maíz Apellániz J, Crowther PA, et al. 2013. A&A 550:A108
- Vanzi et al. (2000) Vanzi L, Hunt LK, Thuan TX, Izotov YI. 2000. A&A 363:493–506
- Vega et al. (2010) Vega O, Bressan A, Panuzzo P, Rampazzo R, Clemens M, et al. 2010. ApJ 721:1090–1104
- Vermeij et al. (2002) Vermeij R, Peeters E, Tielens AGGM, van der Hulst JM. 2002. A&A 382:1042–1051
- Viaene et al. (2017) Viaene S, Baes M, Tamm A, Tempel E, Bendo G, et al. 2017. A&A 599:A64
- Viaene et al. (2015) Viaene S, De Geyter G, Baes M, Fritz J, Bendo GJ, et al. 2015. A&A 579:A103
- Vidal-Madjar et al. (1987) Vidal-Madjar A, Andreani P, Cristiani S, Ferlet R, Lanz T, Vladilo G. 1987. A&A 177:L17–L20
- Vogler et al. (2005) Vogler A, Madden SC, Beck R, Lundgren AA, Sauvage M, et al. 2005. A&A 441:491–511
- Walsh et al. (2002) Walsh W, Beck R, Thuma G, Weiss A, Wielebinski R, Dumke M. 2002. A&A 388:7–28
- Walter et al. (2007) Walter F, Cannon JM, Roussel H, Bendo GJ, Calzetti D, et al. 2007. ApJ 661:102–114
- Weingartner & Draine (2001) Weingartner JC, Draine BT. 2001. ApJS 134:263–281
- Welty et al. (2006) Welty DE, Federman SR, Gredel R, Thorburn JA, Lambert DL. 2006. ApJS 165:138–172
- Welty et al. (1997) Welty DE, Lauroesch JT, Blades JC, Hobbs LM, York DG. 1997. ApJ 489:672–692
- Welty et al. (2014) Welty DE, Ritchey AM, Dahlstrom JA, York DG. 2014. ApJ 792:106
- Whelan et al. (2013) Whelan DG, Lebouteiller V, Galliano F, Peeters E, Bernard-Salas J, et al. 2013. ApJ 771:16
- White & Keel (1992) White III RE, Keel WC. 1992. Nature 359:129–131
- Witt & Vijh (2004) Witt AN, Vijh UP. 2004. Extended Red Emission. In Astrophysics of Dust, eds. AN Witt, GC Clayton, BT Draine, vol. 309 of Astronomical Society of the Pacific Conference Series
- Wood et al. (2008) Wood K, Whitney BA, Robitaille T, Draine BT. 2008. ApJ 688:1118–1123
- Wu, Hogg & Moustakas (2011) Wu R, Hogg DW, Moustakas J. 2011. ApJ 730:111
- Wu et al. (2015) Wu R, Madden SC, Galliano F, Wilson CD, Kamenetzky J, et al. 2015. A&A 575:A88
- Wu et al. (2009) Wu Y, Charmandaris V, Huang J, Spinoglio L, Tommasin S. 2009. ApJ 701:658–676
- Xilouris et al. (1999) Xilouris EM, Byun YI, Kylafis ND, Paleologou EV, Papamastorakis J. 1999. A&A 344:868–878
- Yamagishi et al. (2012) Yamagishi M, Kaneda H, Ishihara D, Kondo T, Onaka T, et al. 2012. A&A 541:A10
- Yamagishi et al. (2015) Yamagishi M, Kaneda H, Ishihara D, Oyabu S, Onaka T, et al. 2015. ApJ 807:29
- Yoshida, Kawabata & Ohyama (2011) Yoshida M, Kawabata KS, Ohyama Y. 2011. PASJ 63:493–503
- Ysard et al. (2015) Ysard N, Köhler M, Jones A, Miville-Deschênes MA, Abergel A, Fanciullo L. 2015. A&A 577:A110
- Zeegers et al. (2017) Zeegers ST, Costantini E, de Vries CP, Tielens AGGM, Chihara H, et al. 2017. A&A 599:A117
- Zhukovska (2014) Zhukovska S. 2014. A&A 562:A76
- Zubko, Dwek & Arendt (2004) Zubko V, Dwek E, Arendt RG. 2004. ApJS 152:211–249
- Zubko & Laor (2000) Zubko VG, Laor A. 2000. ApJS 128:245–269