The interstellar medium towards the Ara OB1 region.
Abstract
We present high resolution ( 4 km s-1) absorption measurements of the interstellar NaI and CaII lines measured towards 14 early-type stars of distance 123 pc–1650 pc, located in the direction of the Ara OB1 stellar cluster. The line profiles can broadly be split into four distinct groupings of absorption component velocity, and we have attempted to identify an origin and distance to each of these interstellar features. For gas with absorption covering the velocity range km s-1 km s-1, we can identify the absorbing medium with local gas belonging to the Lupus-Norma interstellar cavity located between 100 and 485 pc in this galactic direction. Gas with velocities spanning the range km s km s-1 is detected towards stars with distances of 570–800 pc. We identify a wide-spread interstellar feature at km s-1 with the expanding HI shell called GSH 337+0005, which is now placed at a distance of 530 pc.
Gas with velocities in the range km s km s-1 is only detected towards stars with distances 1 kpc, which places this absorbing gas at a similar distance to that of the Ara OB1 stellar cluster. The similarity between the radial velocity of the stellar cluster and that of the absorbing gas suggests that the cluster stars may be presently embedded within, and traveling through, this interstellar cloud complex. Absorption at velocities km s-1 is seen towards only two stars, HD 154873 and HD 150958, both of which have distances 1300 pc. Although the NaI/CaII for this component is consistent with the presence of interstellar shocks, we believe that it is unlikely that this highly negative velocity gas is physically associated with the Ara OB1 cluster itself, and its origin may be linked to the more distant (and larger) Sco OB1 cluster.
Keywords OB associations: interstellar absorption
1 Introduction
The Ara OB1 association is located in the Carina-Sagittarius spiral arm (, ) and contains several clusters of hot young stars that include NGC 6167, 6193 and 6204, as well as the molecular cloud/HII region complexes of RCW 108 and 107. With a distance of 1320 pc (Herbst Havlen, 1977) this complex lies slightly foreground and adjacent to the larger Sco OB1 association. The interstellar sight-line to this region of the Galaxy is known to be complex, and it contains several gas and dust clouds with velocities covering the to km s-1 range (Arnal, May Romero, 2003). A constant reddening of 0.2 mag has been found in this direction reaching to a distance of 1 kpc (Herbst Havlen, 1977), with the majority of this interstellar dust residing within 200 pc of the Sun. Beyond this local extinction there appears to be a clear interstellar region, 1 kpc wide, which is the well-known ‘inter-arm’ gap that separates the local spiral arm from the adjacent Carina-Sagittarius arm.
The young stars in Ara OB1 are known to have a profound effect on the surrounding interstellar medium (ISM), with their out-flowing stellar winds imparting pressure to form expanding shells of gas. Many such interstellar features have been discovered from HI and H observations of the area. For example, Arnal et al. (1987) have found an expanding HI emitting shell centered on NGC 6167 with a kinematic distance of 1400 pc and an outer radius of pc. Subsequent HI observations of this region by Rizzo Bajaja (1994) have further revealed a pervasive two-shell structure with gas cloud LSR velocities centered at km s-1 and km s-1, each with respective kinematic distances of 1.4 and 2.5 kpc. The nearer gas shell was speculated to be formed as a result of stellar winds (and/or supernova explosions), which sequentially triggered the star formation process in Ara OB1 after running into a nearby molecular cloud less than years ago (Waldhausen, Martinez Feinstein, 1999). H observations of this region by Georgelin et al. (1996) have also revealed similarly pervasive emission features with LSR velocities of km s-1 and km s-1.
More recent HI observations for the Southern Galactic Plane Survey by McClure-Griffiths et al. (2002) have revealed a large 10∘ angular diameter shell, named GSH 337+0005, surrounding this entire region that is centered approximately on the galactic plane. The authors derive a systemic LSR velocity of km s-1, an expansion velocity of 9 km s-1 and an energy of J for this large interstellar feature. They place the distance of this gas shell at 570 pc, which would imply that it lies considerably in front of the Ara OB1 cluster, although the expansion energy of the shell is consistent with its formation by a young association of hot stars (such as those of Ara OB1). Interstellar NaI and CaII absorption observations of the sight-lines towards early-type stars in both Sco OB1 (, ) by Crawford et al. (1989) and in Ara OB1 by Whiteoak Gardner (1985) have revealed several gas cloud components which show several well-defined groupings with LSR velocities in the to km s-1 range, similar to that found from the HI data. However, these negative velocity absorption components have been associated with interstellar gas at a distance 1 kpc that has supposedly been disrupted by the stellar winds of the two aforementioned OB associations. Thus, the interpretations of the radio HI emission and the ground based absorption data are presently in disagreement.
In this paper we present new high resolution ( or velocity resolution km s-1) NaI and CaII absorption measurements towards 14 early-type stars located in the galactic direction towards Ara OB1. From these new, and previous, interstellar observations we can place a most probable distance of pc to the large GSH 337+0005 HI shell, in contradiction to its physical association with the Ara OB1 cluster as argued previously by several authors. Instead, we argue that gas with absorption velocities in the range km s km s-1 is formed at a distance of kpc, and is far more likely to be linked to the interaction of the Ara OB1 stellar cluster with the ambient ISM.
2 Observations and data analysis
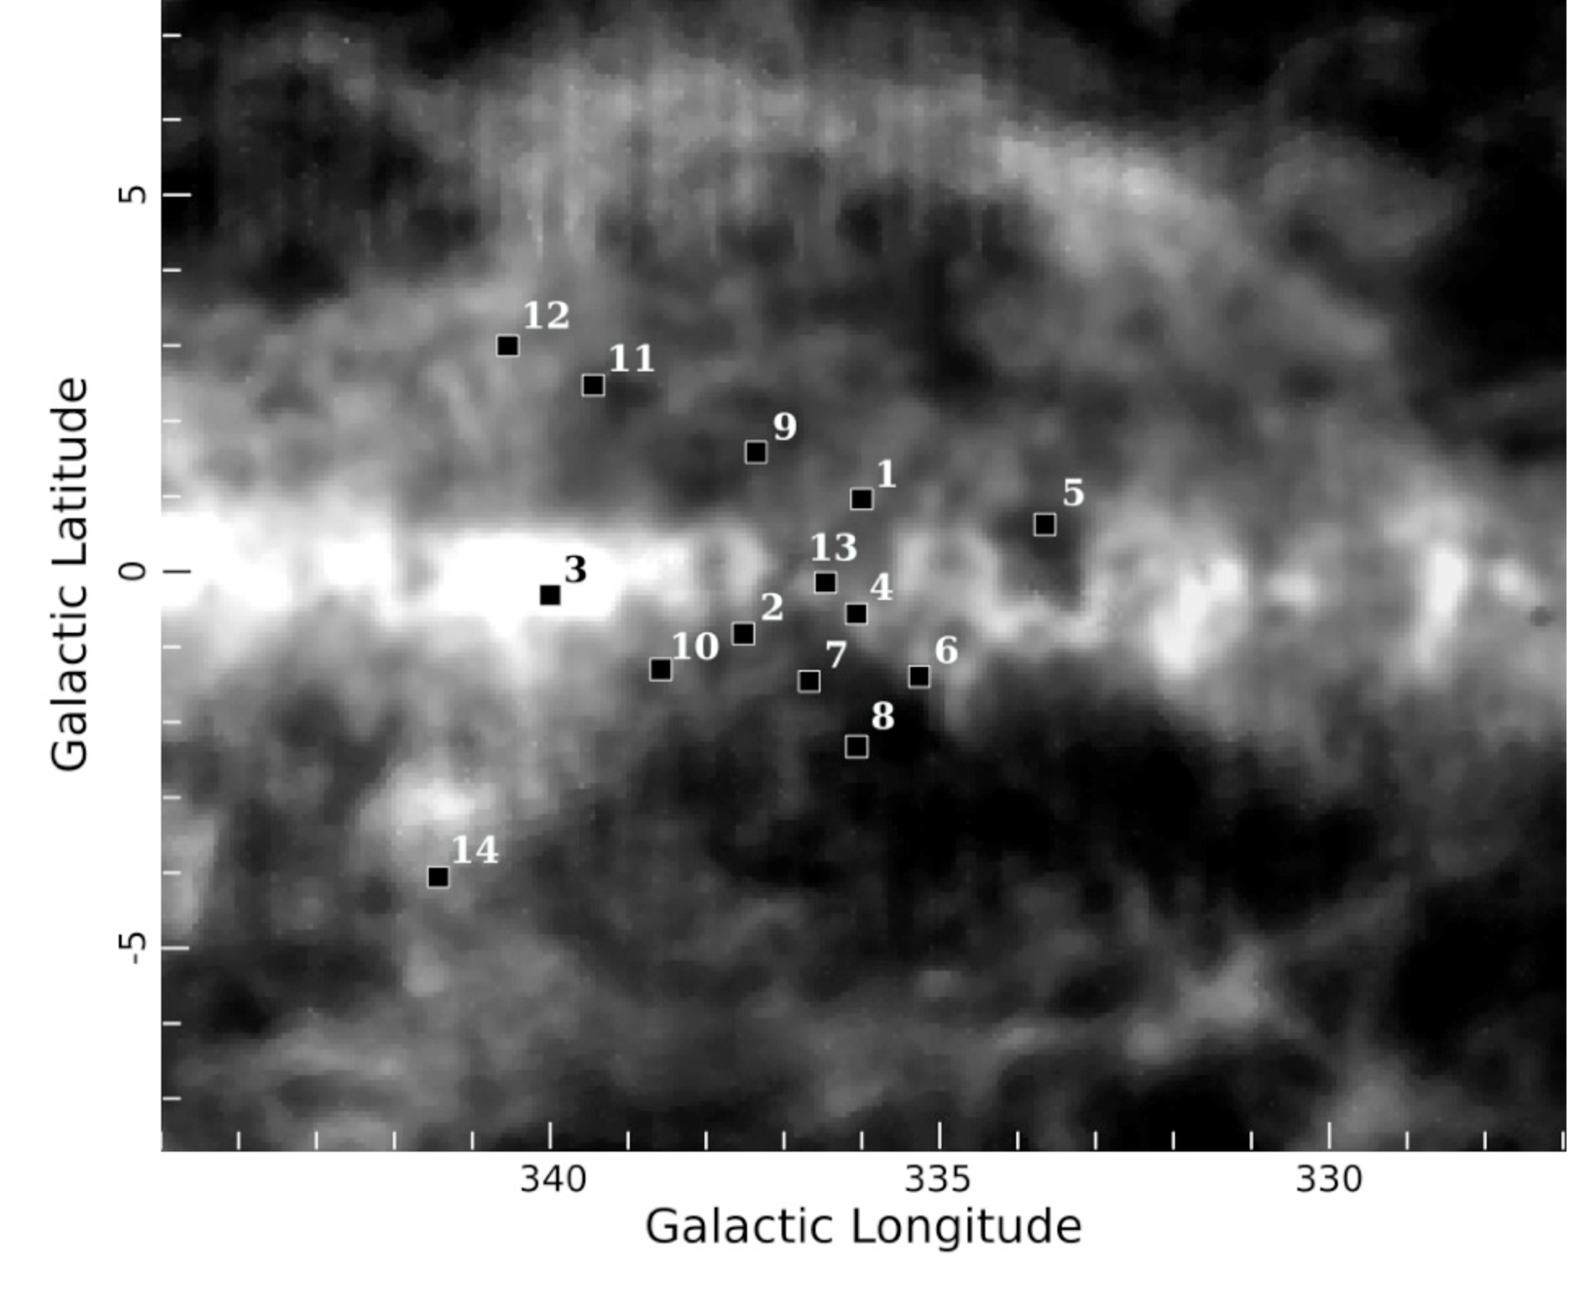
Interstellar NaI D-line doublet (5890 Å) and CaII (3933 Å) absorption line measurements were obtained for the 14 early-type stars given in Table 1, which all lie within a radius of of the central position of the GSH 337+0005 shell. We also list the galactic position, visual magnitude, spectral type, reddening (colour excess) and distances of these stars. The list (presented in increasing stellar distance) includes targets lying both in front of and beyond the nominal 1320 pc distance of the Ara OB1 association. In Figure 1 we show the position of all these (numbered) targets with respect to an HI image of the GSH 337+0005 shell (McClure-Griffiths et al., 2002). The majority of our targets lie within of the galactic plane and most have sight-lines that are coincident with the brightest emission features of the km s-1 HI gas shell.
Well determined distances for the stars are an important parameter for this study, but unfortunately only one target (HD 147971) has an accurate Hipparcos trigonometric parallax measurement. For the remainder of the targets we present spectro-photometric distance estimates that have been derived using their spectral type, absolute magnitude and colour excess, as reported in the references listed in Table 1 for each star. The typical error for the majority of these derived distances is per cent (Hunter et al., 2006).
The spectroscopic observations were carried out during April 2006, June 2006 and July 2007 using the 1.0-m McLellan telescope at the Mt John Observatory in New Zealand. The HERCULES vacuum fibre-fed échelle spectrograph (Hearnshaw et al., 2002) was used with the 100 micron fibre and 50 micron slit to give a resolving power of ( km s-1). The data were recorded with a Fairchild 4k 4k CCD in a Spectral Instruments camera, and wavelength calibrations were obtained from thorium-argon hollow-cathode lamp spectra taken at the beginning and end of each night. The two spectral orders of interest were extracted from the raw CCD images using software routines written by J. Skuljan (University of Canterbury, Christchurch). Standard échelle reduction procedures were employed that included background and cosmic-ray subtraction, spectral order tracing and extraction, flat-fielding and wavelength calibration. For the case of the NaI D-line doublet order, each stellar spectrum was divided by that of the bright and nearby star Eri in order to remove the narrow telluric water vapor lines that contaminate this wavelength region. The majority of the stellar spectra were well-exposed with typical S/N ratios in excess of 25:1 (less for the CaII data), and all velocities subsequently reported in this paper are in the heliocentric frame of reference (for comparison, km s-1).
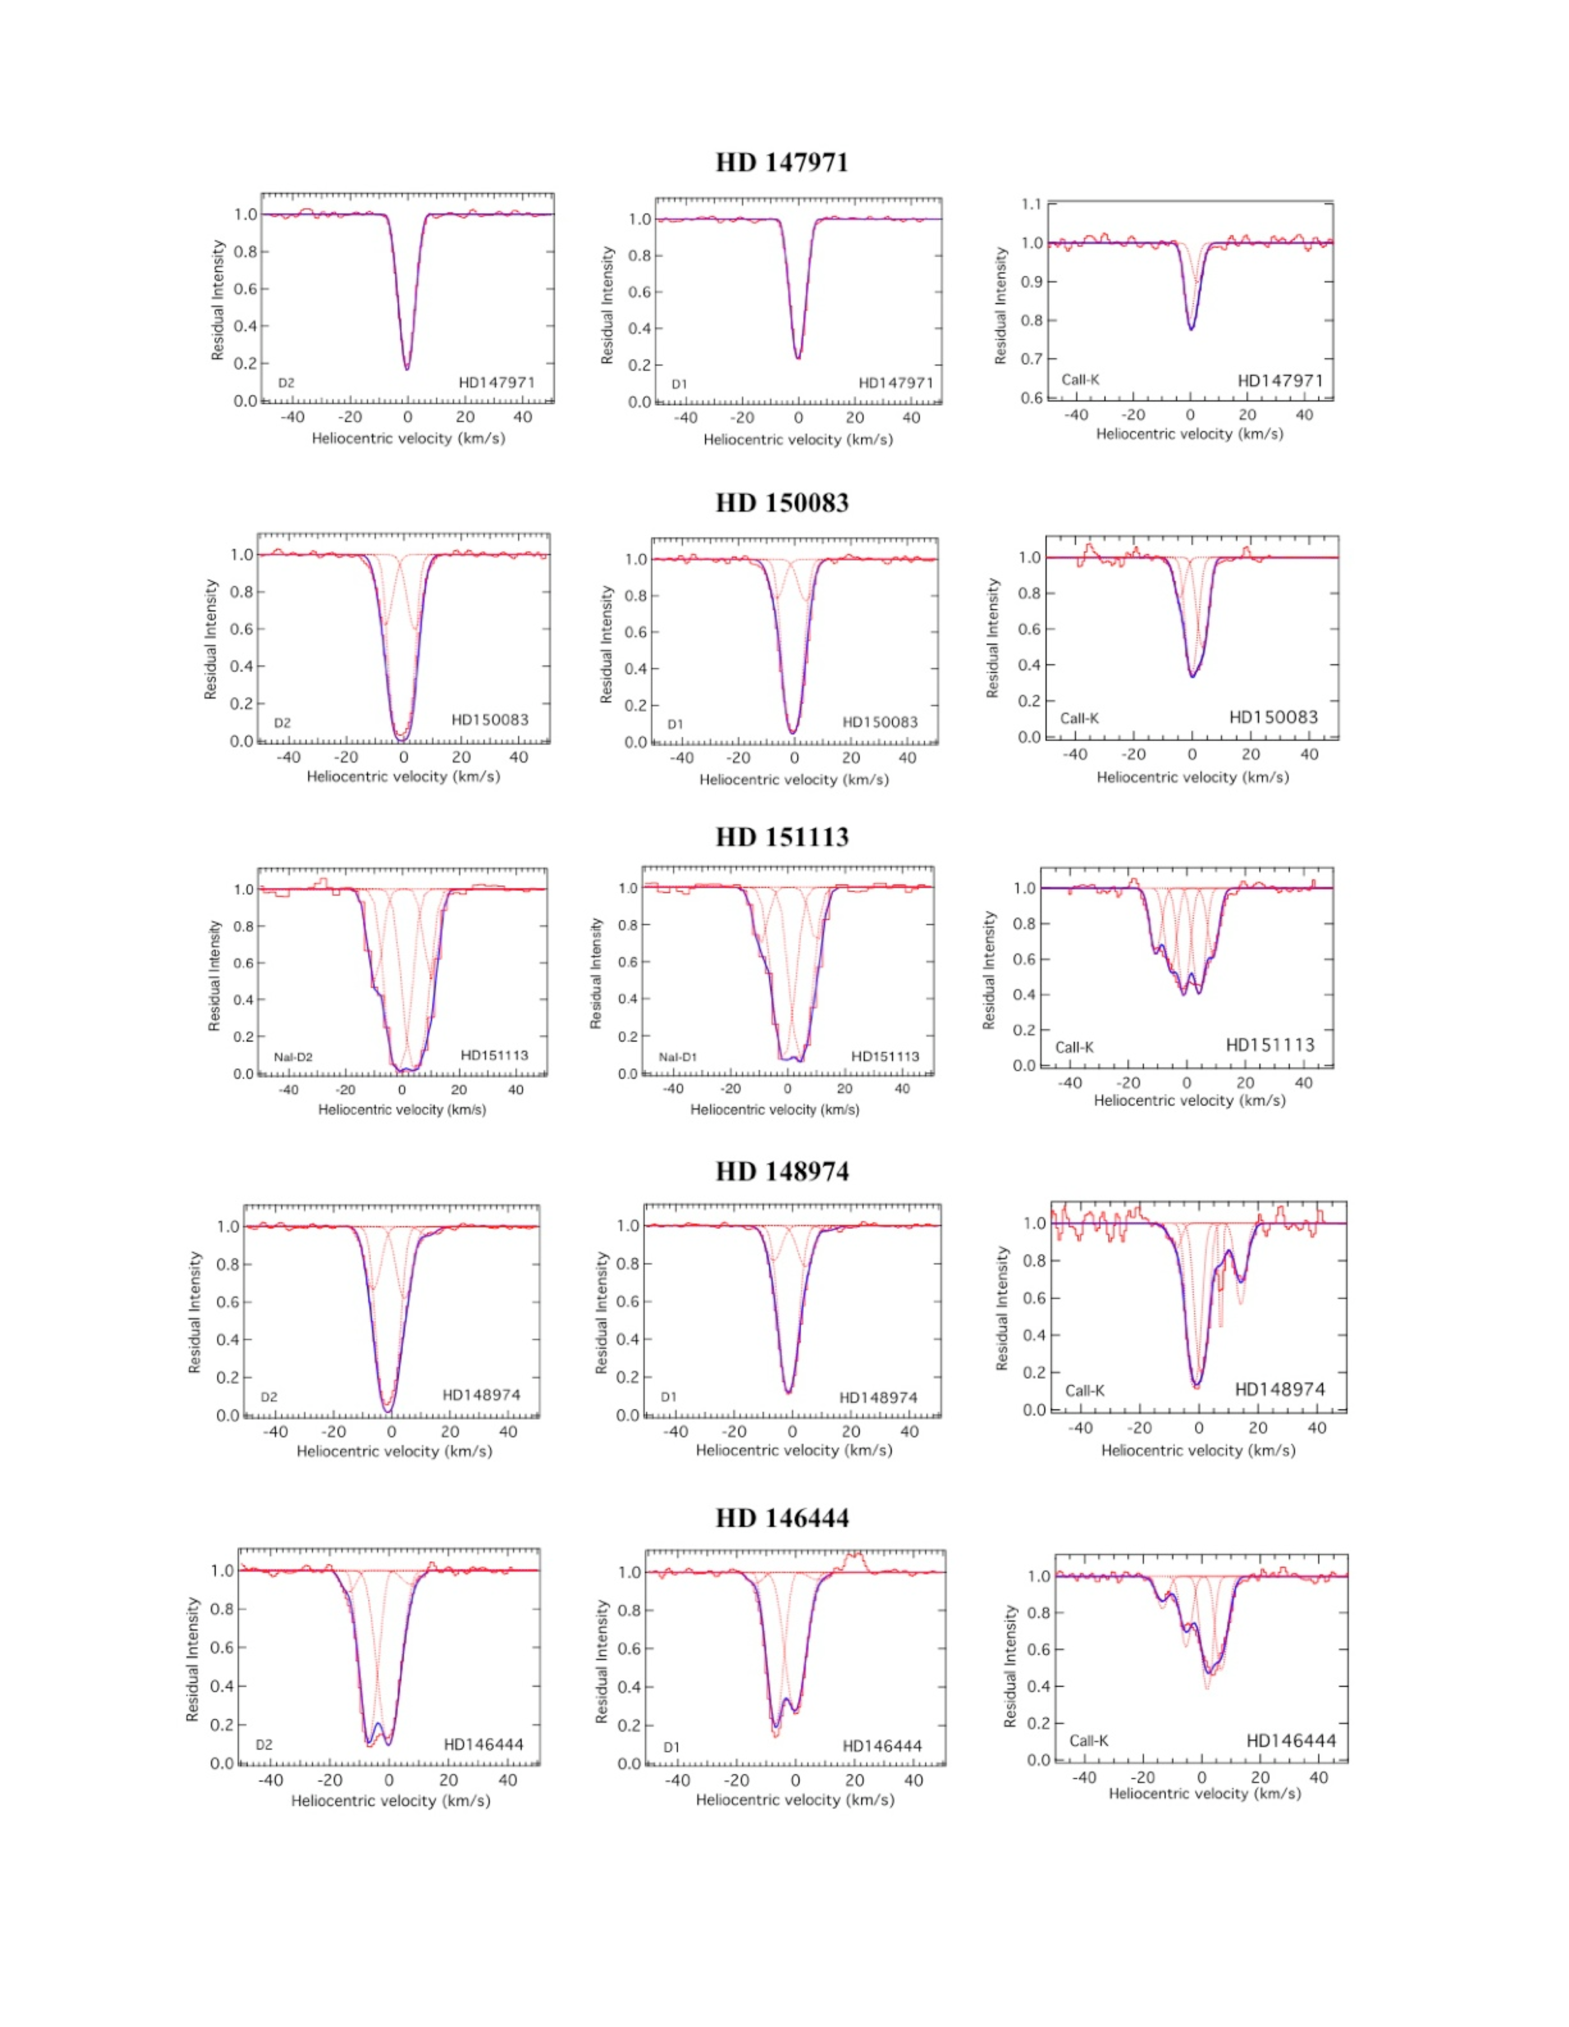
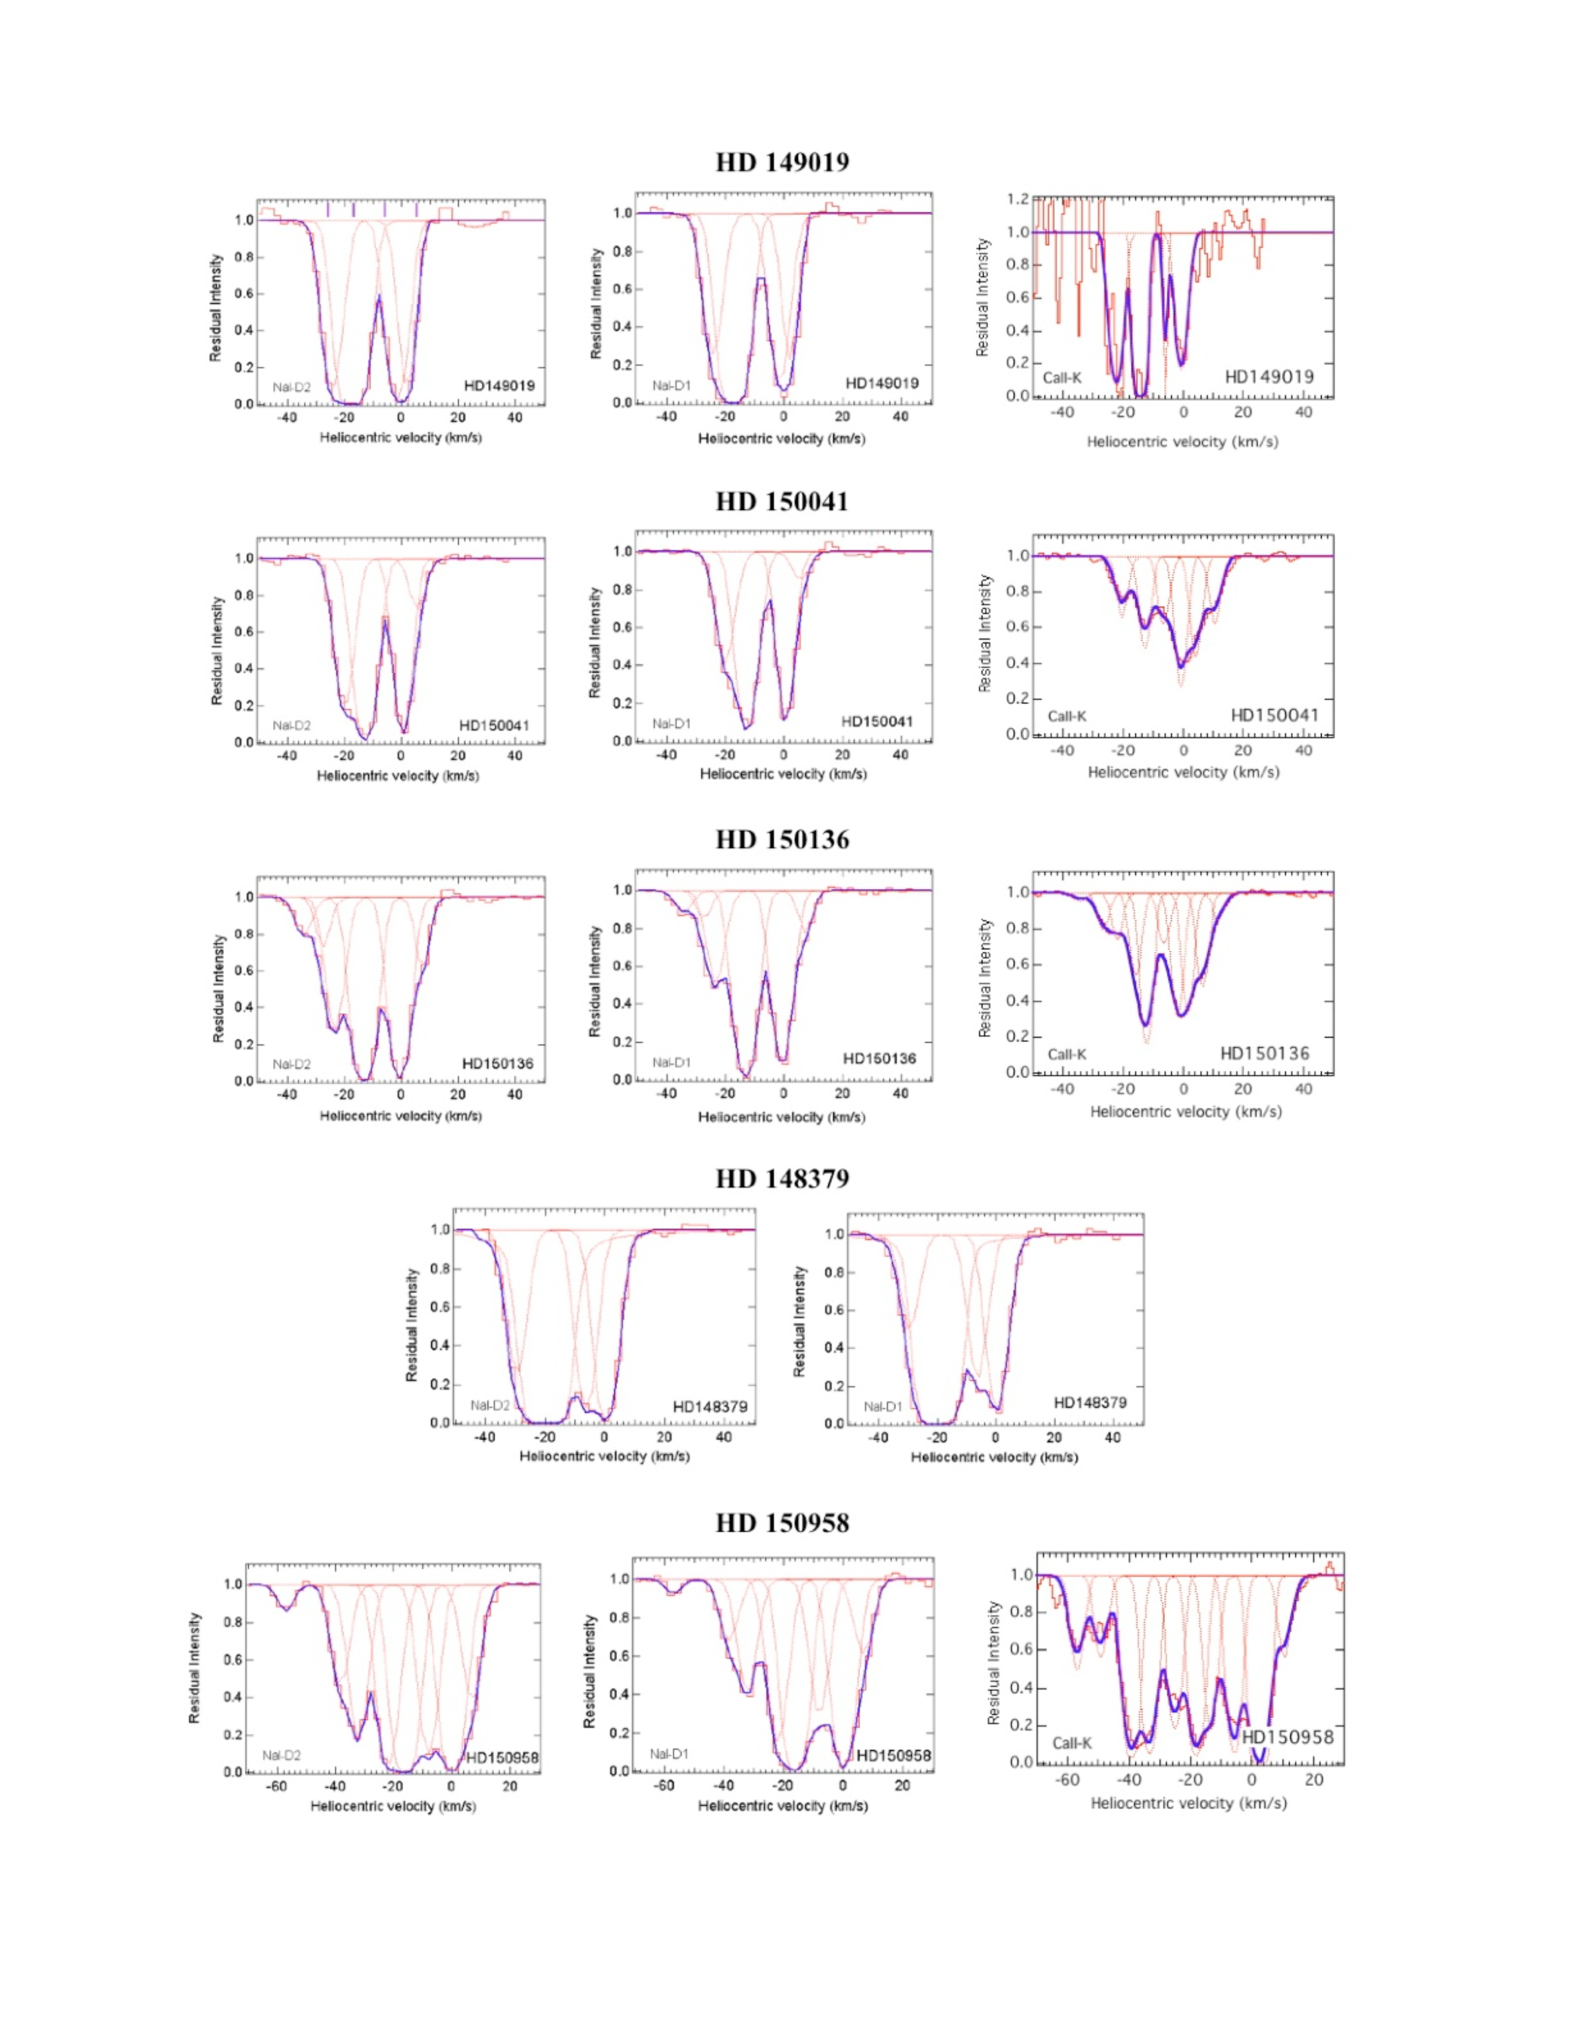
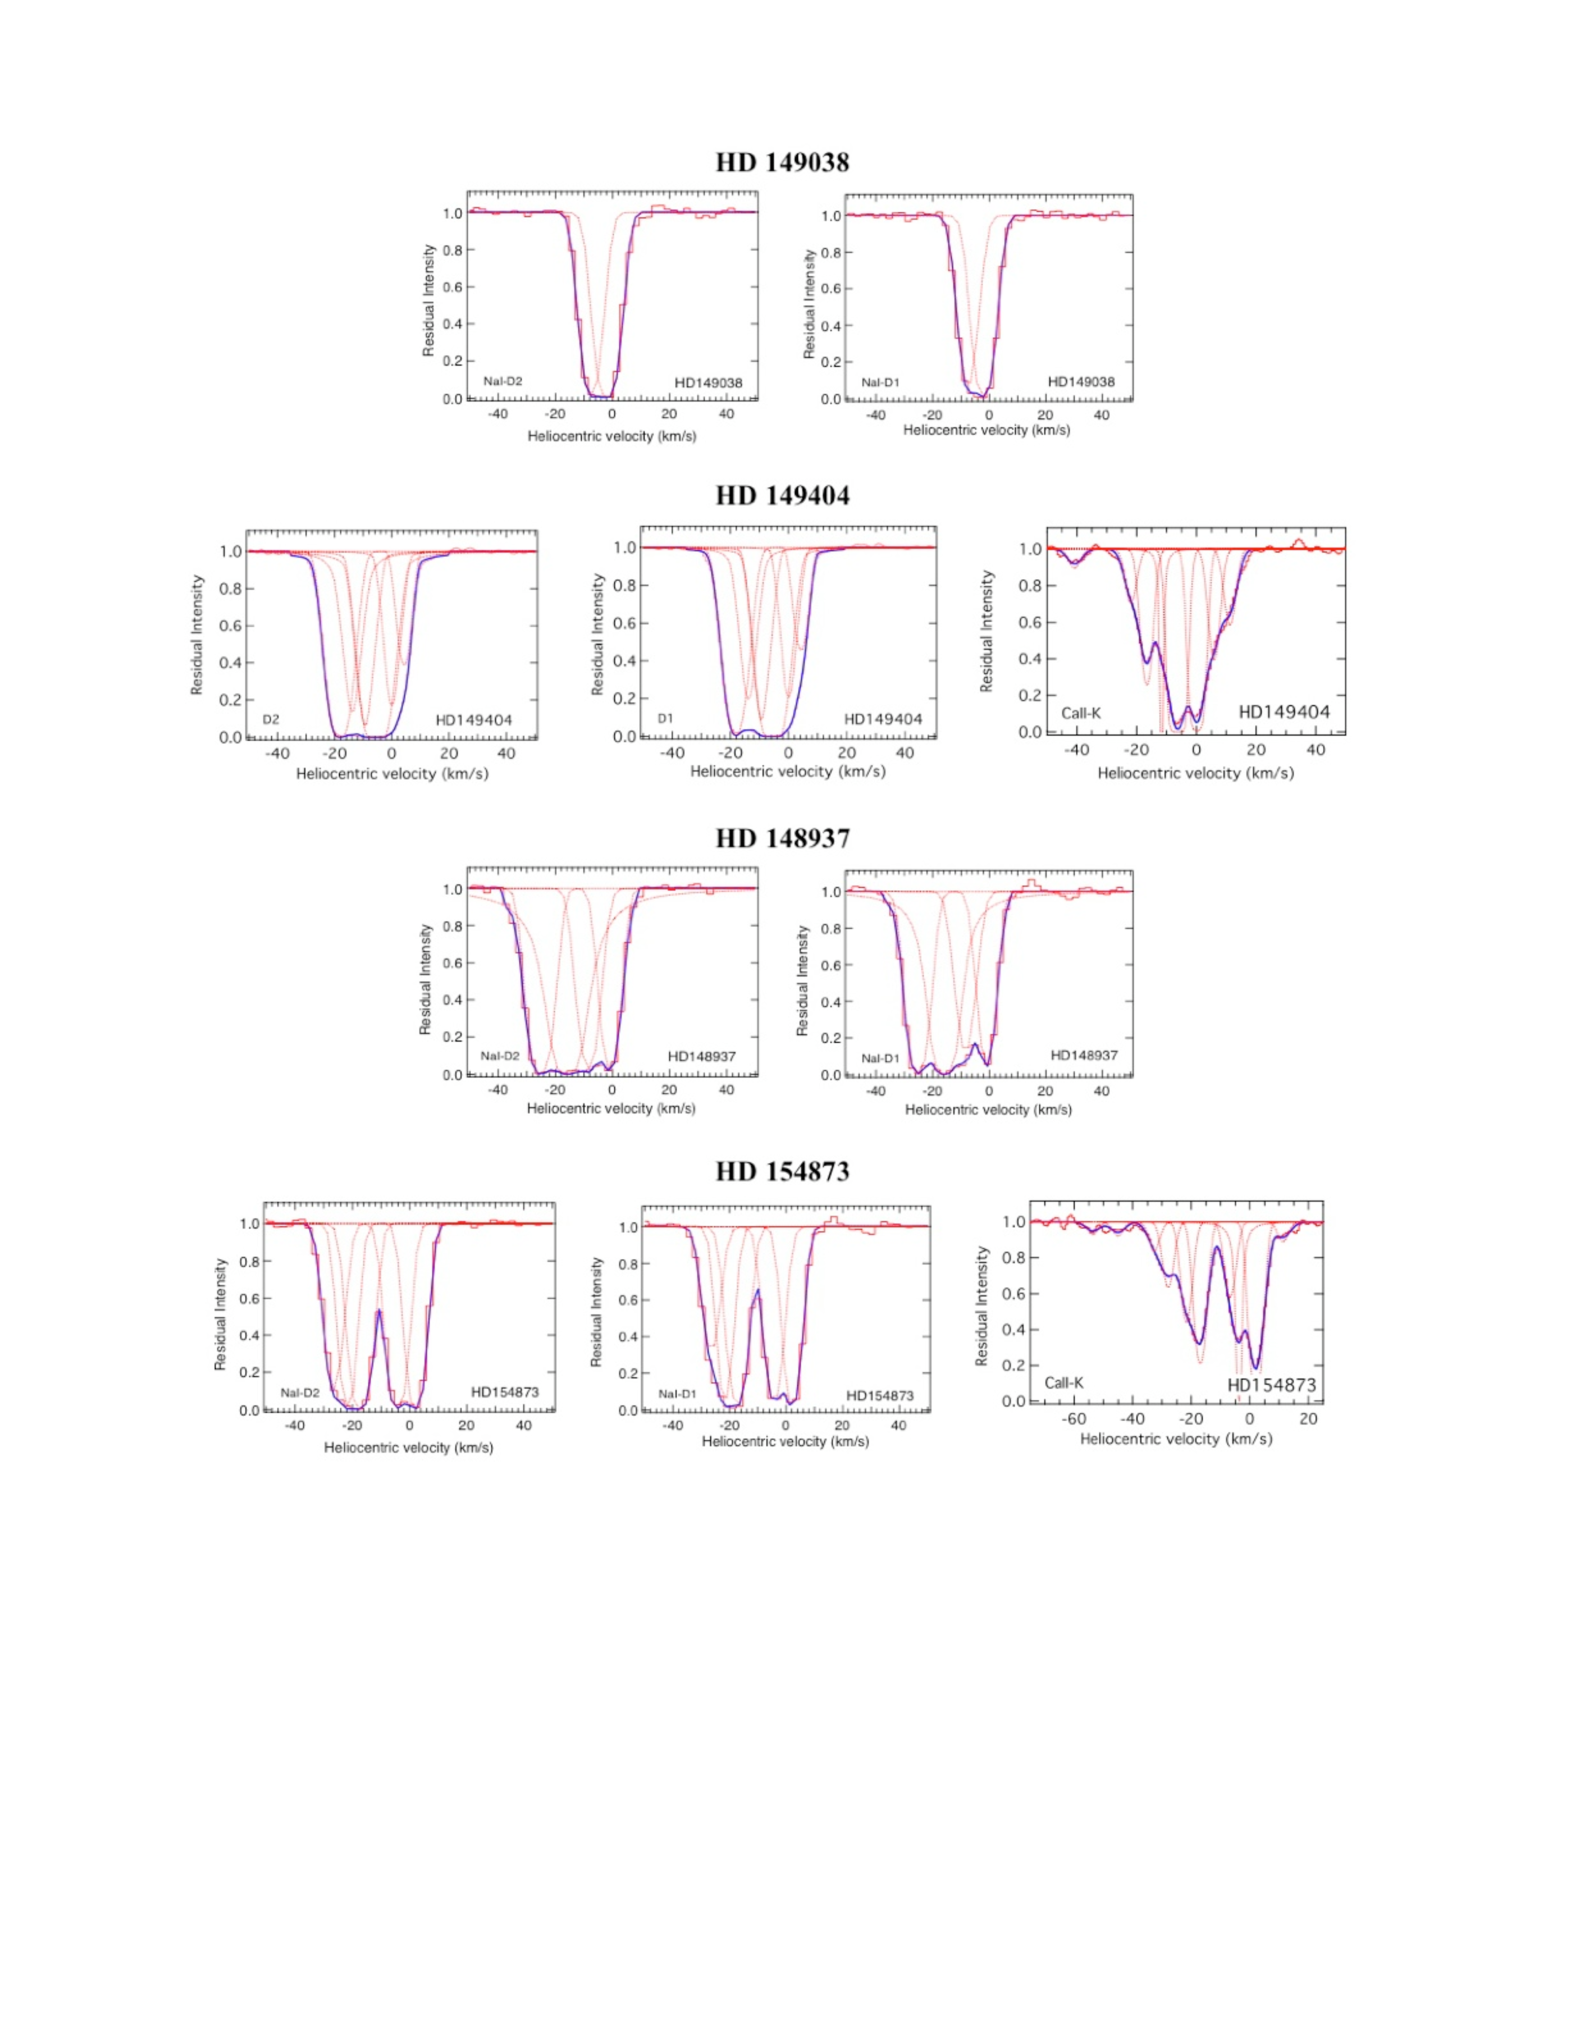
The interstellar absorption profiles of the two NaI D-lines and the CaII K-line were fit using a dedicated software package described in Sfeir et al. (1999). This fit process entailed determining the local stellar continua for each absorption line using a multi-order polynomial fitting procedure. The resultant residual intensity profiles, whose equivalent widths are listed in Table 1 (with typical measurement errors of per cent), were then fit with multiple gas cloud components, each with a theoretical best-fit of cloud component velocity (), cloud doppler velocity dispersion () and cloud component column density (). The CaII absorption profiles were less saturated than the NaI lines and were fit prior to the NaI lines for each sight-line. The CaII model fit was then used as a basis for the subsequent fitting of the NaI D-lines. Each model fit procedure used the number of cloud components that were statistically significant using the criterion given in Vallerga et al. (1993). The two NaI D-lines were fit simultaneously in order to better constrain the model fits, whereas each CaII K-line was fit independently. The resultant absorption model fit parameters for each star are listed in Table 2, and the individual fits superimposed on the data points are shown in Figures 2–4. We have also limited the maximum gas cloud temperatures (i.e. the derived -values) in the Na D-line fits to K and K for the CaII lines, in order to comply with the expected physical conditions in the diffuse ISM.
The low S/N ratio in the spectrum of HD 149019 at the CaII K-line means that the fit is probably over-interpreted. In that case knowledge of possible velocity components was gleaned from other distant stars and used to fit the line with the minimum number of components.
The line-fit procedure works well for unsaturated absorption components, but large errors can occur in the derived column densities for the central cores of highly saturated absorption lines. Unfortunately, since the majority of our targets lie along distant and high column density sight-lines, significant line saturation is present for cloud components with velocities in the to km s-1 range. However, when components reside in the (red or blue) wings of the absorption profiles their column densities are better constrained. Thus, for most of the absorption profiles, only the very central components cannot be fit with certainty and these components are identified as such in Table 2. Much of the following analysis of our observations fortunately relies on the velocities, and not the column densities, of the numerous absorption components.
| Star | Sp | ) | Distance | Reference | EW (D2) | EW (D1) | EW (CaII) | ||
|---|---|---|---|---|---|---|---|---|---|
| (pc) | mÅ | mÅ | mÅ | ||||||
| (1) HD 147971 | 4.5 | B4V | 0.09 | 123 | (1) | 115 | 100 | 18 | |
| (2) HD 150083 | 7.3 | B5III | 0.20 | 485 | (2) | 240 | 205 | 80 | |
| (3) HD 151113 | 6.7 | B5II/III | 0.17 | 570 | (3) | 405 | 335 | 145 | |
| (4) HD 148974 | 6.9 | A7III | 0.05 | 600 | (1) | 235 | 185 | 145 | |
| (5) HD 146444 | 7.6 | B2V | 0.25 | 800 | (3) | 285 | 235 | 105 | |
| (6) HD 149019 | 7.5 | A0I | 0.84 | 1108 | (4) | 605 | 560 | 235 | |
| (7) HD 150041 | 7.1 | B1/B2I | 0.39 | 1155 | (4) | 470 | 410 | 180 | |
| (8) HD 150136 | 5.7 | O3 | 0.46 | 1155 | (4) | 595 | 500 | 235 | |
| (9) HD 148379 | 5.4 | B1.5I | 0.61 | 1180 | (5) | 745 | 680 | - | |
| (10) HD 150958 | 7.3 | O6e | 0.61 | 1300 | (4) | 880 | 745 | - | |
| (11) HD 149038 | 4.9 | B0I | 0.31 | 1380 | (6) | 320 | 300 | - | |
| (12) HD 149404 | 5.5 | O9I | 0.66 | 1380 | (6) | 610 | 580 | 315 | |
| (13) HD 148937 | 6.8 | O6.5 | 0.65 | 1380 | (5) | 700 | 650 | - | |
| (14) HD 154873 | 6.7 | B1Ib | 0.47 | 1650 | (5) | 655 | 615 | 265 |
References. — (1) Perryman 1997; (2) Kaltcheva Georgiev 1992; (3) Kozoc 1985; (4) Kharchenko et al. 2005; (5) Hunter et al. 2006; (6) Crawford, Barlow and Blades 1989;
| I.D. | Star | NaI/CaII | ||||||||
|---|---|---|---|---|---|---|---|---|---|---|
| km s-1 | (1010 cm-2) | km s-1 | (1010 cm-2) | |||||||
| 1 | HD 147971 | |||||||||
| …NaI… | …CaII… | +2.5 | 2.5 | 7 | - | |||||
| -0.3 | 2.9 | 130 | -0.2 | 2.4 | 15 | 8.7 | ||||
| 2 | HD 150083 | |||||||||
| …NaI… | +3.9 | 3.3 | 335 | …CaII… | +3.5 | 2.5 | 47 | 0.7 | ||
| -0.7 | 3.3 | 390 | -0.2 | 2.4 | 70 | 5.6 | ||||
| -6.5 | 3.3 | 30 | -4.4 | 2.5 | 17 | 1.8 | ||||
| 3 | HD 151113 | |||||||||
| …NaI… | +10.1 | 2.0 | 4410 | …CaII… | +9.5 | 2.4 | 33 | 1.3 | ||
| +4.6 | 3.3 | 445 | +4.2 | 2.5 | 60 | 7.4 | ||||
| -1.6 | 3.3 | 455 | -1.0 | 2.5 | 65.0 | 7.0 | ||||
| -5.6 | 2.5 | 40 | - | |||||||
| -9.7 | 2.2 | 45 | -10.8 | 2.5 | 32 | 1.4 | ||||
| 4 | HD 148974 | |||||||||
| …NaI… | +12.5 | 3.3 | 31 | …CaII… | +14.1 | 2.3 | 35 | 0.09 | ||
| +4.3 | 3.3 | 30 | +7.0 | 0.6 | 19 | 1.6 | ||||
| +1.0 | 2.5 | 110 | - | |||||||
| -1.4 | 3.3 | 265 | -1.8 | 2.5 | 140 | 1.9 | ||||
| -6.5 | 3.3 | 25 | -7.9 | 2.5 | 10 | 2.5 | ||||
| 5 | HD 146444 | |||||||||
| …NaI… | +7.3 | 2.5 | 61 | …CaII… | +6.8 | 2.5 | 48 | 0.1 | ||
| -0.1 | 3.3 | 210 | +1.5 | 2.5 | 65 | 3.2 | ||||
| -6.9 | 1.8 | 370 | -5.5 | 2.5 | 35 | 10.6 | ||||
| -13.8 | 1.3 | 8 | -13.3 | 2.4 | 13 | 0.6 | ||||
| 6 | HD 149019 | |||||||||
| …NaI… | +1.9 | 2.4 | 22040 | …CaII… | -0.5 | 2.5 | 120 | 1.8 | ||
| -1.6 | 3.3 | 370 | -5.0 | 0.5 | 60 | 6.2 | ||||
| -17.0 | 3.1 | 1000** | -15.0 | 1.7 | 860 | n/a | ||||
| -24.0 | 3.3 | 210 | -22.0 | 2.5 | 175 | 1.2 | ||||
| 7 | HD 150041 | |||||||||
| …NaI… | …CaII… | +10.5 | 2.5 | 32 | - | |||||
| +5.5 | 2.8 | 22 | +4.3 | 2.5 | 55 | 0.4 | ||||
| -6.5 | 2.5 | 32 | - | |||||||
| -12.5 | 3.3 | 550 | -12.8 | 2.5 | 48 | 1.1 | ||||
| -20.0 | 3.3 | 140 | -20.3 | 2.5 | 27 | 5.2 | ||||
| 8 | HD 150136 | |||||||||
| …NaI… | …CaII… | +11.7 | 2.5 | 10 | - | |||||
| +7.3 | 2.1 | 30 | +6.5 | 2.5 | 49 | 0.6 | ||||
| -0.5 | 3.1 | 465 | +1.5 | 2.5 | 70 | 6.6 | ||||
| -2.0 | 2.5 | 78 | - | |||||||
| -6.5 | 2.5 | 25 | - | |||||||
| -13.0 | 3.3 | 980** | -12.2 | 2.5 | 120 | 8.2** | ||||
| -16.0 | 2.5 | 40 | - | |||||||
| -23.5 | 3.3 | 100 | -22.0 | 2.5 | 20 | 5.0 | ||||
| -27.5 | 2.4 | 20 | -26.6 | 2.4 | 16 | 1.3 | ||||
| -34.0 | 2.4 | 3 | - | |||||||
| 9 | HD 148379 | |||||||||
| …NaI… | 0.3 | 3.3 | 460 | …CaII… | - | |||||
| -6.3 | 3.3 | 225 | - | |||||||
| -20.0 | 3.3 | 1000** | - | |||||||
| -29.5 | 3.3 | 105 | - | |||||||
| 10 | HD 150958 | |||||||||
| …NaI… | +7.0 | 3.3 | 75 | …CaII… | +10.0 | 2.6 | 50 | 1.5 | ||
| +1.0 | 3.3 | 905 | +2.5 | 2.5 | 705 | 1.3 | ||||
| -8.0 | 3.2 | 195 | -6.5 | 2.5 | 210 | 0.9 | ||||
| -12.5 | 2.6 | 125 | - | |||||||
| -16.0 | 2.7 | 1000** | -18.0 | 2.5 | 230 | - | ||||
| -23.0 | 3.3 | 315 | -24.5 | 2.5 | 125 | 2.5 | ||||
| -32.0 | 3.3 | 140 | -33.0 | 2.5 | 220 | 0.6 | ||||
| -38.5 | 3.3 | 58 | -39.0 | 2.5 | 265 | 0.2 | ||||
| -49.0 | 2.5 | 42 | - | |||||||
| -57.1 | 2.7 | 10 | -57.1 | 2.5 | 50 | 0.2 | ||||
| 11 | HD 149038 | |||||||||
| …NaI… | -1.9 | 3.2 | 990 | …CaII… | - | |||||
| -7.5 | 3.0 | 505 | - | |||||||
| 12 | HD 149404 | |||||||||
| …NaI… | …CaII… | +11.2 | 2.5 | 35 | - | |||||
| +4.5 | 1.1 | 255 | +5.9 | 2.5 | 60 | 4.3 | ||||
| +0.0 | 1.1 | 1000** | +0.2 | 2.5 | 345 | - | ||||
| -5.4 | 2.6 | 1000** | -6.4 | 2.5 | 680 | - | ||||
| -9.5 | 1.3 | 1000** | -11.5 | 2.5 | 1000** | - | ||||
| -14.5 | 0.8 | 1000** | -16.0 | 2.5 | 90 | - | ||||
| -18.5 | 3.2 | 1000*** | -21.5 | 2.5 | 25 | - | ||||
| -40.8 | 2.5 | 7.5 | - | |||||||
| 13 | HD 148937 | |||||||||
| …NaI… | -0.9 | 2.5 | 705 | …CaII… | - | |||||
| -8.5 | 3.3 | 355 | - | |||||||
| -16.0 | 1.8 | 1000** | - | |||||||
| -25.5 | 3.0 | 1000** | - | |||||||
| 14 | HD 154873 | |||||||||
| …NaI… | …CaII… | +11.5 | 2.5 | 8 | - | |||||
| +2.2 | 2.7 | 695 | +2.1 | 2.5 | 180 | 3.9 | ||||
| -4.5 | 3.1 | 470 | -4.0 | 0.5 | 1000** | 0.5** | ||||
| -7.0 | 2.5 | 36 | - | |||||||
| -17.0 | 3.3 | 575 | -17.0 | 2.5 | 105 | 5.5 | ||||
| -21.5 | 2.4 | 510 | -21.5 | 2.5 | 55 | 9.3 | ||||
| -26.5 | 3.3 | 165 | -28.0 | 2.5 | 30 | 5.5 | ||||
| -32.5 | 2.5 | 12 | - | |||||||
| -45.0 | 2.5 | 6 | - | |||||||
| -53.5 | 2.5 | 5 | - | |||||||
| ** = saturated absorption component | ||||||||||
3 Discussion
Whiteoak Gardner (1985) presented high resolution (but low signal-to-noise) NaI absorption data towards 28 stars in the direction of Ara OB1 and have listed three pervasive absorption components at heliocentric velocities of , and 0 km s-1. Tentative evidence was presented that associated both of the negative velocity components with that of the Ara OB1 association, such that the gas clouds were placed within the Carina-Sagittarius arm at a distance of kpc. However, recent HI (McClure-Griffiths et al., 2002) and H (Georgelin et al., 1996) measurements suggest a kinematic distance kpc for these negative velocity gas components, thus apparently precluding a physical link with Ara OB1. Hence, in this present work, we wish better to identify the distances associated with the major interstellar gas clouds seen in this galactic direction by using new NaI and CaII absorption data, taken in the context of data recorded since 1985 at other wavelengths. First we follow the example of Whiteoak Gardner (1985) by plotting the velocity extent of the absorption detected towards each target, with the stars ordered according to their distance, in Figure 5. This plot reveals four broadly distinct groupings of absorption components that cover the following velocity ranges towards the following targets: km s km s-1 (stars 1 2), km s km s-1 (stars 3, 4, 5 and 11), km s km s-1 (stars 6, 7, 8, 9, 12 and 13) and km s km s-1 (stars 10 and 14). We now discuss each of these absorption groupings (which we associated with separate interstellar gas clouds) in order to determine their respective distances and also to comment on the physical conditions of the ISM present over these four absorption velocity intervals.
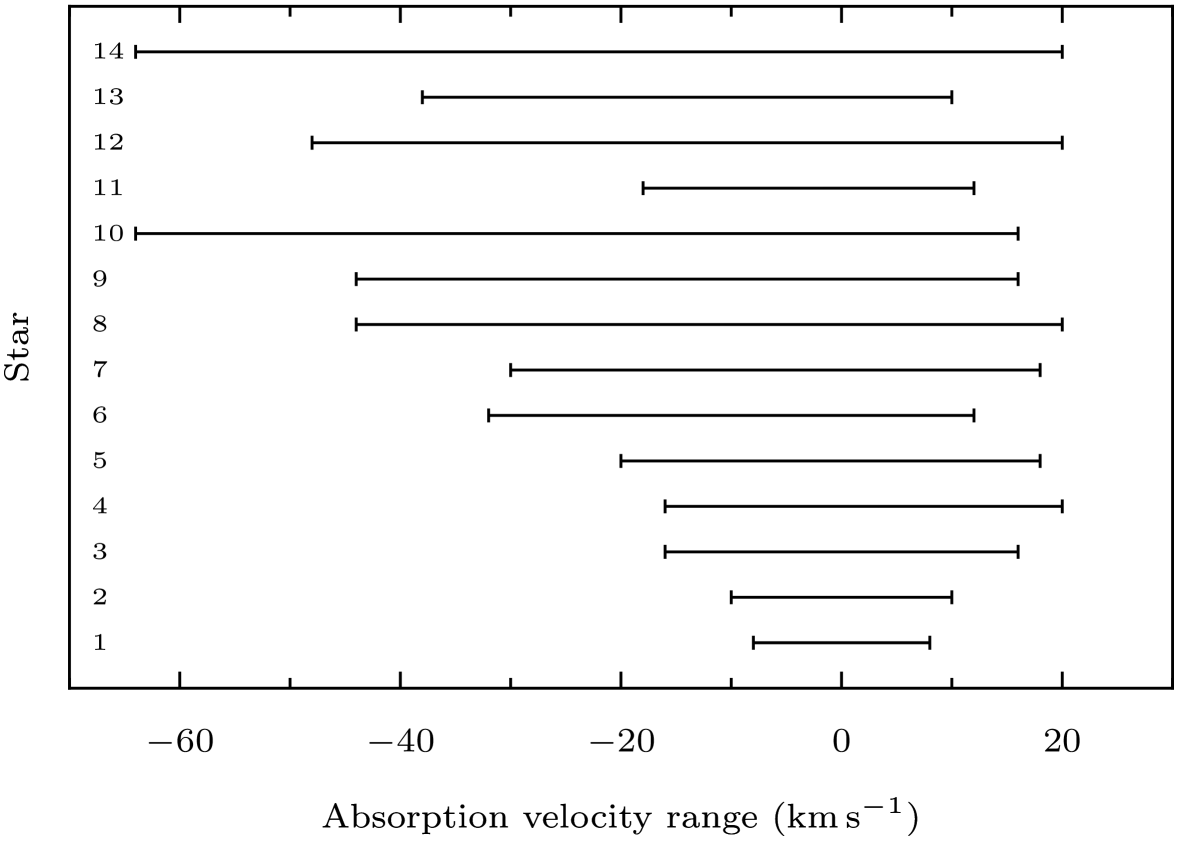
3.1 Local interstellar gas ( km s km s-1)
Absorption detected along the two sight-lines with distances pc (HD 147971 and HD 150083) spans the smallest range of velocities in our sample. A similar restricted range of absorption is shown in the NaI absorption profile of HD 150168 ( pc) by Whiteoak Gardner (1985). These three sight-lines sample gas primarily associated with the local interstellar medium, which consists of a very low density region to a distance of pc (i.e. the Local Bubble cavity), which is then followed by a cold and dense neutral gas boundary (Lallement et al., 2003). For most galactic sight-lines the neutral boundary to the Local Bubble is defined by gas with a NaI D2-line equivalent width of mÅ Sfeir et al. (1999). Thus, the direction in the galactic plane towards is somewhat anomalous in that the neutral boundary gas is about twice as dense as that found in most other directions. We derive a ratio (NaI)/(CaII) of 5.9 for the combined gas components detected towards HD 147971, which is a typical value widely found for gas in the diffuse ( cm-3) ISM (Hobbs, 1976).
Interestingly, the N(NaI) column density towards HD 147971 and HD 150083 differs by only a factor of over the pc interstellar path length between the two stars, whereas the corresponding (CaII) column density increases by twice this amount over the same distance. This suggests that there is a significant amount of warm and ionized gas that fills this interstellar sight-line. This may be explained by the presence of a very low neutral gas density region of the ISM termed the Lupus-Norma interstellar cavity (Welsh et al., 1994), whose approximate dimensions to a distance of 300 pc have been mapped by Lallement et al. (2003).
3.2 Gas with velocities km s km s-1
The NaI and CaII spectra of the three stars with distances in the 570–800 pc range (HD 151113, HD 148974 and HD 146444) reveal additional absorption components originating from gas with velocities in the to km s-1 and to km s-1 ranges. We note that gas with similar NaI and CaII component velocities of to km s-1 has also been detected in absorption towards many of the stars of the Sco OB1 association, but only towards those with distances pc (Crawford et al., 1989). Similarly, Whiteoak Gardner (1985) have detected NaI absorption with a velocity component of km s-1 towards HD 150041 ( pc). In addition, HI and H emission have also been detected at km s-1 over most of this region by Rizzo Bajaja (1994) and Georgelin et al. (1996). Taken collectively, these data suggest that a widespread interstellar gas cloud(s) with a velocity of km s-1 is present in the direction of Ara OB1 at a distance of pc. Using the well defined absorption component at -13.5 km s-1 detected towards HD 146444 as being representative of this gas, we derive a ratio (NaI)/(CaII) of 0.6. Since the cloud velocity is quite low we do not attribute such a low ratio value to the effects of grain destruction by interstellar shocks (Routley Spitzer, 1952), but instead we favor an overabundance of (warmer and more ionized) CaII bearing gas in this direction.
We also note the presence of gas with velocities km s-1, which is also only detected for sight-lines with distances pc. The pervasive nature of this positive velocity cloud component could mean that its origin may be linked to that of the km s-1 component in the form of it being the receding wall of a shell of expanding gas. We note that the HI velocity profile of GSH 337+0005 observed by McClure-Griffiths et al. (2002) gives a foreground shell wall velocity of km s-1 and a rear wall velocity of km s-1. Given the general similarity in velocity and distance of the presently detected gas cloud with that of the GSH 337+0005 shell, we tentatively assign a distance of 530 pc for this feature. This would preclude its physical association with the more distant Ara OB1 cluster and place it closer to the inter-arm region, or perhaps even the Lupus-Norma cavity (if it extends to this distance).
McClure-Griffiths et al. (2002) have proposed a simple model for the production of large galactic HI shells in which the combined effects of the spiral arm density gradient and their inherent migration velocity could lead to a spatial offset of these shells away from the spiral shock and into the inter-arm region. Since the galactic inter-arm gas density is very low, this enables migrating HI shells to expand to large sizes without the need for a local energy source such as that of stellar winds and/or supernovae. Thus, the notion that the large angular size of GSH 337+0005 is due to the expansion of a gas cloud into a low density (inter-arm) region of the Galaxy rather than it being due to the influence of local stellar winds and/or a supernova event, would now seem to be supported.
Finally, the value of reddening, , found for HD 148974 seems anomalously low for a star at a distance of pc, but the detection of strong CaII absorption with a velocity km s-1 is consistent with its placement at pc. The apparent lack of interstellar dust in this sight-line (and the apparent over-abundance of CaII gas) could be due to the presence of the foreground Lupus-Norma interstellar cavity mentioned previously.
3.3 Gas with velocities km s km s-1
All of our targets with distances kpc, except HD 149308, have additional NaI and CaII absorption features that span the to km s-1 velocity range. Crawford et al. (1989) have also detected absorption components with similar velocities towards all stars with distances pc in sight-lines towards the Sco OB1 association, which is close in direction, and Whiteoak Gardner (1985) also detect NaI absorption at these velocities towards Ara OB1 stars with distances kpc. Rizzo Bajaja (1994) reported on the detection of a large HI shell towards Ara OB1 with a central velocity of km s-1, which may be associated with that of H emission that has been detected with a similar velocity over the whole of this region by Georgelin et al. (1996). Although Rizzo Bajaja (1994) derive a kinematic distance of 2500 pc for this gas shell, all of the aforementioned absorption data favour a much closer distance of 1 kpc. This would then place this highly negative velocity gas at a distance similar to that of the Ara OB1 association, whose central stellar cluster of NGC 6193 has an average heliocentric radial velocity of km s-1 (Arnal et al., 1988). The similarity in these velocities between the gas and the stellar motion strongly suggests that the cluster stars may presently be embedded within, and traveling through, this interstellar cloud complex.
Surprisingly, no high negative velocity absorption was detected towards HD 149308 ( pc). We note that its reddening value of is what one might expect from a star of distance pc. Crawford et al. (1989) has raised the question that this star may be under-luminous, and if so then its distance could be as small as 400 pc. This would then explain the simple absorption spectrum that we have presently recorded.
3.4 Gas with velocities km s km s-1
We have detected fast moving gas with a velocity spanning the to km s-1 range towards only two targets, HD 154873 and HD 150958. The velocity of this gas is about 22 km s-1 more negative than the radial velocity of the Ara OB1 cluster stars and thus this expanding interstellar cloud could be physically linked to the stellar winds emerging from the central stellar cluster. Recent X-ray observations of the nucleus of NGC 6193 by Skinner et al. (2005) have revealed the O3-type star, HD 150136, to be one of the most luminous X-ray sources known, producing a significant shocked stellar wind that strongly influences the ambient ISM. However, absorbing gas with a velocity in the to km s-1 range was not detected towards this star, thus suggesting that this interstellar feature may be located at a distance beyond that of HD 150136 ( pc). We also note that NaI and CaII absorption components with a similar velocity have been observed towards many stars in the more distant (1900 pc), but close in direction, Sco OB1 association by Crawford et al. (1989). Similarly, Whiteoak Gardner (1985) only detected gas with this absorption velocity towards HD 151018 and 10941, whose estimated distances are 3 kpc and 2.2 kpc respectively. Given the measure of the uncertainties in the derived distances towards all of the target stars which have absorption at this highly negative velocity, we tentatively place a minimum distance to this gas cloud of 1.5–1.8 kpc.
A NaI/CaII ratio of 0.2 is found for the absorption component observed at km s-1 towards HD 150958. This ratio value is typical for interstellar gas clouds with km s-1 and has been interpreted as interstellar grain material returning to the gas through sputtering caused by interstellar shocks (Siluk Silk, 1974). The origin of this highly negative velocity interstellar feature is uncertain, given that its derived distance places it beyond that of Ara OB1. Although the cloud’s distance is more compatible with that of the Sco OB1 cluster, for a projected size of on the sky (i.e. the distance between HD 154873 and HD 150958) its equivalent diameter of pc would seem too large for a cloud to be created by stellar winds alone. We believe instead that a more likely explanation is that we have observed gas with serendipitously similar absorption velocities that are not physically associated over such a large area of the sky.
4 Conclusion
We have made high resolution absorption measurements of the NaI and/or CaII lines towards 14 early-type stars in the galactic direction of the Ara OB1 cluster, which is thought to lie at a distance of pc. The interstellar sight-line to this region is complex, consisting of many gas clouds with velocities ranging from to km s-1. Previous radio emission and ground-based absorption measurements were in disagreement as to the distances to these clouds, particularly that of the large GSH 337+0005 HI shell.
Our new measurements allow the observed line-profiles to be split into four distinct groupings of absorption velocity. For gas with absorption covering the velocity range km s km s-1, we can identify the observed absorption with local gas belonging to the Lupus-Norma interstellar cavity located a distance of between 100 and 485 pc. Gas with absorption velocities spanning the range km s km s-1 is only detected towards stars with distances of 570–800 pc. We identify the angularly large interstellar absorption feature at km s-1 with the expanding HI shell called GSH 337+0005, which is now firmly placed at a distance of pc.
Gas with absorption velocities in the range km s km s-1 is only detected towards stars with distances kpc, which places this gas at a similar distance to that of the Ara OB1 stellar cluster. The similarity between the radial velocity of the stellar cluster and that of the absorbing gas suggests that the cluster stars may be presently embedded within, and traveling through, this interstellar cloud complex. Absorption at velocities km s-1 is seen towards only two stars, HD 154873 and HD 150958, both of which have distances pc. Although the observed NaI/CaII ratio for this component is consistent with the presence of interstellar (stellar wind-driven) shocks, we believe that it is unlikely that this highly negative velocity gas is physically associated with the Ara OB1 cluster itself, and its origin may be linked to the more distant (and larger) Sco OB1 cluster.
Acknowledgements
We gratefully acknowledge the staff at the Mt John Observatory for their help in making these observations possible. BYW acknowledges funding from NSF grant AST-0507244.
Figure 1 was produced using data from the Southern Galactic Plane Survey (McClure-Griffiths et al., 2005).
This research has made use of the SIMBAD
database, operated at CDS, Strasbourg, France.
This research has made use of the VizieR database (Ochsenbein et al., 2000), operated at CDS, Strasbourg, France.
References
- Arnal, May Romero (2003) Arnal, E., May, J. and Romero, G., 2003, Astron. Astrophys., 412, 431
- Arnal et al. (1987) Arnal, E. et al., 1987, Astron. Astrophys., 174, 78
- Arnal et al. (1988) Arnal, M. et al., 1988, Publ. Astron. Soc. Pac., 100, 1076
- Crawford et al. (1989) Crawford, I., Barlow, M. and Blades, J., 1989, Astrophys. J., 336, 212
- Georgelin et al. (1996) Georgelin, Y., Russeil, D., Marcelin, M. et al., 1996, Astron. Astrophys. Suppl. Ser., 120, 41
- Hearnshaw et al. (2002) Hearnshaw, J. B., Barnes, S. I., Kershaw, G. M., Frost, N., Graham, G. Ritchie, R. and Nankivell, G. R., 2002, Exper. Astron., 13, 59
- Herbst Havlen (1977) Herbst, W. and Havlen, R., 1977, Astron. Astrophys. Suppl. Ser., 30,279
- Hobbs (1976) Hobbs, L.M., Astrophys. J., 206, L117
- Hunter et al. (2006) Hunter, I., Smoker, J., Keenan, F. et al., 2006, Mon. Not. R. Astron. Soc., 367, 1478
- Kharchenko et al. (2005) Kharchenko, N., Piskunov, A., Roser, S. et al., 2005, Astron. Astrophys., 438, 1163
- Kozok (1985) Kozok, J., 1985, Astron. Astrophys. Suppl. Ser., 62, 7
- Lallement et al. (2003) Lallement, R., Welsh, B.Y., Vergely, J. et al., 2003, Astron. Astrophys., 411, 447
- McClure-Griffiths et al. (2002) McClure-Griffiths, N., Dickey, J., Gaensler, B. and Green, A., 2002, Astrophys. J., 578, 176
- McClure-Griffiths et al. (2005) McClure-Griffiths, N., Dickey, J., Gaensler, B., Green, A., Haverkorn, M. and Strasser, S., 2005, Astrophys. J. Suppl. Ser., 158, 178
- Ochsenbein et al. (2000) Ochsenbein, F., Bauer, P. and Marcout J., 2000, Astron. Astrophys. Suppl. Ser., 143, 221
- Perryman (1997) Perryman, M., 1997, Astron. Astrophys., 323, L49
- Rizzo Bajaja (1994) Rizzo, J. and Bajaja, E., 1994, Astron. Astrophys., 289, 922
- Routley Spitzer (1952) Routley, P. and Spitzer, L., 1952, Astrophys. J., 115, 227
- Sfeir et al. (1999) Sfeir, D., Lallement, R., Crifo, F. and Welsh, B.Y., 1999, Astron. Astrophys., 346, 785
- Siluk Silk (1974) Siluk, R. and Silk, J., 1974, Astrophys. J., 192, 51
- Skinner et al. (2005) Skinner, S., Zhekov, S., Palla, F. and Barbosa, C., 2005, Mon. Not. R. Astron. Soc., 361, 191
- Vallerga et al. (1993) Vallerga, J., Vedder, P., Craig, N. and Welsh, B.Y., 1993, Astrophys. J., 411, 729
- Waldhausen, Martinez Feinstein (1999) Waldhausen, S., Martinez, R. and Feinstein, C., 1999, Astrophys. J., 117, 2882
- Welsh et al. (1994) Welsh, B.Y., Craig, N., Vedder, P. and Vallerga, J., 1994, Astrophys. J., 437, 638
- Whiteoak Gardner (1985) Whiteoak, J. and Gardner, F., 1985, Proc. ASA, 6, 164