The origin of dust polarization in the Orion Bar
Abstract
The linear polarization of thermal dust emission provides a powerful tool to probe interstellar and circumstellar magnetic fields, because aspherical grains tend to align themselves with magnetic field lines. While the Radiative Alignment Torque (RAT) mechanism provides a theoretical framework to this phenomenon, some aspects of this alignment mechanism still need to be quantitatively tested. One such aspect is the possibility that the reference alignment direction changes from the magnetic field ("-RAT ") to the radiation field k-vector ("-RAT ") in areas of strong radiation fields. We investigate this transition toward the Orion Bar PDR, using multi-wavelength SOFIA HAWC+ dust polarization observations. The polarization angle maps show that the radiation field direction is on average not the preferred grain alignment axis. We constrain the grain sizes for which the transition from -RAT to -RAT occur in the Orion Bar (grains 0.1 m toward the most irradiated locations), and explore the radiatively driven rotational disruption that may take place in the high-radiation environment of the Bar for large grains. While the grains susceptible to rotational disruption should be in supra-thermal rotation and aligned with the magnetic field, -RAT aligned grains would rotate at thermal velocities. We find that the grain size at which the alignment shifts from -RAT to -RAT corresponds to grains too large to survive the rotational disruption. Therefore, we expect a large fraction of grains to be aligned at supra-thermal rotation with the magnetic field, and potentially be subject to rotational disruption depending on their tensile strength.
Subject headings:
ISM: photon-dominated region (PDR) - ISM: magnetic fields -ISM: dust, extinction - polarization – radiative transfer, , , , , , , , , ,
I. Introduction
Photodissociation, or photon-dominated, regions (PDRs) designate the regions of the interstellar medium (ISM) intensively affected by the radiative energy produced by close-by massive stars (Tielens & Hollenbach, 1985a). A PDR has a layered structure consisting of the transition between a hot plasma gas to the molecular region of the parental cloud. Located at the edges of high-mass star formation regions, PDRs harbor a variety of radiation driven chemical and physical processes (for a recent review see Wolfire et al. 2022, and references therein), in which interstellar dust grains have major roles. Small and large grains absorb part of the intense far-UV (FUV) radiation from O and B stars and re-radiate it as infra-red (IR) continuum emission. Very small grains and large molecules also heat the gas via the photoelectric effect (Bakes & Tielens, 1994; Weingartner & Draine, 2001). In addition, H2 formation on dust grain surfaces are activated in such irradiated regions (Le Bourlot et al., 2012; Andersson et al., 2013; Bron et al., 2014; Jones & Habart, 2015).
Understanding the physical processes acting on dust grains in PDRs enable us to constrain how the dust properties vary in such environments, which in turn affect the efficiency of the mechanisms dictating the evolution of PDRs. Multi-wavelength photometric studies have already constrained the formation and destruction of nano-grains in PDRs (Arab et al., 2012; Van De Putte et al., 2020; Schirmer et al., 2022). However, the properties of large dust grains (i.e., nm) are harder to constrain using only the total intensity of the dust thermal emission. Analyzing its linear polarization is a powerful tool to study those large grains. The focus of this paper is thus to investigate the polarized dust emission toward a well-studied PDR, in order to study the radiation-driven mechanisms acting on dust grains.
It is well established that interstellar continuum polarization is due to elongated dust grains aligned, generally, with the magnetic field (Hiltner, 1949; Andersson et al., 2015). A number of physical processes are involved in the required grain alignment. Grains must both achieve "internal alignment", whereby their rotation axis is aligned with a grain symmetry axis (ensuring a constant projection of the individual grain shape) and "external alignment", whereby the ensemble of grains align along a common, external, direction - usually the local magnetic field. Both of these processes rely on paramagnetic effects in the grain bulk, in which the rotation will flip some of the free spins (this is known as the "Barnett effect"; Purcell 1979). This is the inverse of the Einstein-de Haas effect, well-known in laboratory physics (Einstein & de Haas, 1915). An asymmetric grain rotating around a non-symmetry axis will experience nutation. If this nutation is rapid enough the Barnett effect will not achieve a steady state but will cause energy dissipation (Purcell, 1979). Under angular momentum conservation the lowest energy state of a rotating grain occurs when the angular momentum axis is parallel to the grain’s axis of maximum inertia (smallest axis). Hence Barnett relaxation leads to efficient internal alignment of paramagnetic grains111Nuclear and inelastic relaxation effects also play an important role in the alignment of dust grains (Lazarian & Draine, 1999; Lazarian & Efroimsky, 1999). Because quantum spins carry both angular momenta and magnetic moments, in steady state the Barnett effect causes magnetization of these grains. The interaction of this induced magnetization and an external field then leads to the external alignment.
Both of these effects rely on the rapid rotation of the grain. This is now understood to be accomplished through the interaction of the grain with an anisotropic radiation field, described by the Radiative Alignment Torque (RAT) theory (Dolginov & Mitrofanov, 1976; Draine & Weingartner, 1996, 1997; Lazarian & Hoang, 2007), in which the right- and left-hand circular polarization components of the radiation field scatter differentially on an aspherical grain. In most ISM cases the grains align and cause polarization relative to the magnetic field direction, so called “-RAT”. However, in the case of a strong anisotropic radiation field, RAT theory predicts that the alignment axis can change from the magnetic field to the radiation field (also called “-RAT”; Lazarian & Hoang, 2007; Tazaki et al., 2017; Hull et al., 2022). This effect is stronger for large grains and can affect large internally aligned grains located close to a strong radiation source, if rotating at thermal velocities. However, an intense radiation field can also trigger the RAdiative Torque Disruption mechanism (RATD, Hoang et al. 2019), which results in the fragmentation of grains. This occurs when the RAT-induced grain spin increases to such rotation speeds that the rotational energy overcomes its cohesion, or tensile strength, causing the grain to fragment. Within PDRs, our interests are two fold. First, we aim to predict the preferred axis of alignment in order to determine whether polarized dust emission preferentially traces the orientation of the magnetic field or the radiation field. Second, we study the effect of the intense irradiation on the population of aligned grains to ascertain whether the radiation contributes significantly to the evolution of dust toward PDRs.
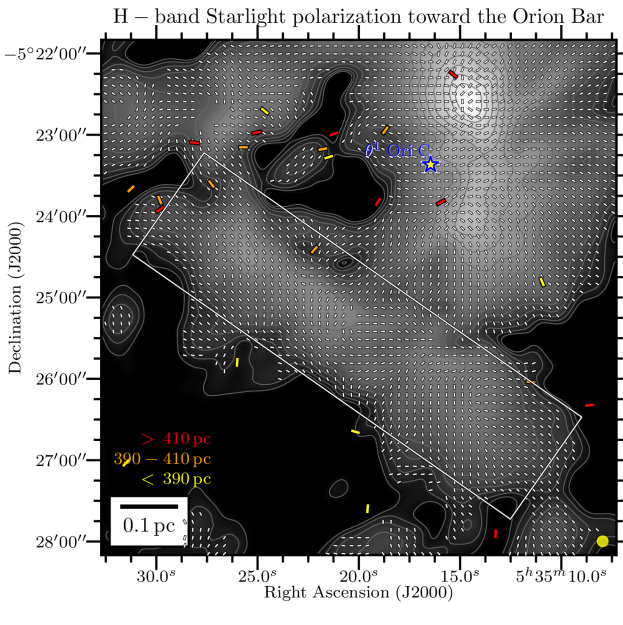
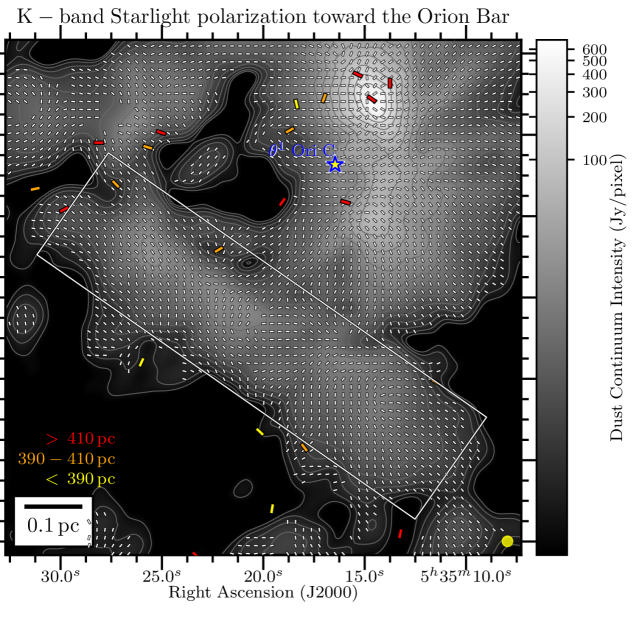
Our study focuses on the Orion Bar, a PDR illuminated over a very broad spectrum, including the FUV, by the O7-type star Ori C, the most massive and luminous member of the Trapezium young stellar cluster (O’dell, 2001). Located at 390 pc from us (Kounkel et al., 2017, 2018), the Orion Veil nebula forming the near-side shell around the H II region is strongly shaped by the intense ionizing radiation and strong winds from Ori C that expands into the background Orion Molecular Cloud (OMC) (Güdel et al., 2008; Pabst et al., 2019; Kavak et al., 2022). The Bar forms a denser part of the foreground edge of the Veil. The edge of the PDR is located at the ionization front (IF), across which the gas converts from fully ionized to fully neutral. The gas density in the atomic gas rises to cm-3, as indicated by the [OI] and [CII] forbidden line emission (Tielens & Hollenbach, 1985b; Tielens et al., 1993; Hogerheijde et al., 1995), which are the main cooling agents of the gas phase (Herrmann et al., 1997; Ossenkopf et al., 2013). The location of the dissociation front (DF), i.e., where the H/H2 transition takes place, depends on the attenuation of the dissociating FUV photons, which in turn depends on the dust FUV absorption cross-section. In the Bar, the DF is located at 10-15′′ from the IF (see Figure 1 of Habart et al. 2022), at mag (Allers et al., 2005). Mid-infrared (MIR) photometry using SOFIA/FORCAST (Salgado et al., 2016) suggests that the UV and infrared dust opacities in the region are low by a factor of 5 to 10 compared to the diffuse ISM. Grain growth through coagulation may be responsible for this decrease. More recently, near-infrared (NIR) and MIR observations of emission by polycyclic aromatic hydrocarbons (PAH) pointed toward an efficient destruction of small PAHs in this type of highly illuminated PDRs (Murga et al., 2022). Schirmer et al. (2022) also concluded that nano-grains would suffer strong depletion in the Bar, proposing a scenario where these grains are formed via the fragmentation of large grains due to radiative pressure-induced collisions, and then be destroyed by photo-dissociation processes. Far-infrared (FIR) photometry is primarily sensitive to larger and colder dust, and can also probe dust grain evolution, such as coagulation (Arab et al., 2012). Interpreting polarized dust emission as tracing the plane of the sky component of the magnetic field, FIR dust polarization studies concluded that the support by magnetic field energy (Chuss et al., 2019; Guerra et al., 2021) against the thermal expansion and mechanical feedback from Ori C (Pellegrini et al., 2009; Pabst et al., 2020) is such that it can play a role in the Bar dynamics.
This paper is structured as follows. In Section II, we present the multi-wavelength SOFIA/HAWC+ polarization observations of the Orion Bar and the data reduction steps. Results are presented in Section III, where we investigate variations of the polarization quantities as function of wavelength, spatial location, and environmental conditions. In Section IV, we perform a grain alignment timescale analysis using the available constraints on the environmental conditions toward the Orion Bar. We estimate for what grain size the -RAT to -RAT transition happens, the grain size parameter space potentially affected by RATD. Finally, in Section V, we discuss the characteristics of dust grains populating the Orion Bar PDR in light of the physical processes acting on them, i.e., radiative alignment torques and rotational disruption. We draw our conclusions in Section VI.
II. SOFIA/HAWC+ polarization observations
| HAWC+ Band | Band Center | Field of View | FWHM beam size | pixel size | Total exposure time | SOFIA archival ID |
|---|---|---|---|---|---|---|
| (m) | (′) | (′′) | (′′) | (s) | ||
| A | 53 | 1.4 1.7 | 4.9 | 1.2 | 445 | 08_0209 & 09_0037 |
| C | 89 | 2.1 2.7 | 7.8 | 2.0 | 3549 | 09_0107 |
| D | 154 | 3.7 4.6 | 13.6 | 3.4 | 254 | 08_0209 |
| E | 214 | 4.2 6.2 | 18.2 | 4.6 | 127 | 08_0209 |
Polarization data of the Orion Bar were obtained using the HAWC+ camera on board SOFIA (Vaillancourt et al., 2007; Dowell et al., 2010; Harper et al., 2018) in two observing modes under two separate programs. Standard chop-nod (C2N) observations of the full Orion Molecular Cloud-1 (OMC1) region have been presented in Chuss et al. (2019), gathering data acquired on flights 354, 355, 442, 444, 447, 450, 454, from December 2016 to September 2018, under the HAWC+ GTO programs 88_0005 and 07_0509 (PI: C.D. Dowell). To evaluate the possible impact of off-beam contamination of the polarization, and gain additional signal-to-noise in the Orion Bar region, we acquired additional observations of the Orion Bar, using the on-the-fly-map (OTFMAP) polarimetric mode (also called scan-pol mode throughout this paper), on 2020 September 11-12, Flight 686, and 2022 September 26-27, flight 919, under program 08_0209 and 09_0037 (PI: B-G Andersson). We also utilize archival OTFMAP observations from program 09_0107 (PI: A. Tielens).
Quantitative comparison and discussion between the polarization quantities obtained with the C2N mode and those obtained with the OTFMAP mode (using different data reduction techniques) are presented in Appendix A. However, throughout the body of this paper we only use the OTFMAP polarimetric maps for our results and analysis. Here, we briefly present the mapping and reduction methods of the OTFMAP observations used in this study. The general characteristics of the observations are presented in Table 1. We use the standard pixel size of the pipeline given the large dynamic range of OMC-1. We note that lower-resolution using Nyquist sampling during the map-making algorithm is a more optimal approach for fainter objects (Li et al., 2022; Lopez-Rodriguez et al., 2022a).
We reduced the data using the SOFIA data reduction pipeline222https://github.com/SOFIA-USRA/sofia_redux v.1.2.3 that integrates the CRUSH algorithm (Kovács, 2006, 2008). The OTFMAP polarimetric mode performs successive scans over a specific region (generally no larger than a few fields-of-view) parametrized with a Lissajous pattern. For each half-wave plate position angles (5.0∘, 27.5∘, 50.0∘, and 72.5∘), a scan is taken and reflective and transmissive data are collected as time series. Each set of four scans are reduced by the CRUSH algorithm, which estimates and removes the correlated atmospheric noise, removes the instrumental signals, performs gain estimations and noise weighting in an iterated framework.
While the main advantage of the OTFMAP mode over the C2N mode is the optimization of the total observing time to reach a given level of signal-to-noise ratio (SNR), it has some difficulties in recovering large-scale, diffuse, and faint emission (see Li et al. 2022; Lopez-Rodriguez et al. 2022a for a description of the OTFMAP mode of HAWC+). Indeed, a comparison by eye between the C2N data of OMC-1 (Chuss et al., 2019) with the OTFMAP data we present here reveals that the C2N mode is more efficient at recovering the diffuse polarized emission of the background cloud, between the Orion-KL and the Orion Bar for example. In order to improve the SNR of the the faint polarized dust emission of the Orion Bar we applied different numerical filters and filtering options of the pipeline e.g., faint, extended, deep, and varied the number of iterations, while paying careful attention to the different polarization quantities produced by the full pipeline reduction algorithm. For the Band A, D, and E data, comparing with the nominal reduction pipeline configuration, we find that the extended and deep filters produce artificial polarization signals. For example, we retrieve significant rotation of polarization position angles, and modification of the structure in Stokes and high polarization fractions in regions of SNR in total intensity of , compared to the nominal reduction. We also retrieve uniform polarization position angles toward some regions of faint emission, not recovered by the nominal reduction. This is likely because the corresponding integration times are not long enough to ensure most of the faint emission to be at a reasonable level of SNR. However, the faint filter worked reasonably well on these data, offering a slight increase in SNR in the polarized dust emission. The Band C data are of much higher SNR due to longer integration time (see Table 1), and the recovery of the extended and diffuse emission improves significantly by using the faint and deep filters. However, the Orion Bar is already completely detected with a reasonable SNR criteria by the standard pipeline using the nominal configuration for CRUSH. Therefore, for consistency, no specific filters were ultimately used in the four OTFMAP datasets we use here. In addition, we explored a range of iterations rounds for the reduction of each dataset. Increasing rounds systematically increases the SNR of the polarized dust emission in regions of SNR in total intensity, up to a point where artificial polarization increases significantly. Applying a conservative approach, and use rounds of 30, 15, 10, 10, for Band A, C, D, E, respectively.
An important step in the reduction of HAWC+ data is the estimation of the zero-level background of the observations. Because the instrument is subject to both the variable atmosphere and the emission from the astrophysical source, the reduction algorithm may produce areas of negative flux where the emission from the source and the atmosphere are at similar levels. This can, in turn, potentially cause a loss of flux, but which can be corrected by the reduction algorithm. In order to correct for the zero-level background, we have determined a region of faint emission using Herschel archival images at 70, 100, 160 and 250 m, covering the HAWC+ field for each observation wavelength (see the corresponding regions highlighted in Figure 15). We require the pipeline to estimate the mean of this zero-level region and to add this value to the entire map in each scan. Following the method presented in Li et al. (2022) (see their Section 2.3), we find that the zero-level background correction contributes a median of 2.5 0.6 %, 0.55 0.07 %, 1.5 0.5 %, 0.3 0.3 %, in the Band A, C, D, and E data, respectively.
The properties of the linear polarization of thermal dust emission are expressed by the Stokes parameters and . Stokes represents the total intensity of the emission. , , are the error of Stokes , , and , respectively. For linear polarization, the polarized intensity is defined as , which we have systematically debiased using the expression in Wardle & Kronberg (1974); Vaillancourt (2006); Hull & Plambeck (2015). The polarization fraction is the part of the total intensity which is linearly polarized, and is defined as . Finally, the polarization position angle -vector is defined as . The corresponding uncertainties , , and , are derived following Gordon et al. (2018). We apply three conservative cuts in SNR on the HAWC+ polarization quantities throughout this paper which are: (we use sometimes a SNR value of 200 for more conservative quantification), , and . After correction for instrumental polarization, HAWC+ has an absolute error of 3∘ in polarization position angle, and 0.4% in polarization fraction (Harper et al., 2018).
III. Results
In this Section, we analyze the spatial variation of the polarization quantities along and across the Orion Bar, as well as how these quantities vary as a function of wavelength. We are particularly interested in analyzing how the polarization varies along the minor axis of the Bar, transitioning from the line-of-sights (LOSs) toward the irradiated side to the colder region exposed to much lower UV intensity, but also along the major axis of the Bar, along which the Bar also experiences a gradient in radiation field strength.
A transition in the grain alignment mechanism from - to -RATs would change the alignment axis of the grain, but detecting such transition highly depends on the projection of the relative orientation of the 3D magnetic and radiation fields, on the plane-of-the-sky (POS). The detectability of the - to -RAT transition is maximal when the plane defined by () (where and are the radiative and magnetic field vectors, respectively) is parallel to the POS, in which case we could measure a change in polarization angle of passing from - to -RATs. If the plane defined by () and the POS are orthogonal to one another, any such transition would not be detectable in dual polarization. In practice, radiative transfer effects must also be taken into account to predict the apparent change of polarization angle, because the entire population of grains susceptible of RAT alignment, i.e., both -aligned and -aligned grain population, will contribute to the observed polarized dust emission. In addition, the relative level of grain alignment efficiency of - and -RATs, as well as the potential differences between the and angles, will also affect the resulting dust polarization signal.
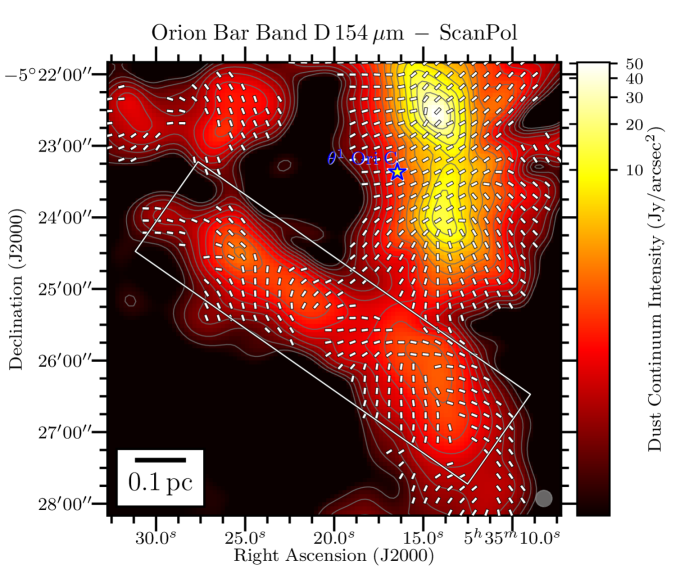
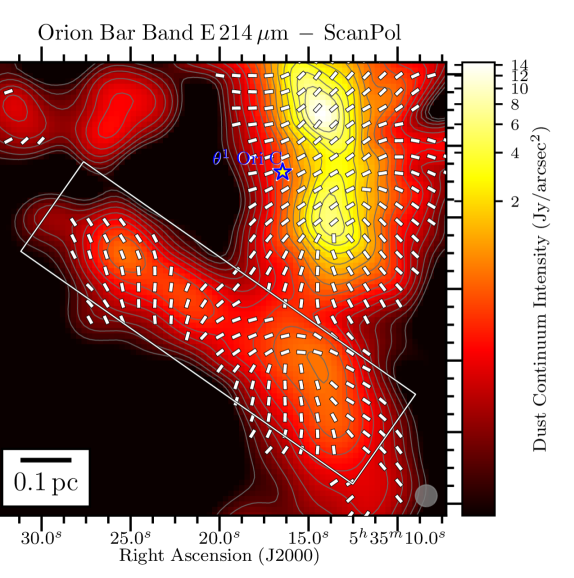
Salgado et al. (2016) estimated an inclination of the Bar of 4∘, which means that the anisotropic component of the radiation field received by the Orion Bar is roughly in the POS. The magnetic field from the Orion KL nebula of OMC1, which is located behind the Orion nebula (Genzel & Stutzki, 1989), is mostly perpendicular to the major axis of the dense filament (Hough et al., 1986; Rao et al., 1998; Schleuning, 1998; Chrysostomou et al., 1994; Tang et al., 2010; Hull et al., 2014; Pattle et al., 2017; Ward-Thompson et al., 2017; Chuss et al., 2019; Cortes et al., 2021). From the observations presented here, we can see that the component of the OMC1 magnetic field projected on the POS, has roughly the same orientation of the radiation field vector from the Trapezium cluster, for the medium between the Bar and the Trapezium. As a consequence, if all the aligned grains of the Orion Bar were aligned via -RATs, or via -RATs with respect to the initial large scale magnetic field of OMC1, the polarization -vectors would be uniform and roughly aligned the minor axis of the Bar, i.e., pointing toward Ori C. This is clearly not the case (Figure 1). Therefore, the magnetic field of the Bar is likely more complex, and a precise analysis of the polarized dust emission and the grain alignment conditions (dependent on the dust characteristics and the environmental conditions of the Bar, e.g., the gas density and dust temperature) is required to investigate whether the aligned dust grains are susceptible to the -RATs mechanism in the Bar.
III.1. Multi-wavelength analysis of the polarization quantities in the Orion Bar
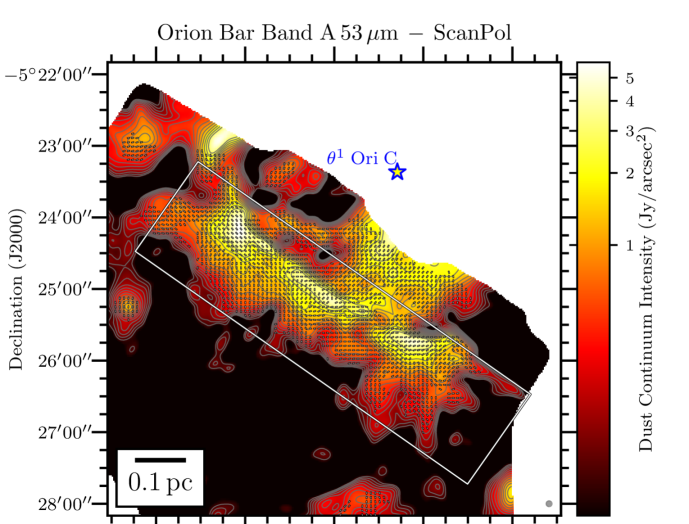
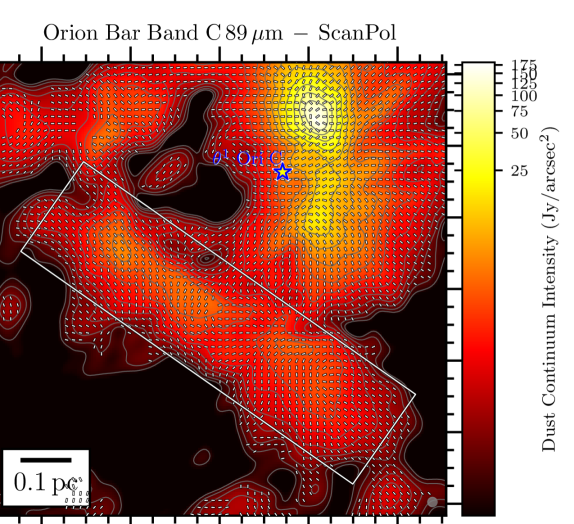
We present in Figure 1 the maps of the flux density in the Orion Bar at each of the 4 HAWC+ bandpasses overlaid with the polarization position angles showing the apparent magnetic field lines (rotating the polarization -vectors by 90∘), adopting a sampling pattern of 1-2 vectors per beam resolution element. The rectangular grey box shows the location of the Orion Bar and denotes the region discussed in detail in the following Sections. The box’s major axis has a position angle with respect to North of 55∘, and its dimensions are , centered on the FIR emission. In the four plots of Figure 1, we conserve the original resolution of the observations. However, later on in the analysis, we do regrid and smooth the Band A, C, and D observations to the Band E gridding and resolution333Smoothing polarization and their covariance map must account for the fact that the polarization reference direction frame on the celestial sphere varies over a projected map, and thus within the smoothing 2D-kernel. However, this effect is ignored because of the relatively small size of the HAWC+ maps. Therefore, the Stokes maps and their uncertainty are smoothed independently, and we rebuild the polarization quantities from the smoothed and regridded maps., to ensure accurate and quantitative comparisons across different wavelength (using the reproject python package of astropy; see Appendix B). The magnetic field exhibits a complex morphology, with several sub regions having homogeneous polarization patterns, but different from one another. Indeed, different organized components of the magnetic field co-exist, as seen in the South West of the Bar in the Band C, D and E observations, where two patches of polarized dust emission exhibit orthogonal magnetic field orientations. Band A observations, which have the highest spatial resolution, retrieve several structures in Stokes , not observed in the lower resolution Band C, D and E maps. Different wavelengths can preferentially probe different regions if the distribution of dust temperature is not uniform on the line of sight. If those regions have different magnetic field geometries, they will contribute to polarization angles disparities across wavelengths.
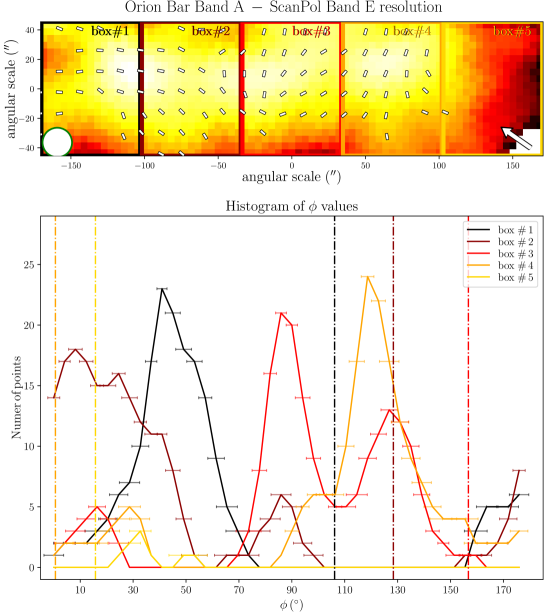
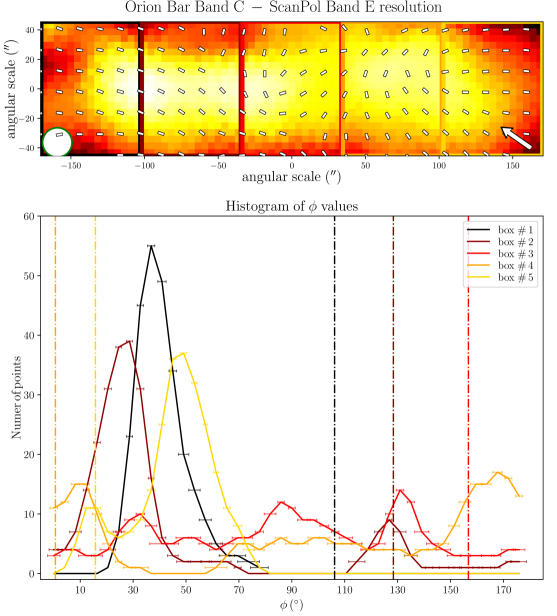
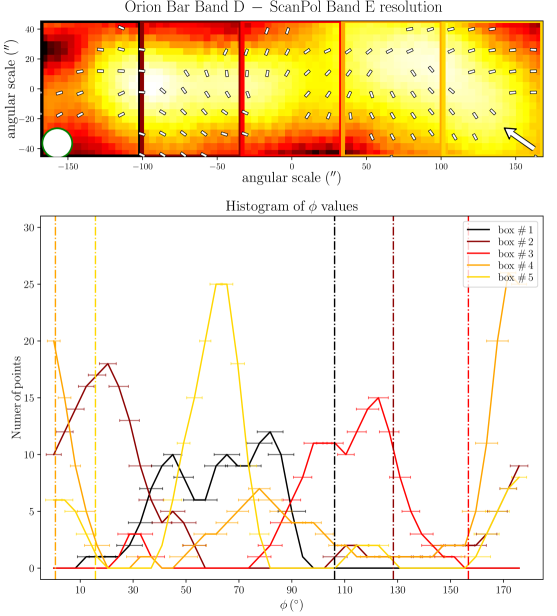
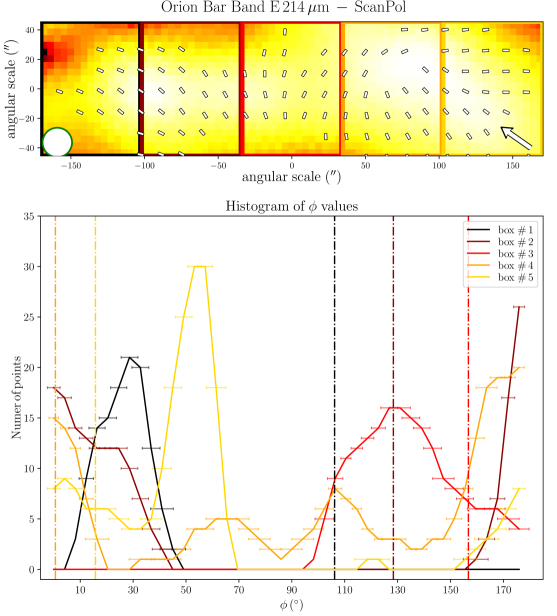
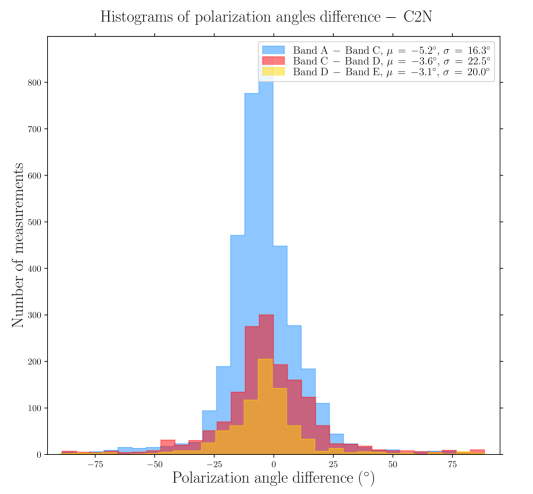
To quantitatively estimate whether any regions of the Bar can exhibit dust polarization consistent with -RATs, Figure 2 presents histograms of polarization position angles (-vectors) in five sub-regions, obtained by splitting the Orion Bar along its major axis. The three central regions experience a stronger radiation field given their higher proximity to the Trapezium cluster. Data at the four wavelengths, all with a gridding and resolution corresponding to those of the Band E, are presented. In each histogram, the orientations of the anisotropic radiation field emanating from Ori C and pointing to the center of the five boxes are indicated by vertical dot-dashed lines. Then, if a given region exhibits -vector angles similar to the radiation field, those vectors would be consistent with the -RAT mechanism. In each box, and at all four observation wavelength, none of the main peak of the different histogram components correspond to the vertical lines. This indicates that the ambient radiation field direction does not dictate the direction of grain alignment in the Bar. However, two small areas in Figure 2 exhibit -vector polarization angles consistent with the radiation field: the center of box # 3 in the Band E data (toward one equivalent beam surface area), and the bottom left of box # 4 in the Band C, D, and E data (toward one equivalent beam surface area at Band C, two at Band E and D). This latter one corresponds to the cold and dense dust component in the South West of the Bar mentioned above, not recovered by the Band A observations (see below).
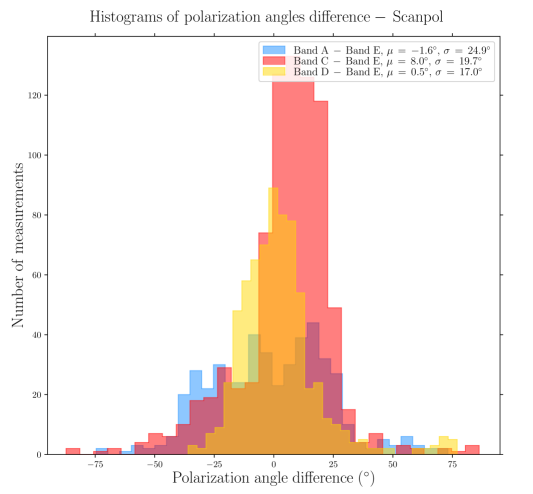
Toward the northern and middle regions (boxes # 1, 2, 3) of the Bar, the polarization angles across the four wavelengths are consistent within 20∘ (based on the differences across wavelength of the peaks of the histogram components). However, the southern region (histogram in box # 4) shows clear differences between the Band A observations, and the observations taken at Band C, D, and E, because the band C, D, and E data have picked up the emission from a dense ( cm-2) and cold ( K) region, that is visible in total intensity (the and maps are from Chuss et al. 2019, see their Figure 3., and the Section III.2 of this paper). In contrast, the emission from the Band A observations, sensitive to warmer dust, corresponds to regions closer to the irradiated front of K. The -vectors in box # 4 of Band A are mainly parallel to the minor axis of the Bar, which is also a pattern of emission seen with the three others wavelengths, alongside this component of colder dust. The polarization angles of box # 5 are consistent across the Band C, D, and E observations within 10∘. Finally, the polarization angles exhibited by the HAWC+ Band E observations are also consistent with the 850 m dust polarization observations obtained with POL-2 on the JCMT (Ward-Thompson et al., 2017; Pattle et al., 2017). The standard deviation of the distribution of polarization angles differences between the HAWC+ Band E and POL-2 data is 20∘, similar to what is obtained among the HAWC+ bands (see Figure 3).
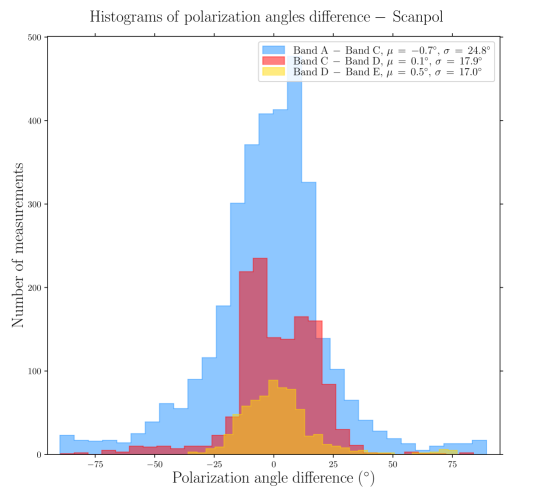
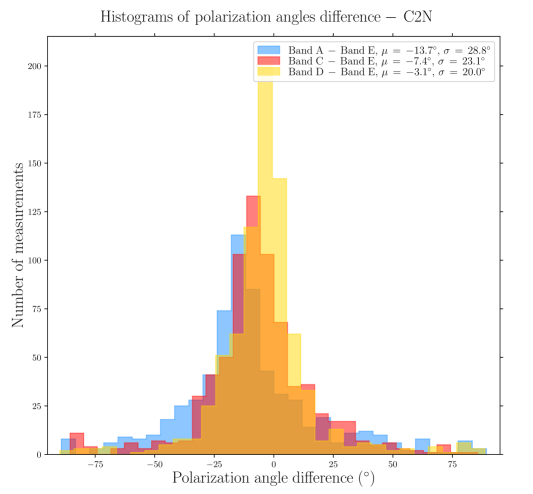
In order to go further in quantitatively comparing polarization angles across wavelength, Figure 3 presents comparisons (as pair-wise differences) of the polarization angles between the various pairs of observations at different wavelengths, using the OTFMAP mode maps, and the C2N mode data presented in Chuss et al. (2019). The distributions peak around 0∘ and the standard deviations are within 15-25∘, while in the regions of Bar where SNR(), SNR(). Comparing the difference between the mean and the standard deviation of the polarization angle difference distributions, it is not possible to separate them with statistical significance, even if we increase the SNR criteria on the polarized intensity and Stokes , in which case we also deselect too many data points. The distribution of the polarization difference between Band A and Band C, and between Band A and Band E, show a significant number of points outside the central peak of the distribution, corresponding to typical difference of +30 ∘ and -30 ∘. Those data points come from the south-east side of the Bar, where the SNR of Band A detections are the lowest. However, if we weight the polarization difference by their relative uncertainty (i.e., computing ), we find that the histograms using the Band A still exhibit larger standard deviation compared to the others. We thus suspect those data points may be artifacts from the data reduction.
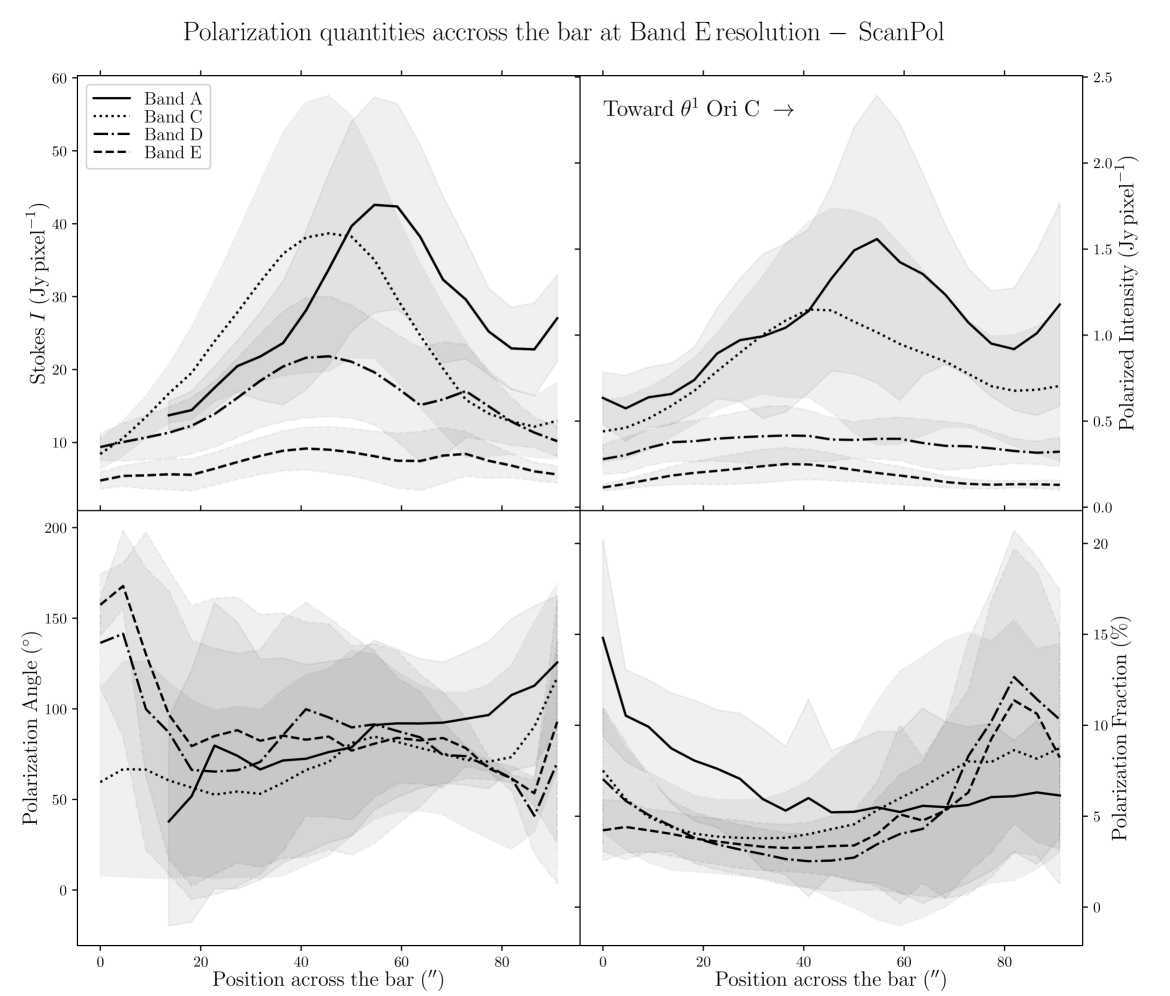
Figure 4 presents the variation of Stokes , , , and for the four wavelengths OTFMAP observations as a function of the position along the minor axis of the Bar (i.e., the minor axis of the gray rectangle used as a reference so far that is shown in Figure 1), which is directed toward the irradiation front. We highlight that the data points of Figure 4 are SNR-selected independently across bands. The goal is to determine how important the effects of the environmental conditions are for the emission. Indeed, our region of interest, defined by the rectangle highlighted in Figure 1, shows a clear dust temperature gradient (see Chuss et al. 2019). The peak in Stokes and for Band A is clearly closer by 15′′ to the irradiation front compared to the Stokes and peaks of Band C, D, and E observations, which is likely a dust temperature effect. As suggested above, Band A is more sensitive to the hot dust layer located at the irradiated edge of the Bar, compared to the dust emission emanating from the colder region not directly exposed to the irradiation of the Trapezium cluster.
The -vector map exhibits several components, which explains why the variations of the mean polarization angle across the Bar in Figure 4 shows significant discrepancies between the bands. The Band A observations at Band E resolution do not have a large number of independent polarization detections. This explains the marked rotations at the beginning and end of the profile of as a function of position across the Bar for this band, which are not statistically significant. Band C data, having a much higher signal to noise than the other bands, trace more reliably the underlying polarized dust emission emanating from the more tenuous outer part of the Bar, and/or from the background OMC1 cloud. Band D and E polarization angle profiles also show significant differences (up to 80∘ between the mean polarization angles) compared to Band A and C for positions 20′′ from the cold side of the PDR. Again, lack of uniform detections toward these faint regions explains the retrieved discrepancies. Finally, the polarization fraction profiles follow opposite trends compared to the total intensity profiles. Effects due to both dust temperature and gas density must play a role in the resulting profiles. We will investigate these in Section III.2.
In this data analysis, no variations of the polarization position angles as a function of wavelength are detected with statistical significance. In all our observations, the polarization angles analyzed alongside the radiation field direction along the Bar show no evidence for -RAT aligned grains. However, the analysis of the dust polarization observational data alone is limited by the complexity of the apparent magnetic field lines structure, the observational wavelengths probing different environmental conditions across the Orion Bar, and the observation data quality.
III.2. Variations of the polarization degree as a function of environmental conditions
The effects of the radiation field and the gas density govern the radiative torques and the efficiency of de-alignment by gaseous collisions, respectively. This in turn regulates the polarization level of the dust emission. We use the work of Chuss et al. (2019) (see also Arab et al. 2012), who gathered HAWC+, Herschel PACS & SPIRE (André et al., 2010; Abergel, 2010; André, 2011; Bendo et al., 2013), JCMT/SCUBA-2 (Mairs et al., 2016), GBT and VLA (Dicker et al., 2009) observations of the Orion nebula and fitted modified blackbody spectra for each pixel. These fits yielded column density, dust temperature and emissivity maps with 18.7′′ angular resolution and a 3.7′′ square pixel size. To ensure statistical independency, we regrid these maps to a Nyquist sampled map of 4 pixels per beam area, resulting in a pixel size of 8.3′′. We then smooth and regrid the maps of the four bands of HAWC+ observations to the resolution and pixel sampling of the dust temperature and gas column density maps, i.e., to 18.7′′ angular resolution with 8.3′′ square pixel size.
We compare our polarization results with three physical quantities describing the local environmental conditions: the line of sight dust temperature & column density, and the derived gas column density between the Bar and the Trapezium cluster . That is, the column density “seen” towards the Trapezium by each location we map in the Orion Bar. The dust temperature will serve as a proxy for the radiation field intensity, a major parameter that govern the efficiency of radiative torques, and we use as a proxy for the efficiency of de-alignment by gaseous collisions because the gaseous collisional rate is proportional to this quantity (Draine & Weingartner, 1996).
In order to compute , we first estimate the gas column density of the Bar itself , by subtracting 21021 cm-2 from the derived column densities, corresponding to the background cloud OMC1 based on the SED fitting of the maps. We then estimate the gas volume density in the Bar by dividing by 0.28 pc, the size of the Bar along the LOS derived by Salgado et al. (2016), who used an estimation of the absorbing area at the surface of the PDR. We finally sum the gas density values along the lines separating each pixel in the Bar from the Trapezium cluster to derive .
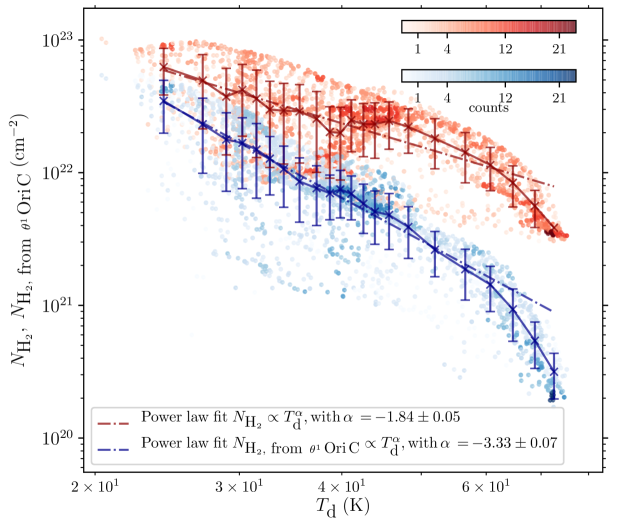
Figure 5 shows the two-dimensional histogram of the gas column density after the correction for the background OMC1 material as a function of dust temperature toward the Orion Bar. The gas column density is inversely proportional to the dust temperature for the complete range of values probed here. We note that Chuss et al. (2019) performed Markov Chain Monte Carlo tests to evaluate the systematic covariance between the SED fitting parameters (i.e., , , and the dust emissivity spectral index, see their Section 3.1.5). While there is some covariance between and , the width of the likelihood functions are such that we can consider that the trends of Figure 5 have a physical origin. The RAT alignment theory predicts that the minimum size of aligned dust grains decreases with increasing radiation field, and with decreasing volume density. We note this point because Tram et al. (2021c) flagged values below a specific dust temperature, below which gas column density was positively proportional to the dust temperature. In our case, we expect the polarization degree to increase (decrease) as a function of (), for the full range of our () values. A departure from this trend can be explained by an evolution of dust properties as a function of the environmental conditions. In this context, Tram et al. (2021a, b, c) proposed that the decrease of as a function of observed at high dust temperature ( K) with HAWC+ toward star forming clouds/dense cores can be caused by RATD. In addition, we note that and are used here to quantify the effect of two different physical quantity on the efficiency of radiative torques. While we use as a proxy for the efficiency of collisional gaseous de-alignment, we use as a proxy for the reddening of the radiation field emanated from the Trapezium cluster. Because the radiative torque efficiency strongly decreases for grains smaller than the wavelength of impinging photons, the grain alignment efficiency induced by RATs should be affected by the reddening (Lazarian & Hoang, 2007).
The disorganized component of the magnetic field can be a source of depolarization due to cancellation of the polarization signals on the line of sight, as shown by Jones et al. (1992). It can also cause a decrease in the observed polarization when the typical scale of the POS magnetic field fluctuations are smaller or comparable to the spatial resolution. Therefore, alongside the polarization fraction , we also consider the dispersion of polarization angles in the POS , which allows us to quantify the level of disorganization of the apparent magnetic field lines. Loss of grain alignment also directly impacts the fractional polarization. To disentangle between these effects, one needs to analyze and together, using the disorganized component of the magnetic field provided by to determine whether changes in can be attributed to changes in the grain alignment efficiency. Several studies have revealed that and are correlated, showing the role of depolarization due to magnetic field disorganization (Fissel et al., 2016; Planck Collaboration et al., 2020; Chuss et al., 2019; Le Gouellec et al., 2020). We use the nearest neighbors approach to derive (Le Gouellec et al., 2020), given the pixel sampling of our maps. To obtain , we debias the maps of measured dispersion by subtracting its uncertainty: , following the relation of Alina et al. (2016). We then use as a proxy for the polarization degree corrected for the depolarization effects induced by the disorganized component of the magnetic field. We use SNR()5 and SNR()200 for our data selection criteria.
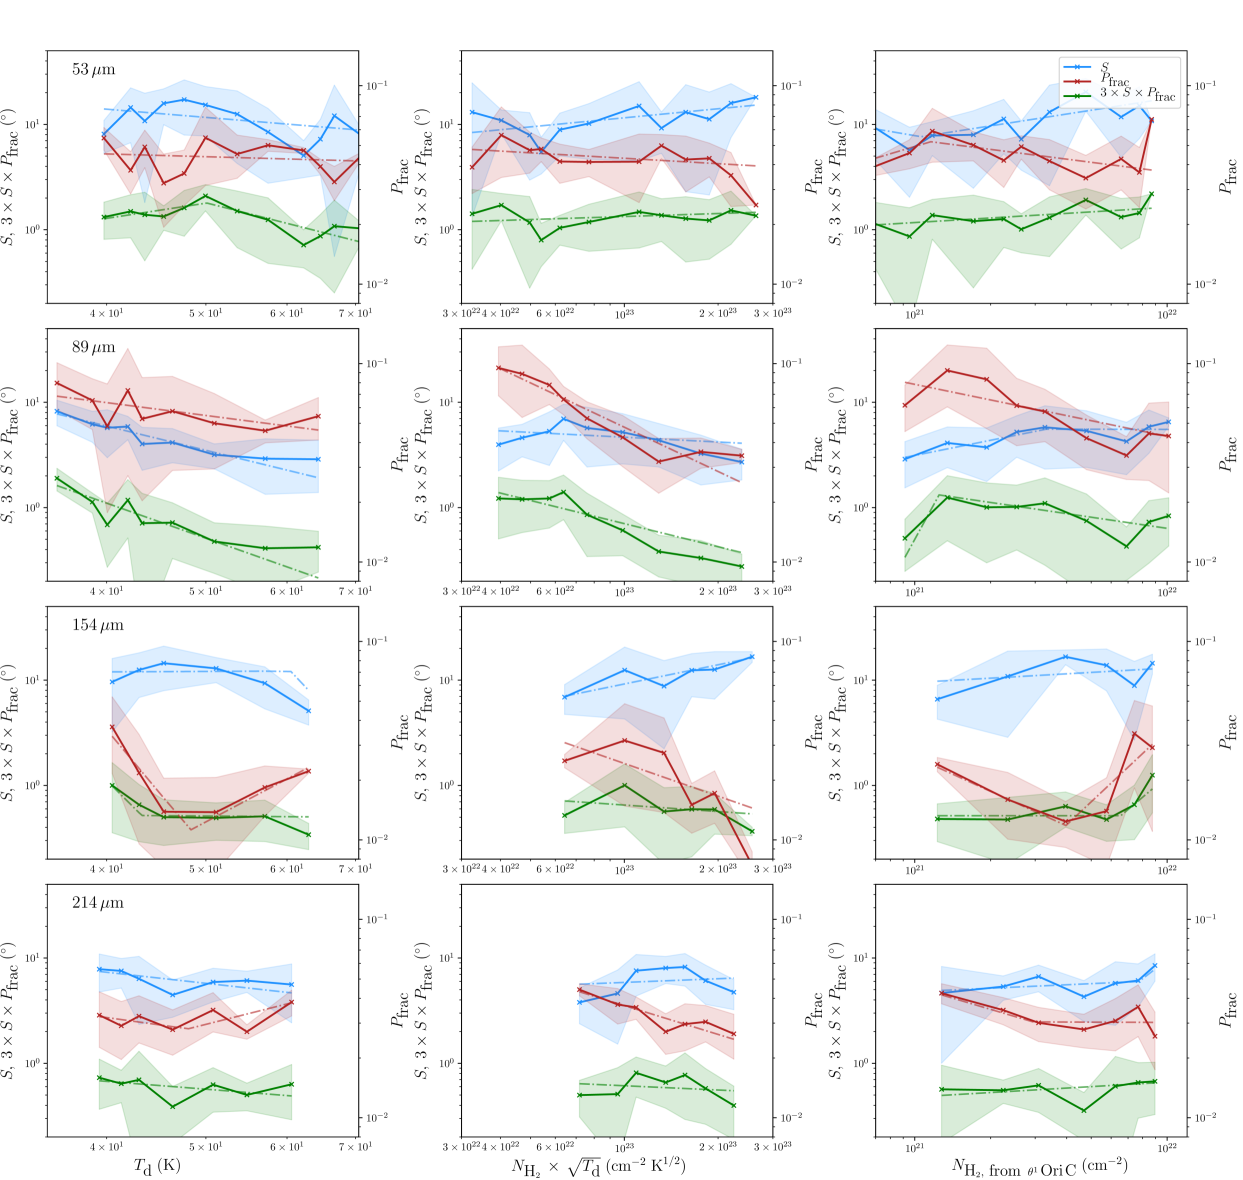
Figure 6 presents the evolution of (right-hand axes), , and (left-hand axes) as functions of , , and , for the four wavelength observations (see Section V.3 for the polarization fraction spectra specifically). With this approach, we want to determine whether the evolution of polarization degree (tentatively corrected from depolarization caused by the disorganized component of the magnetic field) as a function of environmental conditions suggests varying alignment conditions. Given the limited sensitivity of the Band A observations, and the large dynamic range between the Band A initial resolution and the angular scale at which we smooth the maps to, i.e., 18.7′′, the corresponding distribution shown in Figure 6 are not conclusive and must be interpreted with caution. However, Band C, D, and E, present clearer systematic trends.
III.2.1 Polarization quantities versus
The slope of the trends as a function of appears to be on average slightly decreasing or flat at 53, 89, and 154 m. A small increase is seen at 214, and 154 m, for 50 K. At the four wavelengths of observation, is flat or decreasing with increasing . Given the anti-correlation of with , this decrease of with can be explained by an increase of magnetic field apparent disorganization, or structure complexity, with the line-of-sight depth in the Bar, which is know to harbors high density substructures (Habart et al., 2022). systematically decreases with , or exhibits a flat trend. As is proposed to trace grain alignment corrected for depolarization by the B-field structure, the grain alignment efficiency is on average found to slightly decrease with . These trends are not able to be explained by the basic RAT theory alone, and suggest an evolution of dust grain properties as a function of temperature, which could be caused by RATD.
A line of sight with a given derived value of dust temperature may actually correspond to multiple dust components of different inherent dust temperatures. This can explains the different distributions of at the different wavelengths, for the same range of dust temperatures. Shorter wavelength observations are more sensitive to hotter dust, more affected by RATD. This can explain why the decrease of versus at 89 m is more important than at 154 and 214 m. We note that if RATD were strongly efficient throughout the Orion Bar (see Section IV.2), we would expect a clear and ubiquitous anti-correlation between polarization degree and dust temperature. In addition, the grain alignment efficiency within the hotter side, i.e., where 50 K, remains high, with values around , suggesting that the radiative feedback does not totally hinder grain alignment.
III.2.2 Polarization quantities versus
In the four bands decreases with , expect in the m data, where increasing with increasing , for cm-2. systematically increases with . The situation of is less clear; it exhibits mostly flat trends and is potentially increasing at high . While the complexity of the environment preclude us from drawing clear conclusions about the evolution of grain alignment versus , the flat or increasing trends of grain alignment efficiency versus is hard to explain with basic RAT theory, because the increasing of reddening is supposed to reduce the number of grains susceptible to alignment. The region where 45 K and 1021 cm-2 corresponds to the southern side of the Bar, which is nominally not exposed to significant heating. If deep into the cloud the effects of higher reddening on the grain alignment efficiency are compensated by the increase of the minimum grain size of aligned grains caused by the loss of RATD efficiency with increasing density, the potential increase of at high can be explained by an evolution of dust properties across the Bar caused by RATD. Hence, we may probe a significant gradient in the alignment properties of dust grains, from the PDR edge where the radiative feedback via photo-fragmentation of aggregates and/or RATD is effective, to the inner quiescent part of the Bar, where larger aggregates survive.
III.2.3 Polarization quantities versus
The evolution of both and versus (a proxy for the gas-dust collision rate) show clear decreases at the four wavelength of observations. The trends of are either flat or increasing with , which suggest that a part of the decrease of versus is due to the magnetic field structure. From these results we conclude that the grain dis-alignment by gas pressure is effective in the Bar.
To summarize, we suggest that the evolution of the grain alignment efficiency with the local conditions (using the available constrains on the dust temperature and gas density) cannot be explained by basic RAT theory alone, without considering dust evolution. The evolution of dust properties throughout the Bar can explain the slight decrease (increase) of alignment efficiency with dust temperature (reddening), which might be caused by RATD. However, we note that RATD, if occurring, does not totally hinder grain alignment in the Bar. The dis-alignment by gas collisions efficiently decrease the grain alignment degree. We now confront the hypothesis raised above with the predictions provided by the computation of the different grain alignment timescales as a function of the characteristic grain sizes describing the alignment and disruption of grains.
IV. Modeling of grain Alignment timescales and characteristic grain sizes
Studying the grain alignment timescales allows us to estimate for which grain sizes the -RAT mechanism can be important, and in parallel, what grains are potentially affected by RATD. Ultimately, the goal is to determine whether the aligned grains that are susceptible to be aligned via the -RAT alignment can survive the RATD phenomenon, which also affects in theory those aligned grains. We see below that the -RAT and RATD phenomena affect the large end of the typical ISM dust grain size distribution, where the relative number of grains is low (Mathis et al., 1977). However, those grains are the origin of the FIR to (sub-)millimeter polarized dust emission. The spatial resolution of this grain alignment timescale analysis corresponds to the resolution of the original dust temperature and column density map of Chuss et al. (2019), i.e., with 18.7′′ angular resolution and 3.7 ′′ square pixel size.
IV.1. Grain size parameter space for -RAT
To estimate which grain alignment mechanism is dominating, we derive the different timescales that describe the efficiency of the different phenomena involved in the alignment of dust grains by radiative torques. RATs can be presented as a balance between gaseous de-alignment induced by collisions of gas particles onto dust grains, the precession speed of the grain’s magnetic moment induced by grain rotation (for paramagnetic grains) around the magnetic field, and the efficiency of the radiative torques applied by the anisotropic radiation field impinging onto grains. We neglect the infrared emission damping and plasma drag effects (Draine & Lazarian, 1998). The efficiency of these three processes can be compared to one another from comparing the relevant characteristic timescales, i.e., the collisional gaseous damping timescale , the Larmor precession timescale , and the radiative precession time-scale (Lazarian & Hoang, 2007; Tazaki et al., 2017). Ultimately, the minimum size of aligned grains denotes the grain size over which dust grains can be considered aligned (Hoang & Lazarian, 2008).
The collisional gaseous damping time of the grain is estimated by:
| (1) |
where is the thermal velocity of gas atoms of mass , is the gas density, is the gas temperature (we will use as a proxy for , which is not necessarily true in PDRs; see Koumpia et al. 2015), is the principal grain moment of inertia (which scales as , where the dust grain density), is the grain effective size, and is the mean molecular weight per hydrogen molecule.
The Larmor precession timescale, describing the precession of the magnetized grain’s angular momentum around an external magnetic field resulting from the interaction of the grain magnetic moment with is given by:
| (2) |
where G is the magnetic field, g cm-3, the grains’ aspect ratio, and the grains’ paramagnetic zero-frequency susceptibility. In our calculations we fix the magnetic field strength to G, given the results of Chuss et al. (2019); Guerra et al. (2021). We adopt g cm-3 and s = 0.5 (Hildebrand & Dragovan, 1995). The zero-frequency susceptibility of a dust grain depends on its paramagneticity. For a super-paramagnetic grain, we have from Morrish (2001):
| (3) |
where is the fraction of atoms that are super-paramagnetic, and is the number of atoms per cluster. The GEMS measurements derived values = 0.03 (Bradley, 1994; Martin, 1995; Goodman & Whittet, 1995), and is expected to be = 103-105 (Kneller & Luborsky, 1963; Jones & Spitzer, 1967). Lastly, we consider an ordinary paramagnetic grain, with:
| (4) |
where is the fraction of atoms in the grain that are paramagnetic, evaluated at 10% (Tazaki et al., 2017). Results obtained from modeling and observations of dust polarization of the diffuse ISM and dense cores tend to favor the scenario where the efficiency of RATs can only be reproduced if grains’ magnetic relaxation is sufficiently fast, i.e., for super paramagnetic grains (Hoang & Lazarian, 2016; Reissl et al., 2020; Le Gouellec et al., 2020). We also note that H2 formation occurring at the grains’ surface provide additional torque that also increase the grain rotational velocity, eventually bringing the grain to suprathermal rotation (Purcell, 1979; Hoang et al., 2015), especially toward PDRs (Le Bourlot et al., 2012; Andersson et al., 2013; Soam et al., 2021). These both effects of grains’ super-paramagneticity and H2 formation supplemental torque increase the fraction of grains with high angular momentum, i.e., the fraction of grains at the the so-called high- attractor point (Lazarian & Hoang, 2007; Hoang & Lazarian, 2009b, 2016). While grains at high- can be considered perfectly aligned, grains with a low angular momentum (i.e., at the the so-called low- attractor point) would be poorly aligned and produced, exhibiting a Rayleigh reduction factor of 0.1 (Hoang & Lazarian, 2016). The relative fraction of grains at high-, i.e., , would increase with increasing grains’ magnetic susceptibility and magnetic field strength, and decreasing grain size, gas density and temperature (Chau Giang et al., 2022).
Finally, the radiative precession time-scale is given by:
| (5) |
where cm, K, is the radiation field intensity, is the anisotropy of the mean radiation field (equation from Tazaki et al. 2017), is the RAT efficiency (see the relation 10 in Hoang et al. 2021), and is the mean wavelength of the radiation field. We estimate the radiation field using the relation from Draine (2011):
| (6) |
To estimate , i.e., the reddening of the radiation field, we use the relation from Hoang et al. (2021), who, using an analytical model, derives the mean wavelength as a function of the blackbody temperature of a star and the gas column density integrated between the star and the region where is estimated. We use T39 000 K (corresponding to Ori C; Simón-D´ıaz et al. 2006), and the value derived above with the SED fitting performed in Chuss et al. (2019) to estimate the reddening of the radiation field in every pixel of the Bar.
Finally, we note that line-of-sight integration of the background OMC1 cloud must affect the results from the SED fitting that we use, especially for the determination of the dust temperature. In addition, the coarse resolution of this SED modeling, i.e., 18.7′′, precludes us from resolving the hotter layer of dust. This is more efficiently traced by the mid-infrared photometry study performed with FORCAST in Salgado et al. 2016, where a cold and a warm modified blackbody component were used. Therefore, the grain alignment timescale analysis does not probe physical scales corresponding to this hot dust layer where 100 K. However, the Orion Bar is resolved in its minor axis such that we can establish a clear gradient in dust temperature with a range of 3575 K and in projected column density with a range of 10 cm-2.
Equation 5 is only valid for grains aligned at low-. High- aligned grains are most likely be aligned with the magnetic field, because the spin-up effect of RATs dominate over the radiative precession (Hoang et al., 2022). We will thus compare the radiative precession timescale with the Larmor precession timescale of ordinary paramagnetic grains.
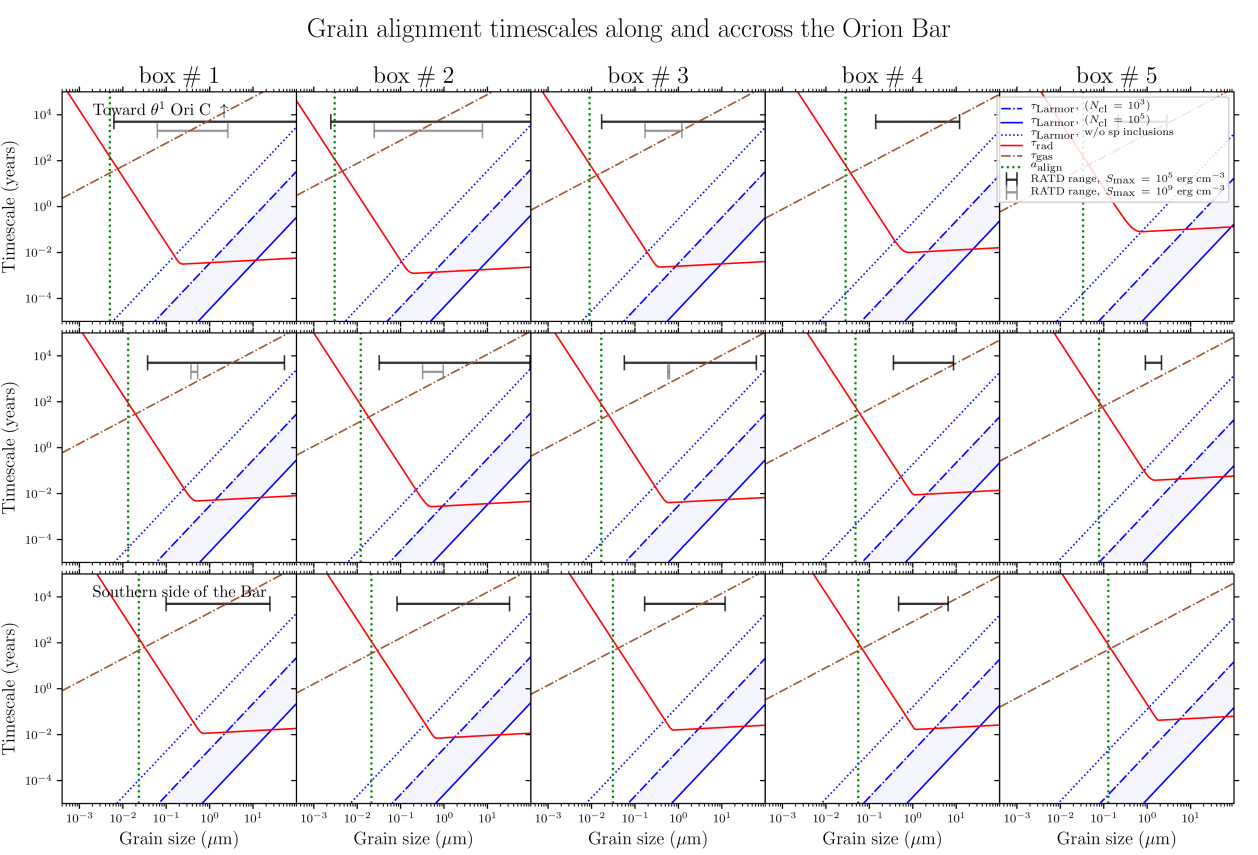
Figure 7 presents the grain alignment conditions of the Orion Bar, showing the different timescales discussed above. The Bar is divided into 35 sub regions, i.e., 5 along its major axis, and 3 along its minor axis (i.e., each of the five boxes displayed in Figure 2 are simply separated in three sub-boxes along the minor axis of the Bar). Dust grains larger than the typical size at which can be considered as aligned at low- with the radiation field (Lazarian & Hoang, 2007). This transitional grain size is referred to as hereafter. Toward the region probed by the box #2, corresponding to the highest irradiation conditions that we probe, ranges from 0.1 to 0.5 m. In the southern section of the region in box #5, corresponding to the coldest and densest conditions that we probe, would be 1 m.
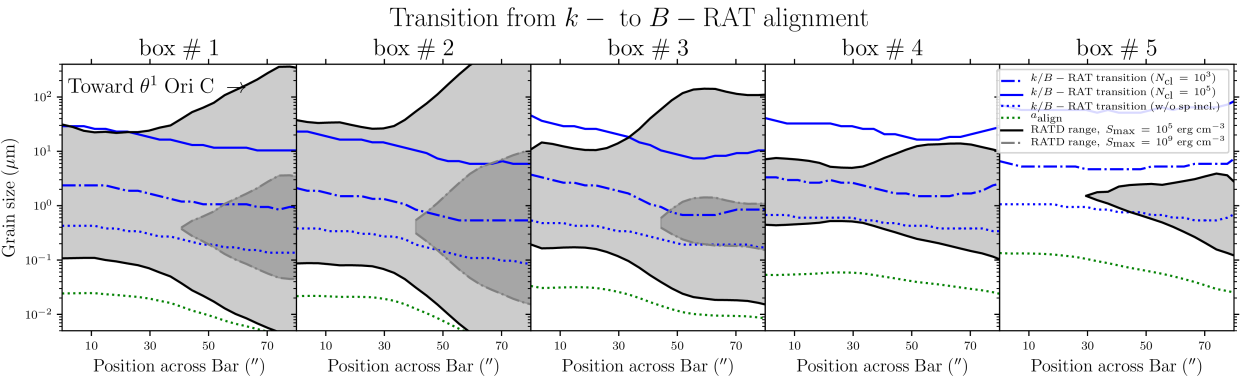
The evolution of the transitional values as a function of the proximity to the irradiated front is shown within the 5 boxes distributed along the major axis of the Bar in Figure 8. The southern boxes #4 and 5 exhibit on average higher values of and compared to boxes #13. These latter ones must correspond to most of the radiation absorbing area at the surface of the PDR.
IV.2. Constraints from grain alignment disruption
The constraints on the grain alignment timescales obtained above determine which grains are potentially aligned with the radiation field, depending on its strength. However, aligned dust grains subject to high irradiation can also trigger the so-called RAdiative Torque Disruption (RATD; Hoang et al. 2019) mechanism, which causes in the disruption of grains into fragments, occurring when the grain rotational energy induced by radiative torques exceed the grain cohesion forces. Comparing the angular velocity at which dust grains are rotationally disrupted with the rotation speed induced by RATs, allows us to constrain which grain sizes are affected by the RATD mechanism. Grains subject to RATD would thus be those with high angular momentum, i.e., at high-. Given the two regimes of radiative torque efficiency, i.e., when or , it is possible to define the grain size interval , inside which the aligned dust grains are rotationally disrupted. From Hoang et al. (2021), we have :
| (7) |
| (8) |
where is the tensile strength of dust grains, is the rotational damping coefficient due to the emission of infrared photons emitted by the grain which reduces the grain’s angular momentum (see Draine & Lazarian 1998; we adopt the relation of Hoang et al. 2021). The tensile strength of interstellar dust is uncertain, because it depends on both the grain structure, i.e., compact versus composite, and the grain composition. Dust grain evolution in the ISM is ruled by fragmentation and coagulation processes, as well as the formation of ice mantles. Dust grains with a core-mantle structure (Desert et al., 1990; Jones et al., 1990), and dust composite models composed of silicate and carbon grain aggregates (Mathis & Whiffen, 1989; Zubko et al., 2004; Köhler et al., 2015; Draine & Hensley, 2021), have been proposed. We explore the range for in order to consider both the case of large aggregates, and the case of compact silicate core grains (Hoang, 2019). Figures 7 and 8 show and for the two extreme values of that we consider here.
We find that for the most irradiated region of the Bar (box #1, 2, and 3 columns in Figure 7), the RATD mechanism can disrupt aggregates of tensile strength and size 0.01 m toward the northern side exposed to the irradiation (top-row panels), and grains 0.1 m toward the southern, colder regions (bottom-row panels). Compact grains of tensile strength appear to be affected by RATD only toward the northern irradiated side of the Bar, where grains 0.1 m can be rotationally disrupted. Setting aside the considerations about , that does not depend only on the grain’s characteristics, Figure 8 clearly shows that in box #1, 2, and 3, grains potentially aligned with the radiation field, i.e., larger than , are generally disrupted by RATD if they are aggregates. Compact grains of high tensile strength are also affected by RATD close to the irradiation front. Large and compact grains can in theory be aligned via -RAT in this region if and , i.e., m. However, such large grains, which are expected to be formed by collisions, are likely to be aggregates-type, and likely to be rotationally destroyed if they are efficiently aligned. In addition, it is unlikely that such large grains dominate the polarized dust emission in the FIR.
V. Discussion
V.1. Where could the -RAT alignment operate?
We note that with its 18.7 ′′ (i.e., 0.035 pc at 390 pc) angular resolution, our grain alignment timescale study does not resolve the hot dust layer close to the dissociation front, where the temperature can reach 400-700 K (Goicoechea et al., 2011, 2017; Parikka et al., 2017). In addition, observations and models have suggested that the Orion Bar PDR actually consists of high density clumps embedded in a lower density medium of mainly responsible for the extended PDR emission (Lis & Schilke 2003; Andree-Labsch et al. 2017; Habart et al. 2022 and references therein). These substructures could have been induced by UV radiation driven compression (Gorti & Hollenbach, 2002; Tremblin et al., 2012), advecting the molecular gas through the atomic gas (Goicoechea et al., 2016). Based on the results of Sections IV.1 and IV.2, it is possible to predict if those specific environmental conditions, toward these denser and warmer substructures, could trigger -RAT. Fixing all other parameters, we have : and . From Hoang et al. (2021), , with , where is the visual extinction measured from the illuminating star to a given location in the cloud. Therefore, an increase in density of two orders of magnitude, with a stronger or equal apparent radiation field, could sufficiently decrease the ratio such that grains with radii of m can potentially subject to -RATs, depending on their compactness. In parallel, the fraction would also decrease with increasing dust temperature and density, enabling a larger fraction of -RAT aligned grains to contribute to the polarization.
The results from the HAWC+ polarimetric observations presented in the histograms of Figure 2 does not show that grains are aligned with the radiation field emanating from the Trapezium cluster. The low- aligned grains cannot dominate the FIR dust polarized emission because the polarization fraction would be much lower (i.e., ) than what is observed. In addition, if large low- aligned grains were to dominate the polarization, they would generate a rotation of the polarization angle with increasing wavelength, where those large grains contribute more to the total emission, which is not observed. This latter effect would also induce a clear decrease of polarization fraction with wavelength, which is not the case in the Bar (see Section V.3 and Figure 11). Finally, given the transition sizes of m probed in Section IV.1 and the maximum size of the dust size distribution (m; see Schirmer et al. 2022, who proposed that fragmentation of large grains due to collisions caused by radiative pressure is an efficient mechanism in the Bar), the low- -RAT aligned grains are not expected to dominate the FIR emission. Therefore, while there may be a population of -RAT aligned grains, there is no evidence that they are the dominant cause of the FIR dust polarization observations. FIR polarization thus probe grains efficiently aligned at high- with the magnetic field. We also note that mechanically aligned grains can produce the same polarization pattern that -RAT aligned grains. Because such pattern are not favored in our analysis, we do not consider this mechanism further in our discussion. However, Appendix C present an analytic exploration of this grain alignment mechanism, where we find that it should not dominate the origin of the polarized dust emission.
V.2. On the depletion of large silicates
We find that a population of high- aligned grains should contribute significantly to the dust polarization because the -RAT non-detection implies that the population of low- aligned grains is negligible. However, the analysis of Figure 6 showed that the level of grain alignment efficiency toward the irradiated side (i.e., %) of the Bar suggests that a significant fraction of grains is still aligned. We now discuss the efficiency of RATD for those efficiently aligned grains. RATD is a mechanism that is relatively hard to precisely constrain observationally from emission data, as the abundance and size of the largest aligned grains is difficult to measure. Indeed, as shown in Section IV.2, RATD can be efficient at fragmenting all the large grains of m in size if they are aggregates of low tensile strength. However, we also note that RATD cannot be so efficient that it would deplete all grains m in size, because we expect the grain alignment efficiency to be limited for small grains (Lazarian & Hoang, 2007; Andersson et al., 2015), i.e., m in size. Besides, the polarized dust we observe with HAWC+ does not indicate a scenario where only small poorly aligned grains are present. Therefore, one needs to determine whether the efficiency of this mechanism is limited, and/or to characterize the structure of grains in such environment.
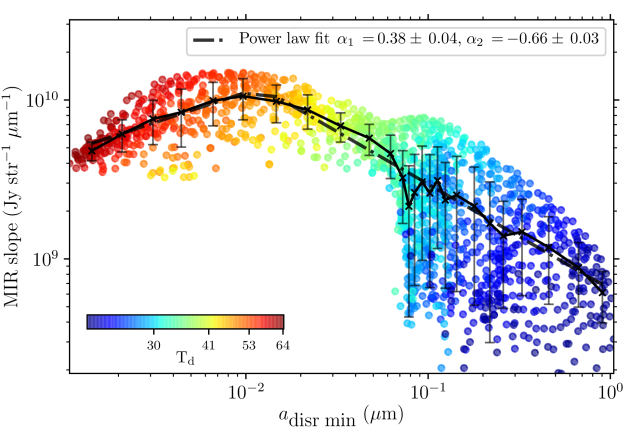
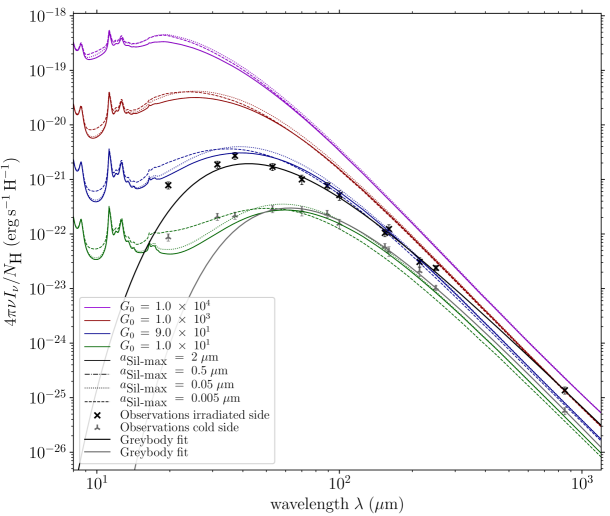
To investigate the hypothesis of high RATD efficiency precluding the survival of m size grains, we investigate the impact of such a depletion of large silicate grains on the SED of the Orion Bar PDR. To do this, we use the photometry files used in Chuss et al. (2019) for their SED fitting, as well as the SOFIA FORCAST MIR observations (19.4, 31.7, and 37.1 m) from Salgado et al. (2016), that we smooth and regrid to 18.7 ′′ resolution and 3.7 ′′ pixel size with a flux conserving algorithm. In parallel, we use DustEM (Compiègne et al., 2011) to simulate the effects of both the irradiation level and the diminution of the maximum size of silicates on the SED of a standard ISM dust grain population, using compositions of Compiègne et al. (2011). Results are shown in Figure 9. For each level of that we implement, we vary the maximum size of silicates among the following values of 2, 0.5, 0.05, and 0.005 m. The impact of removing large silicates on the SED is to increase the emission in the MIR, thus reducing the SED slope between the MIR and FIR (the MIR-to-FIR slope we are referring to here is the slope of the flux versus wavelength, calculated with the FORCAST data between 19.4 and 37.1 m)444For reference, we also did this analysis using the THEMIS dust model (Jones et al., 2013, 2017), and also noticed a evolution of the MIR-to-FIR slope when decreasing the maximum size of the silicates grains. However, this evolution is different that of using the Compiègne et al. (2011) model. Precise dust modeling would be required, but this goes beyond the scope of this paper.. Indeed, as the mass of dust is kept constant, cutting out the distribution toward the largest grains redistribute the mass toward small grains, whose emission is thus increased. We also note that the spectral signature of the 15 m band can also help to identify a scenario of a higher abundance of small silicates.
Also shown in Figure 9 are two sets of flux measurements, taken from the irradiated side of the PDR ( 65 K; star symbols) and on the cold embedded ( 40 K; plus symbols) side of the PDR 555We do not expect to fit the SED with the DustEM models. We only illustrate the impacts of the depletion of large silicates on the SED.. These data points correspond to relatively low , in Habing units, compared to the known FUV radiation field incident on the Orion Bar PDR, i.e., (Marconi et al., 1998), because of the low angular resolution of our photometric maps. The two SEDs shown in Figure 9 exhibit a shallower MIR-to-FIR slope than the model with no large silicate depletion, i.e., with m.
In order to investigate whether the evolution in the MIR-to-FIR slope in the observational data can be caused by a depletion of silicates, we show in Figure 10 the slope versus the minimum size of rotationally disrupted grains derived in Section IV.2 for . We find a clear bimodal change in the MIR-FIR slope as a function of , where it initially increases with , up to 110m, after which it decreases. The different slopes are mirrored in the dust temperature, such that positive slopes correspond to larger dust temperatures ( > 50 K) with negative slope corresponding to cooler dust temperatures. This decrease of the MIR-to-FIR slope slope, for 110m, for decreasing (increasing) () is consistent with RATD affecting the size distribution of the silicate grains by increasing the abundance of small silicates, assuming that the MIR-to-FIR slope is sensitive to such effects. For larger , the decrease of the MIR slope for increasing (decreasing) () is likely due to a dust temperature effect.
The interpretation that RATD is responsible for the decrease of the MIR slope for decreasing at > 40 K, is, however, subject to several caveats. For example, in a PDR the NIR to FIR flux ratio is smaller than in the diffuse ISM because of the intense dust evolution processes at the PDR irradiation front (Goicoechea & Le Bourlot, 2007). While nano-grains are efficiently photo-destroyed, large grains fragment due to collisions caused by radiative pressure, in addition to the RATD effect, which in turn can re-form nano-grains via sticking collisions at higher extinction (Schirmer et al., 2020, 2022). This also can have an impact on the MIR slope of the SED666Using the PDR-constrained THEMIS parameters derived in Schirmer et al. (2022), we find that, however, this only affects marginally the MIR-to-FIR slope.. In addition, the characteristic timescale of the photo-fragmentation of large grains, i.e., the collision timescale , is of the same order of magnitude of the rotational disruption timescale . Indeed, Schirmer et al. (2022) derived years for the Orion Bar, while we find years (using Hoang et al. 2019; Lazarian & Hoang 2021), for grains of 0.11 m. Therefore, RATD is not the only process responsible for the fragmentation of the large grains in the Orion Bar. These two timescales are grain size dependent, and the effects of RATD is more important for large grains (Hoang, 2019), while the photo-fragmentation of grains is more efficient for small grains. Therefore, the idea of using the MIR-to-FIR slope to probe the depletion of the largest aligned grains caused by RATD remains to be explored.
Finally, the effect of RATD is also hard to calibrate because of the uncertain degree of mixing of carbon and silicate grains in aggregates. Indeed, as carbon grains are diamagnetic and unlikely to align (Andersson et al., 2022), they are not subject to RATD. Because we have assumed a maximum efficiency of RATs when calculating the RATD parameters, this effect is not included here. The effects of “wrong” alignment of grains with respect to the magnetic field for large grains in the absence of internal alignment is also not included in this study (Hoang & Lazarian, 2009a). An even more important factor affecting the efficiency of RATD is the size of iron clusters embedded in dust, which significantly changes the magnetic susceptibility of dust grains, and in turn their inclination to experience fast alignment and potentially disruption (Chau Giang et al., 2022).
V.3. Next Steps - What is needed to further test and verify grain alignment theories ?
The Bar is not optically thin along the direction of the radiation field, and the UV photons are quickly attenuated. This affects the radiation field spectrum responsible for the heating of the dust that produce most of the IR emission across the Bar. Therefore, a radiative transfer modeling of the Orion Bar can be useful to produce a spatially resolved SED model across the PDR. Synthetic observations of such polarization radiative transfer modeling could thus evaluate the potential contribution of -RAT aligned grains to the polarized dust emission retrieved by HAWC+, and the RATD-survival of large silicates grains in supra-thermal rotation. While the radiative transfer code POLARIS (Reissl et al., 2016) has been recently updated to include the calculation of the fractions of high- aligned grains as a function of grain size and environmental conditions (Chau Giang et al., 2022), the -RAT and RATD mechanisms are not implemented yet. Such modeling would need to be run on a radiation-magneto-hydrodynamic simulation code that includes a proper gas cooling scheme, in order to reliably reproduce the magnetic field morphology, and the sub density structures, lying below the spatial resolution of our SOFIA observations. The magnetic field morphology that affects the polarized dust emission via depolarization effects may be hard to reproduce, and can make the comparisons between such models and dust polarization observations challenging. In theory, if deeper and higher angular resolution MIR to FIR dust polarization observations are made to resolve the typical dust evolution spatial scale, one can constrain the dust evolution scenario via a joint modeling of the grain alignment mechanisms and SED of the (polarized) dust emission.
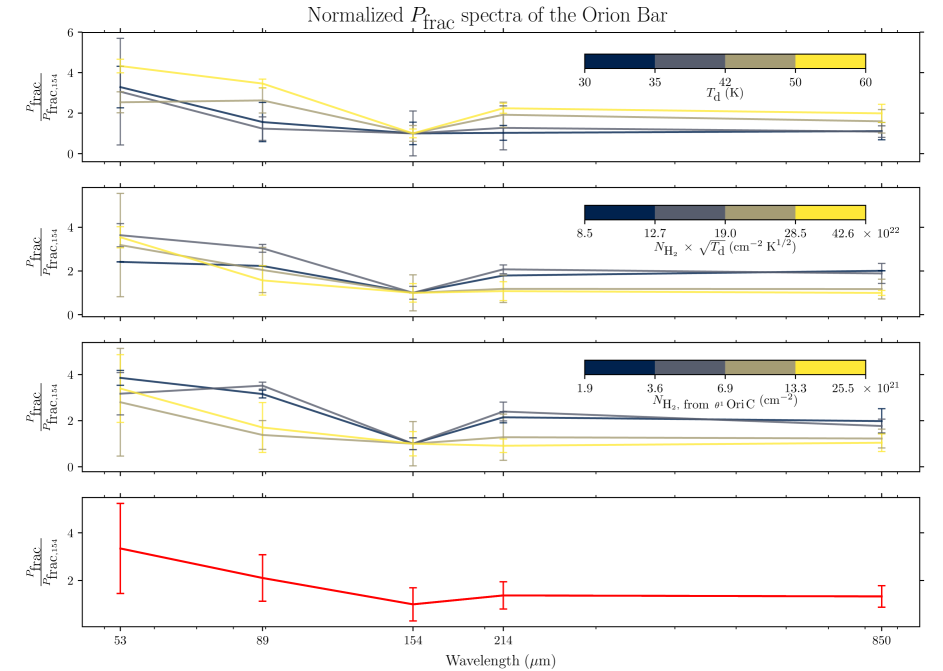
Additionally, the polarization fraction spectrum can be a powerful tool to constrain grain alignment theories or dust characteristics. Indeed, it is known to vary with the local physical conditions (i.e., dust temperature, grain alignment efficiency, dust grain characteristics such as their composition), that affects the polarized dust emission differently across wavelength (Hildebrand et al., 1999; Vaillancourt et al., 2008; Vaillancourt & Matthews, 2012; Fanciullo et al., 2022). With optical thickness decreasing with wavelength, the polarization fraction is expected to increase with wavelength toward the dense interior of cores (Hildebrand et al., 1999). However, for less dense regions, the polarization fraction is expected to decrease with wavelength, as warm dust traced at short wavelength is more easily aligned due to the higher efficiency of radiative torques. The available polarization spectrum models (Draine & Fraisse, 2009; Guillet et al., 2018; Hensley & Draine, 2022) predict the 50200 m spectra to be flat toward irradiated regions, i.e., regions close to the irradiation front in our case. Figure 11 presents the normalized polarization fraction spectra of the Orion Bar, for four ranges of , , and , and averaging all data points (selecting the pixels meting the SNR() & SNR() & conditions at all wavelengths). We note here again that the radiation field interacting with the grains is a function of both the input radiation field and the density of the cloud, which make the and quantities probe the same area of the Bar (i.e., the high locations correspond to low , and inversely; see Figure 5). Data from the SOFIA HAWC+ OTFMAP mode observations are used alongside the JCMT POL-2 observations presented in Ward-Thompson et al. 2017; Pattle et al. 2017. The data have been smoothed to the lowest resolution of the observations we consider, i.e., the 214 m data, and regridded to Nyquist-sample the beam. Michail et al. (2021) measured a falling 50220 m polarization fraction spectrum toward OMC-1, that they attributed to variation of dust grain population and grain alignment efficiency in the LOS. Given the uncertainties in the spectra of Figure 11, we find that the spectra are on average flat. However, there is a slight decreasing tendency—the spectra have either a minimum at 154 m or at 850 m, and appear tentatively falling between 53 and 154 m (this latter trend has also been observed in starburst galaxies, see Lopez-Rodriguez et al. 2022b). We also notice that the apparent dip at 154 m is more prominent at high temperature and low reddening (i.e., the low density region toward the irradiated side of the Bar) within the covered range of physical conditions. However, the error bar on the the mean polarization of the Band A data is large, and as noted in Appendix A, the polarization fractions values of the Band A data may suffer from systematics. Future FIR observatories with multi-wavelength polarization capabilities will be able to put stronger constraints on the dust grain properties and grain alignment mechanisms at play in PDRs.
Finally, optical and NIR spectro-polarimetry observations of background stars represent a strong tool to constrain the size distribution of foreground aligned grains. The shape of the polarization fraction versus wavelength curve, i.e., the Serkowski curve, is sensitive to the total-to-selective extinction , which is a good tracer of dust grain evolution (Serkowski et al., 1975; Whittet & van Breda, 1978; Andersson & Potter, 2007; Fanciullo et al., 2017; Giang et al., 2020; Vaillancourt et al., 2020). Such method can precisely constrain the maximum size of aligned grains, but it would require a good number of polarization detections of background stars as a function of the depth in the Bar, along the direction of the radiation field, to constrain the dust evolution throughout the PDR. Such work shall also be enabled by future FIR polarization capabilities (see Appendix D).
VI. Conclusions and summary
We present multiwavelength SOFIA HAWC+ polarimetric scan-pol dust polarization observations of the Orion Bar. Our goal is to characterize the origin of such polarized dust emission in such a highly illuminated region. In particular, we investigate the possibility that the reference direction for the grain alignment might change from the magnetic field ("-RAT ") to the radiation field k-vector ("-RAT ") in the regions of strongest illumination of the Bar. In addition, we explore the grain size parameter space in which aligned dust grains would be affected by the RAdiative Torques Disruption (RATD) mechanism, which fragments the largest aligned grains in efficient grain alignment conditions. The main results and conclusions of this study are as follows:
-
1.
We find overall consistent polarization position angles across all wavelengths, at 53, 89, 154, and 214 m, within 15-25 ∘. The linear polarization presents a chaotic morphology, precluding us from building precise predictions of the mechanism responsible for grain alignment in the Bar. However, the maps of polarization angles show that the radiation field direction is not the preferred grain alignment axis. We thus conclude that no evidence of the -RAT grain alignment mechanism is found throughout the Orion Bar in our FIR dust polarization observations.
-
2.
Using grey-body SED fits of FIR and sub-mm archival data, we derive the local environmental conditions that we use a proxy for the grain alignment conditions: the dust temperature, the reddening of the radiation field, and the gas pressure. We compare them with the polarization quantities, i.e., the polarization fraction with and without a correction for the depolarization caused by the disorganized magnetic field lines. While the grain alignment efficiency drops with increasing dust temperature, the dust polarization exhibits a high grain alignment efficiency toward the embedded side of the Bar, where the temperature is the lowest, and the reddening is the highest. This evolution of the polarization degree as a function of the local environmental conditions cannot be explained by the RAT theory alone without considering dust evolution. This suggests that the alignment properties of the large grains change from the cold to the hot side of the Bar, which can be explained by an evolution of dust properties across the Bar, possibly caused by RATD.
-
3.
The level of grain alignment efficiency obtained from these FIR dust polarization observations across such a highly illuminated PDR suggests that RATD does not totally hinder grain alignment. The exact grain size distribution of the population of aligned grains responsible for the FIR polarization in the Bar remains to be constrained.
-
4.
We calculate the grain size parameter space affected by -RAT and RATD, as function of the depth into the Bar. The typical grain sizes above which the alignment shifts from -RAT to -RAT (from 0.1 to 10 m depending on the location within the Orion Bar and the grain characteristics) corresponds to grain sizes too large to be the dominant source of polarized dust emission (given this transition size is close to the expected maximum grain size m), and that should be rotationally disrupted before they reach this typical size. However, the grains subject to -RAT and RATD may not be the same population of aligned grains, i.e., as they correspond to low versus high grain angular momentum states, respectively (low- or high-). The evolution of the fraction of grains at high- in the typical environmental conditions encountered in PDRs remain to be explored.
-
5.
Extrapolating our analytical calculations, we predict that -RAT may be active toward the edge of the denser cm-3 sub-structures lying at the dissociation front.
While the effective impact of RATD seems to remain moderate throughout the Bar, higher angular resolution multi-wavelength dust polarization observations will be required to truly quantify the effects of this mechanism. Our analysis tentatively suggests that this could be an active factor of dust grain evolution at the edge of highly illuminated PDRs, controlling the size distribution of the large aligned dust grains.
Acknowledgments: We are grateful to Olivier Berné, who provided the SOFIA FORCAST photometric data. We thank Umit Kavak for his inputs about the literature of the Orion nebula. We are grateful to Alexander Tielens for the use of the SOFIA HAWC+ 09-0107 program he is the PI of. We are grateful to Prof. Dan Clemens for providing the Orion Mimir data. Based on observations made with the NASA/DLR Stratospheric Observatory for Infrared Astronomy (SOFIA). SOFIA is jointly operated by the Universities Space Research Association, Inc. (USRA), under NASA contract NAS2- 97001, and the Deutsches SOFIA Institut (DSI) under DLR contract 50 OK 0901 to the University of Stuttgart. Financial support for this work was provided by NASA through awards #SOF 09-0037 issued by USRA. This research was conducted in part using the Mimir instrument, jointly developed at Boston University and Lowell Observatory and supported by NASA, NSF, and the W.M. Keck Foundation
Facilities: SOFIA.
Software: APLpy, an open-source plotting package for Python hosted at http://aplpy.github.com (Robitaille & Bressert, 2012). CASA (McMullin et al., 2007). Astropy (Astropy Collaboration et al., 2018).
References
- Abergel (2010) Abergel, A. 2010, SDP_aabergel_3: Evolution of interstellar dust, Herschel Space Observatory Proposal, id.285
- Alina et al. (2016) Alina, D., Montier, L., Ristorcelli, I., et al. 2016, A&A, 595, A57
- Allers et al. (2005) Allers, K. N., Jaffe, D. T., Lacy, J. H., Draine, B. T., & Richter, M. J. 2005, ApJ, 630, 368
- Andersson et al. (2015) Andersson, B.-G., Lazarian, A., & Vaillancourt, J. E. 2015, ARA&A, 53, 501
- Andersson & Potter (2007) Andersson, B. G., & Potter, S. B. 2007, ApJ, 665, 369
- Andersson et al. (2013) Andersson, B.-G., Piirola, V., De Buizer, J., et al. 2013, ApJ, 775, 84
- Andersson et al. (2022) Andersson, B. G., Lopez-Rodriguez, E., Medan, I., et al. 2022, ApJ, 931, 80
- André (2011) André, P. 2011, GT2_pandre_5: Completion of the Gould Belt and HOBYS surveys, Herschel Space Observatory Proposal, id.1533
- André et al. (2010) André, P., Men’shchikov, A., Bontemps, S., et al. 2010, A&A, 518, L102
- Andree-Labsch et al. (2017) Andree-Labsch, S., Ossenkopf-Okada, V., & Röllig, M. 2017, A&A, 598, A2
- Arab et al. (2012) Arab, H., Abergel, A., Habart, E., et al. 2012, A&A, 541, A19
- Astropy Collaboration et al. (2018) Astropy Collaboration, Price-Whelan, A. M., Sipőcz, B. M., et al. 2018, AJ, 156, 123
- Bakes & Tielens (1994) Bakes, E. L. O., & Tielens, A. G. G. M. 1994, ApJ, 427, 822
- Bendo et al. (2013) Bendo, G. J., Griffin, M. J., Bock, J. J., et al. 2013, MNRAS, 433, 3062
- Bradley (1994) Bradley, J. P. 1994, Science, 265, 925
- Bron et al. (2014) Bron, E., Le Bourlot, J., & Le Petit, F. 2014, A&A, 569, A100
- Chau Giang et al. (2022) Chau Giang, N., Hoang, T., Kim, J.-G., & Tram, L. N. 2022, arXiv e-prints, arXiv:2210.01036
- Chrysostomou et al. (1994) Chrysostomou, A., Hough, J. H., Burton, M. G., & Tamura, M. 1994, MNRAS, 268, 325
- Chuss et al. (2019) Chuss, D. T., Andersson, B. G., Bally, J., et al. 2019, ApJ, 872, 187
- Clemens et al. (2007) Clemens, D. P., Sarcia, D., Grabau, A., et al. 2007, PASP, 119, 1385
- Compiègne et al. (2011) Compiègne, M., Verstraete, L., Jones, A., et al. 2011, A&A, 525, A103
- Cortes et al. (2021) Cortes, P. C., Le Gouellec, V. J. M., Hull, C. L. H., et al. 2021, ApJ, 907, 94
- Desert et al. (1990) Desert, F. X., Boulanger, F., & Puget, J. L. 1990, A&A, 237, 215
- Dicker et al. (2009) Dicker, S. R., Mason, B. S., Korngut, P. M., et al. 2009, ApJ, 705, 226
- Dolginov & Mitrofanov (1976) Dolginov, A. Z., & Mitrofanov, I. G. 1976, Ap&SS, 43, 291
- Dowell et al. (2010) Dowell, C. D., Cook, B. T., Harper, D. A., et al. 2010, in Society of Photo-Optical Instrumentation Engineers (SPIE) Conference Series, Vol. 7735, Ground-based and Airborne Instrumentation for Astronomy III, ed. I. S. McLean, S. K. Ramsay, & H. Takami, 77356H
- Draine (2011) Draine, B. T. 2011, Physics of the Interstellar and Intergalactic Medium
- Draine & Fraisse (2009) Draine, B. T., & Fraisse, A. A. 2009, ApJ, 696, 1
- Draine & Hensley (2021) Draine, B. T., & Hensley, B. S. 2021, ApJ, 909, 94
- Draine & Lazarian (1998) Draine, B. T., & Lazarian, A. 1998, ApJ, 508, 157
- Draine & Weingartner (1996) Draine, B. T., & Weingartner, J. C. 1996, ApJ, 470, 551
- Draine & Weingartner (1997) —. 1997, ApJ, 480, 633
- Einstein & de Haas (1915) Einstein, A., & de Haas, W. J. 1915, Koninklijke Nederlandse Akademie van Wetenschappen Proceedings Series B Physical Sciences, 18, 696
- Fanciullo et al. (2017) Fanciullo, L., Guillet, V., Boulanger, F., & Jones, A. P. 2017, A&A, 602, A7
- Fanciullo et al. (2022) Fanciullo, L., Kemper, F., Pattle, K., et al. 2022, MNRAS, 512, 1985
- Fissel et al. (2016) Fissel, L. M., Ade, P. A. R., Angilè, F. E., et al. 2016, ApJ, 824, 134
- Gaia Collaboration et al. (2022) Gaia Collaboration, Vallenari, A., Brown, A. G. A., et al. 2022, arXiv e-prints, arXiv:2208.00211
- Genzel & Stutzki (1989) Genzel, R., & Stutzki, J. 1989, ARA&A, 27, 41
- Giang et al. (2020) Giang, N. C., Hoang, T., & Tram, L. N. 2020, ApJ, 888, 93
- Goicoechea & Le Bourlot (2007) Goicoechea, J. R., & Le Bourlot, J. 2007, A&A, 467, 1
- Goicoechea et al. (2011) Goicoechea, J. R., Joblin, C., Contursi, A., et al. 2011, A&A, 530, L16
- Goicoechea et al. (2016) Goicoechea, J. R., Pety, J., Cuadrado, S., et al. 2016, Nature, 537, 207
- Goicoechea et al. (2017) Goicoechea, J. R., Cuadrado, S., Pety, J., et al. 2017, A&A, 601, L9
- Goodman & Whittet (1995) Goodman, A. A., & Whittet, D. C. B. 1995, ApJ, 455, L181
- Gordon et al. (2018) Gordon, M. S., Lopez-Rodriguez, E., Andersson, B. G., et al. 2018, arXiv e-prints, arXiv:1811.03100
- Gorti & Hollenbach (2002) Gorti, U., & Hollenbach, D. 2002, ApJ, 573, 215
- Güdel et al. (2008) Güdel, M., Briggs, K. R., Montmerle, T., et al. 2008, Science, 319, 309
- Guerra et al. (2021) Guerra, J. A., Chuss, D. T., Dowell, C. D., et al. 2021, ApJ, 908, 98
- Guillet et al. (2018) Guillet, V., Fanciullo, L., Verstraete, L., et al. 2018, A&A, 610, A16
- Habart et al. (2022) Habart, E., Le Gal, R., Alvarez, C., et al. 2022, arXiv e-prints, arXiv:2206.08245
- Harper et al. (2018) Harper, D. A., Runyan, M. C., Dowell, C. D., et al. 2018, Journal of Astronomical Instrumentation, 7, 1840008
- Hensley & Draine (2022) Hensley, B. S., & Draine, B. T. 2022, arXiv e-prints, arXiv:2208.12365
- Herrmann et al. (1997) Herrmann, F., Madden, S. C., Nikola, T., et al. 1997, ApJ, 481, 343
- Hildebrand et al. (1999) Hildebrand, R. H., Dotson, J. L., Dowell, C. D., Schleuning, D. A., & Vaillancourt, J. E. 1999, ApJ, 516, 834
- Hildebrand & Dragovan (1995) Hildebrand, R. H., & Dragovan, M. 1995, ApJ, 450, 663
- Hiltner (1949) Hiltner, W. A. 1949, Science, 109, 165
- Hoang (2019) Hoang, T. 2019, ApJ, 876, 13
- Hoang et al. (2018) Hoang, T., Cho, J., & Lazarian, A. 2018, ApJ, 852, 129
- Hoang & Lazarian (2008) Hoang, T., & Lazarian, A. 2008, MNRAS, 388, 117
- Hoang & Lazarian (2009a) —. 2009a, ApJ, 697, 1316
- Hoang & Lazarian (2009b) —. 2009b, ApJ, 695, 1457
- Hoang & Lazarian (2016) —. 2016, ApJ, 831, 159
- Hoang et al. (2015) Hoang, T., Lazarian, A., & Andersson, B. G. 2015, MNRAS, 448, 1178
- Hoang et al. (2019) Hoang, T., Tram, L. N., Lee, H., & Ahn, S.-H. 2019, Nature Astronomy, 3, 766
- Hoang et al. (2021) Hoang, T., Tram, L. N., Lee, H., Diep, P. N., & Ngoc, N. B. 2021, ApJ, 908, 218
- Hoang et al. (2022) Hoang, T., Tram, L. N., Minh Phan, V. H., et al. 2022, AJ, 164, 248
- Hogerheijde et al. (1995) Hogerheijde, M. R., Jansen, D. J., & van Dishoeck, E. F. 1995, A&A, 294, 792
- Hopkins et al. (2022) Hopkins, P. F., Rosen, A. L., Squire, J., et al. 2022, MNRAS, 517, 1491
- Hough et al. (1986) Hough, J. H., Axon, D. J., Burton, M. G., et al. 1986, MNRAS, 222, 629
- Hull & Plambeck (2015) Hull, C. L. H., & Plambeck, R. L. 2015, Journal of Astronomical Instrumentation, 4, 1550005
- Hull et al. (2014) Hull, C. L. H., Plambeck, R. L., Kwon, W., et al. 2014, ApJS, 213, 13
- Hull et al. (2022) Hull, C. L. H., Yang, H., Cortés, P. C., et al. 2022, ApJ, 930, 49
- Jones et al. (1990) Jones, A. P., Duley, W. W., & Williams, D. A. 1990, QJRAS, 31, 567
- Jones et al. (2013) Jones, A. P., Fanciullo, L., Köhler, M., et al. 2013, A&A, 558, A62
- Jones & Habart (2015) Jones, A. P., & Habart, E. 2015, A&A, 581, A92
- Jones et al. (2017) Jones, A. P., Köhler, M., Ysard, N., Bocchio, M., & Verstraete, L. 2017, A&A, 602, A46
- Jones & Spitzer (1967) Jones, R. V., & Spitzer, Lyman, J. 1967, ApJ, 147, 943
- Jones et al. (1992) Jones, T. J., Klebe, D., & Dickey, J. M. 1992, ApJ, 389, 602
- Kavak et al. (2022) Kavak, Ü., Goicoechea, J. R., Pabst, C. H. M., et al. 2022, A&A, 660, A109
- Kneller & Luborsky (1963) Kneller, E. F., & Luborsky, F. E. 1963, Journal of Applied Physics, 34, 656
- Köhler et al. (2015) Köhler, M., Ysard, N., & Jones, A. P. 2015, A&A, 579, A15
- Koumpia et al. (2015) Koumpia, E., Harvey, P. M., Ossenkopf, V., et al. 2015, A&A, 580, A68
- Kounkel et al. (2017) Kounkel, M., Hartmann, L., Loinard, L., et al. 2017, ApJ, 834, 142
- Kounkel et al. (2018) Kounkel, M., Covey, K., Suárez, G., et al. 2018, AJ, 156, 84
- Kovács (2006) Kovács, A. 2006, PhD thesis, California Institute of Technology
- Kovács (2008) Kovács, A. 2008, in Society of Photo-Optical Instrumentation Engineers (SPIE) Conference Series, Vol. 7020, Millimeter and Submillimeter Detectors and Instrumentation for Astronomy IV, ed. W. D. Duncan, W. S. Holland, S. Withington, & J. Zmuidzinas, 70201S
- Lazarian & Draine (1999) Lazarian, A., & Draine, B. T. 1999, ApJ, 520, L67
- Lazarian & Efroimsky (1999) Lazarian, A., & Efroimsky, M. 1999, MNRAS, 303, 673
- Lazarian & Hoang (2007) Lazarian, A., & Hoang, T. 2007, MNRAS, 378, 910
- Lazarian & Hoang (2021) —. 2021, ApJ, 908, 12
- Le Bourlot et al. (2012) Le Bourlot, J., Le Petit, F., Pinto, C., Roueff, E., & Roy, F. 2012, A&A, 541, A76
- Le Gouellec et al. (2020) Le Gouellec, V. J. M., Maury, A. J., Guillet, V., et al. 2020, A&A, 644, A11
- Li et al. (2022) Li, P. S., Lopez-Rodriguez, E., Ajeddig, H., et al. 2022, MNRAS, 510, 6085
- Lis & Schilke (2003) Lis, D. C., & Schilke, P. 2003, ApJ, 597, L145
- Lopez-Rodriguez et al. (2022a) Lopez-Rodriguez, E., Clarke, M., Shenoy, S., et al. 2022a, ApJ, 936, 65
- Lopez-Rodriguez et al. (2022b) Lopez-Rodriguez, E., Mao, S. A., Beck, R., et al. 2022b, ApJ, 936, 92
- Mairs et al. (2016) Mairs, S., Johnstone, D., Kirk, H., et al. 2016, MNRAS, 461, 4022
- Marconi et al. (1998) Marconi, A., Testi, L., Natta, A., & Walmsley, C. M. 1998, A&A, 330, 696
- Martin (1995) Martin, P. G. 1995, ApJ, 445, L63
- Mathis et al. (1977) Mathis, J. S., Rumpl, W., & Nordsieck, K. H. 1977, ApJ, 217, 425
- Mathis & Whiffen (1989) Mathis, J. S., & Whiffen, G. 1989, ApJ, 341, 808
- McMullin et al. (2007) McMullin, J. P., Waters, B., Schiebel, D., Young, W., & Golap, K. 2007, in Astronomical Society of the Pacific Conference Series, Vol. 376, Astronomical Data Analysis Software and Systems XVI, ed. R. A. Shaw, F. Hill, & D. J. Bell, 127
- Michail et al. (2021) Michail, J. M., Ashton, P. C., Berthoud, M. G., et al. 2021, ApJ, 907, 46
- Morrish (2001) Morrish, A. H. 2001, The Physical Principles of Magnetism
- Murga et al. (2022) Murga, M. S., Kirsanova, M. S., Wiebe, D. S., & Boley, P. A. 2022, MNRAS, 509, 800
- Novak et al. (1997) Novak, G., Dotson, J. L., Dowell, C. D., et al. 1997, ApJ, 487, 320
- O’dell (2001) O’dell, C. R. 2001, ARA&A, 39, 99
- Ossenkopf et al. (2013) Ossenkopf, V., Röllig, M., Neufeld, D. A., et al. 2013, A&A, 550, A57
- Pabst et al. (2019) Pabst, C., Higgins, R., Goicoechea, J. R., et al. 2019, Nature, 565, 618
- Pabst et al. (2020) Pabst, C. H. M., Goicoechea, J. R., Teyssier, D., et al. 2020, A&A, 639, A2
- Parikka et al. (2017) Parikka, A., Habart, E., Bernard-Salas, J., et al. 2017, A&A, 599, A20
- Pattle et al. (2017) Pattle, K., Ward-Thompson, D., Berry, D., et al. 2017, ApJ, 846, 122
- Pellegrini et al. (2009) Pellegrini, E. W., Baldwin, J. A., Ferland, G. J., Shaw, G., & Heathcote, S. 2009, ApJ, 693, 285
- Planck Collaboration et al. (2020) Planck Collaboration, Aghanim, N., Akrami, Y., et al. 2020, A&A, 641, A12
- Purcell (1979) Purcell, E. M. 1979, ApJ, 231, 404
- Rao et al. (1998) Rao, R., Crutcher, R. M., Plambeck, R. L., & Wright, M. C. H. 1998, ApJ, 502, L75+
- Reissl et al. (2020) Reissl, S., Guillet, V., Brauer, R., et al. 2020, A&A, 640, A118
- Reissl et al. (2022) Reissl, S., Meehan, P., & Klessen, R. S. 2022, arXiv e-prints, arXiv:2201.03694
- Reissl et al. (2016) Reissl, S., Wolf, S., & Brauer, R. 2016, A&A, 593, A87
- Robitaille & Bressert (2012) Robitaille, T., & Bressert, E. 2012, APLpy: Astronomical Plotting Library in Python, Astrophysics Source Code Library, ascl:1208.017
- Salgado et al. (2016) Salgado, F., Berné, O., Adams, J. D., et al. 2016, ApJ, 830, 118
- Schirmer et al. (2020) Schirmer, T., Abergel, A., Verstraete, L., et al. 2020, A&A, 639, A144
- Schirmer et al. (2022) Schirmer, T., Ysard, N., Habart, E., et al. 2022, A&A, 666, A49
- Schleuning (1998) Schleuning, D. A. 1998, ApJ, 493, 811
- Serkowski et al. (1975) Serkowski, K., Mathewson, D. S., & Ford, V. L. 1975, ApJ, 196, 261
- Simón-D´ıaz et al. (2006) Simón-Díaz, S., Herrero, A., Esteban, C., & Najarro, F. 2006, A&A, 448, 351
- Soam et al. (2021) Soam, A., Andersson, B. G., Acosta-Pulido, J., et al. 2021, ApJ, 907, 93
- Tang et al. (2010) Tang, Y.-W., Ho, P. T. P., Koch, P. M., & Rao, R. 2010, ApJ, 717, 1262
- Tazaki et al. (2017) Tazaki, R., Lazarian, A., & Nomura, H. 2017, ApJ, 839, 56
- Tielens & Hollenbach (1985a) Tielens, A. G. G. M., & Hollenbach, D. 1985a, ApJ, 291, 722
- Tielens & Hollenbach (1985b) —. 1985b, ApJ, 291, 747
- Tielens et al. (1993) Tielens, A. G. G. M., Meixner, M. M., van der Werf, P. P., et al. 1993, Science, 262, 86
- Tram et al. (2021a) Tram, L. N., Hoang, T., Lee, H., et al. 2021a, ApJ, 906, 115
- Tram et al. (2021b) Tram, L. N., Lee, H., Hoang, T., et al. 2021b, ApJ, 908, 159
- Tram et al. (2021c) Tram, L. N., Hoang, T., Lopez-Rodriguez, E., et al. 2021c, ApJ, 923, 130
- Tremblin et al. (2012) Tremblin, P., Audit, E., Minier, V., Schmidt, W., & Schneider, N. 2012, A&A, 546, A33
- Vaillancourt (2006) Vaillancourt, J. E. 2006, PASP, 118, 1340
- Vaillancourt et al. (2020) Vaillancourt, J. E., Andersson, B. G., Clemens, D. P., et al. 2020, ApJ, 905, 157
- Vaillancourt & Matthews (2012) Vaillancourt, J. E., & Matthews, B. C. 2012, ApJS, 201, 13
- Vaillancourt et al. (2007) Vaillancourt, J. E., Chuss, D. T., Crutcher, R. M., et al. 2007, in Proc. SPIE, Vol. 6678, Infrared Spaceborne Remote Sensing and Instrumentation XV, 66780D
- Vaillancourt et al. (2008) Vaillancourt, J. E., Dowell, C. D., Hildebrand, R. H., et al. 2008, ApJ, 679, L25
- Van De Putte et al. (2020) Van De Putte, D., Gordon, K. D., Roman-Duval, J., et al. 2020, ApJ, 888, 22
- Ward-Thompson et al. (2017) Ward-Thompson, D., Pattle, K., Bastien, P., et al. 2017, ApJ, 842, 66
- Wardle & Kronberg (1974) Wardle, J. F. C., & Kronberg, P. P. 1974, ApJ, 194, 249
- Weingartner & Draine (2001) Weingartner, J. C., & Draine, B. T. 2001, ApJS, 134, 263
- Whittet & van Breda (1978) Whittet, D. C. B., & van Breda, I. G. 1978, A&A, 66, 57
- Wolfire et al. (2022) Wolfire, M. G., Vallini, L., & Chevance, M. 2022, ARA&A, 60, 247
- Zubko et al. (2004) Zubko, V., Dwek, E., & Arendt, R. G. 2004, ApJS, 152, 211
Appendix A A. Chop-nod and OTFMAP modes comparisons
Figure 12 presents quantitative comparisons between the polarization quantities Stokes , , , and , obtained with OTFMAP and the C2N HAWC+ polarimetric mode, at the four wavelengths used in this paper. The same comparisons are shown in Figure 13, but these new histograms take into account the off-beam contamination corrections (Novak et al., 1997) performed in the Section 3.4 of Chuss et al. (2019).
In all four bands, we analyze how does the fractional difference distribution evolve with increasing SNR criteria. The fractional difference distributions of and Stokes narrower for increasing SNR criteria (from 100 to 1000 for Stokes , and from 3 to 20 for ). For the fractional difference distributions of and , the increase of the SNR criteria also decreases the dispersion of the distributions, but this decrease is peculiarly significant on the Band A data. This suggests that the quality of the Band A OTFMAP observations is lower. From the shape of the distributions, one can check if any distributions present a clear departure from zero with a statistical significance, and with sufficiently high SNR criteria. This would suggest a systematic over(under)-estimation of a given polarization quantity. Among all the distributions, only the fractional difference distribution of polarization fraction values in Band A data present a statistical significant offset from zero with a mean value (where is the standard deviation) for all SNR criteria. Finally, the distributions presented in Figure 13 are on average slightly narrower with the additional flag on the C2N data that select out pixels with too high off-beam contamination .
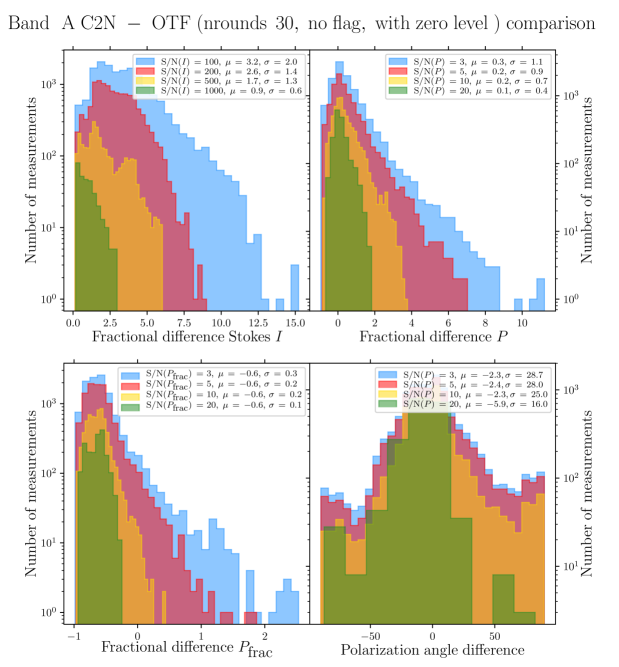
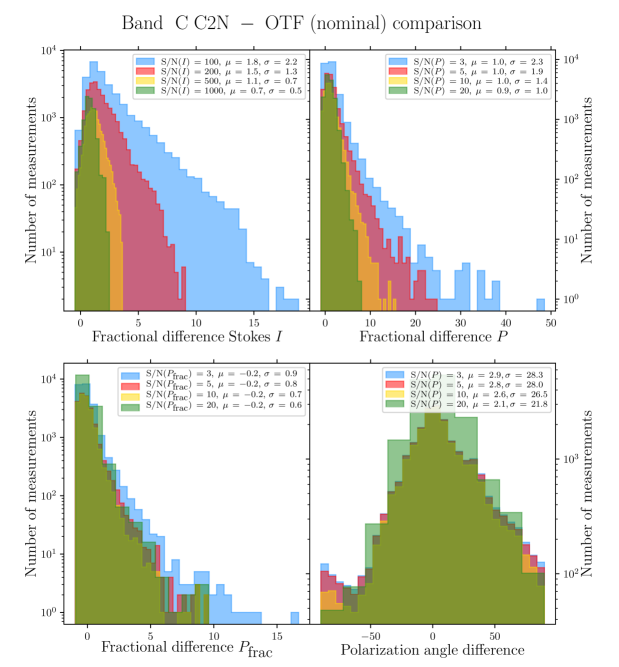
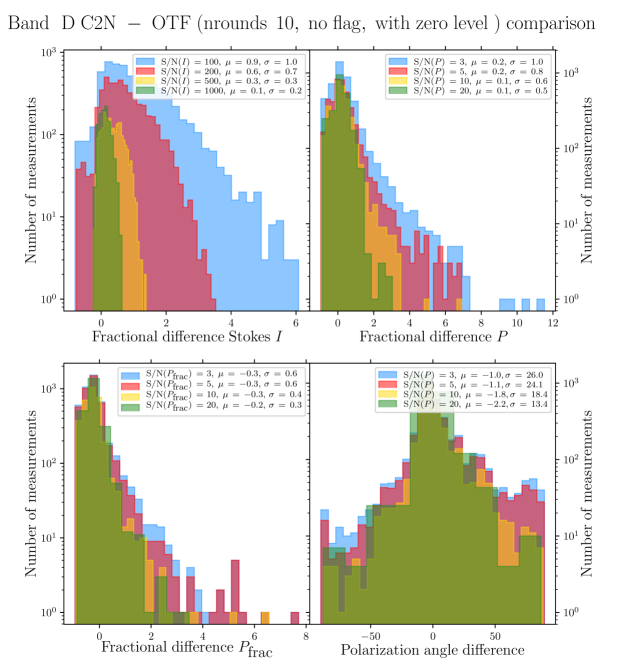
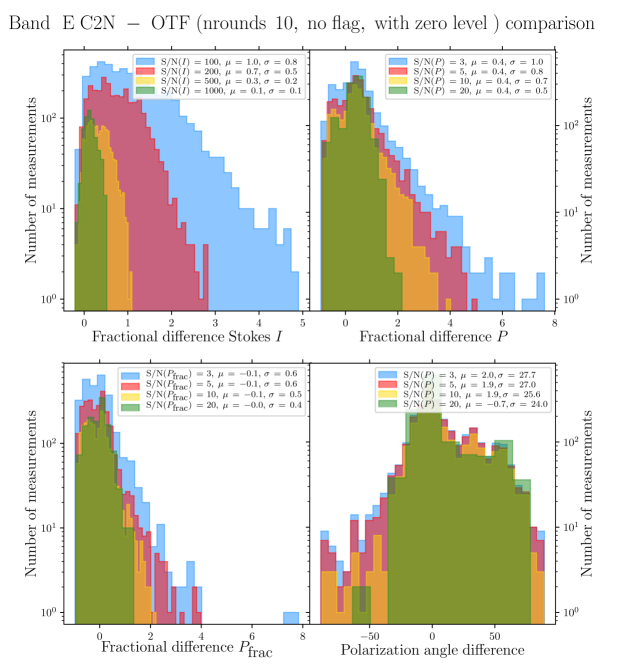
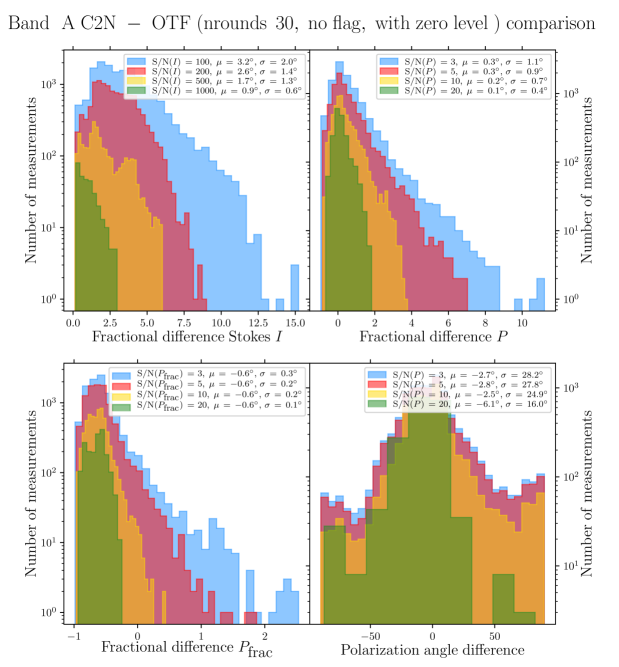
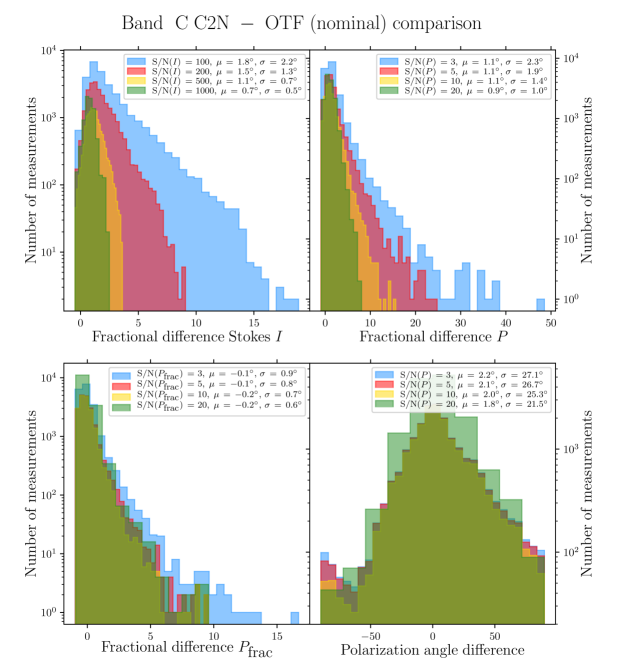
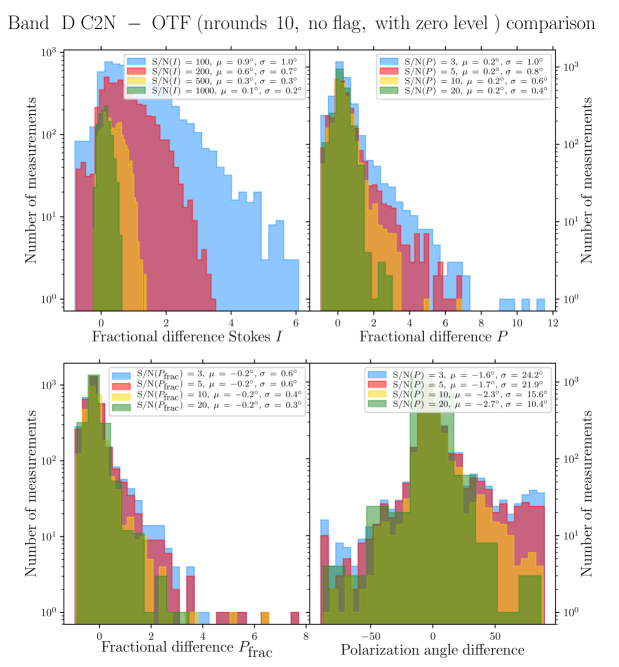
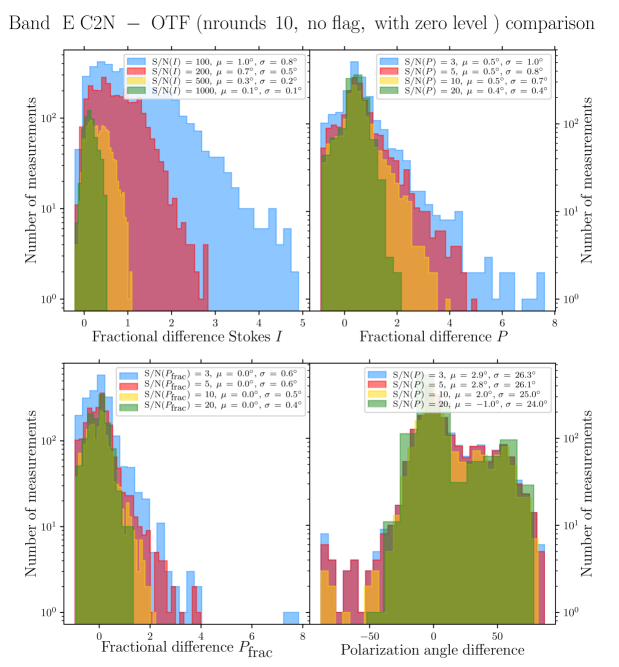
Appendix B B. Additional dust polarization observations plots
Figure 14 presents the four HAWC+ observations shown in Figure 1, but smoothed and regridded to the Band E angular resolution and pixel size, using a flux conserving algorithm. These maps are the one used throughout Section III and V of this paper. We also show in Figure 15 the region taken to perform the zero level background correction in each band (see Section II). The location of this region is consistent for Band C, D, and E, which correspond to low average emission in the 100, 160, and 250 m Herschel maps. For Band A we were limited by the field of view of the observations.
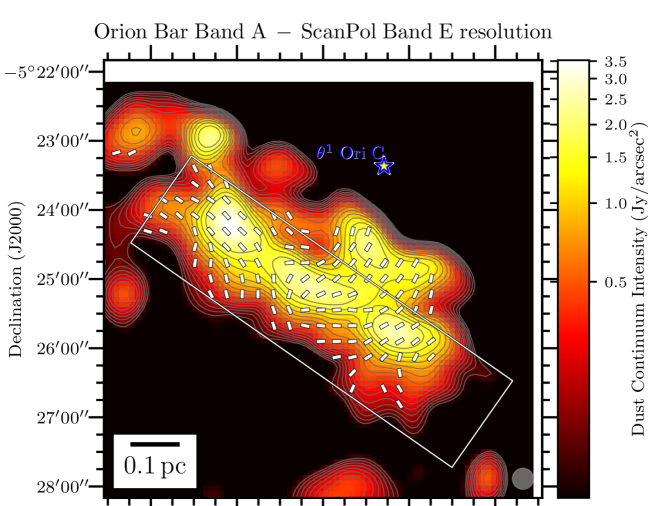
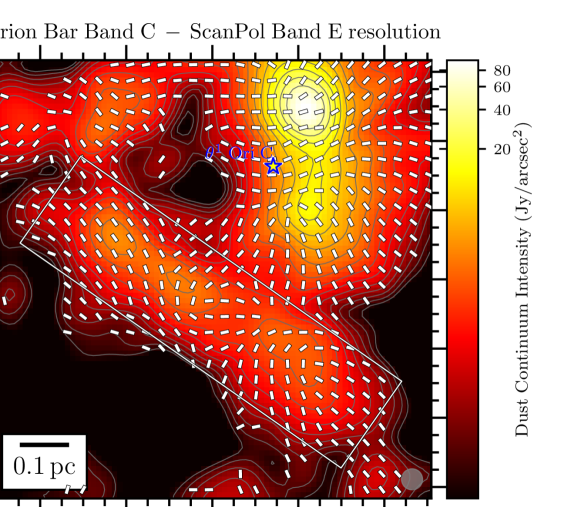
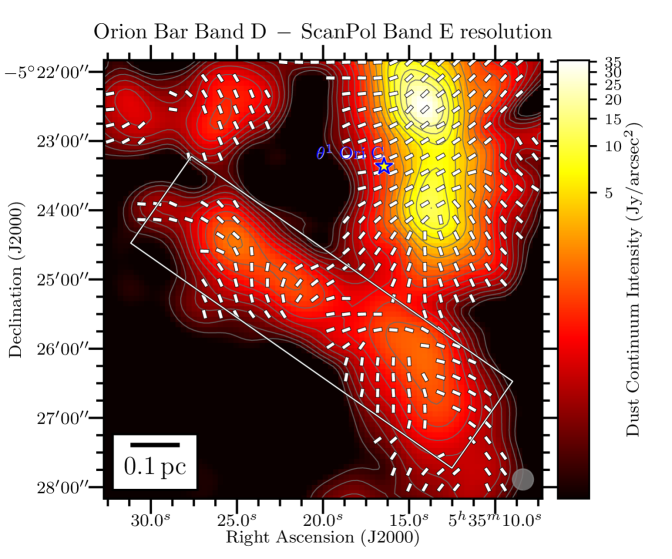
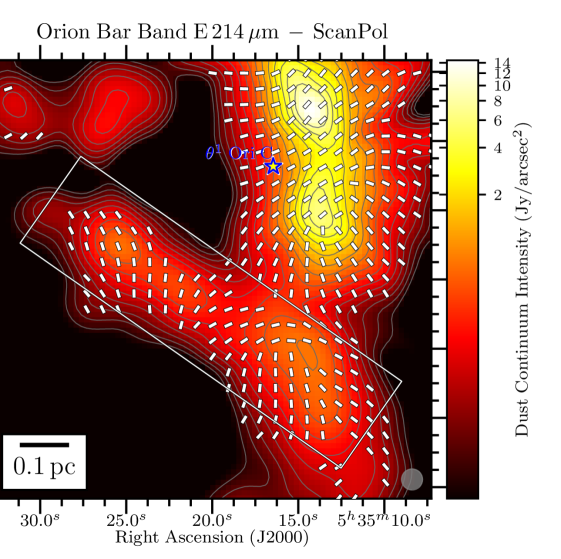
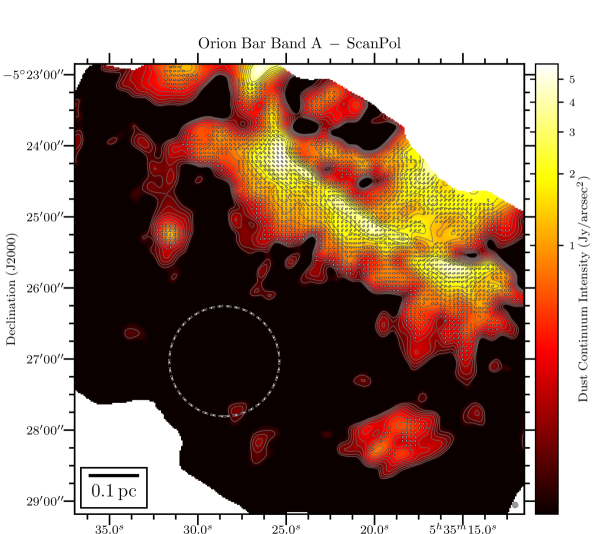
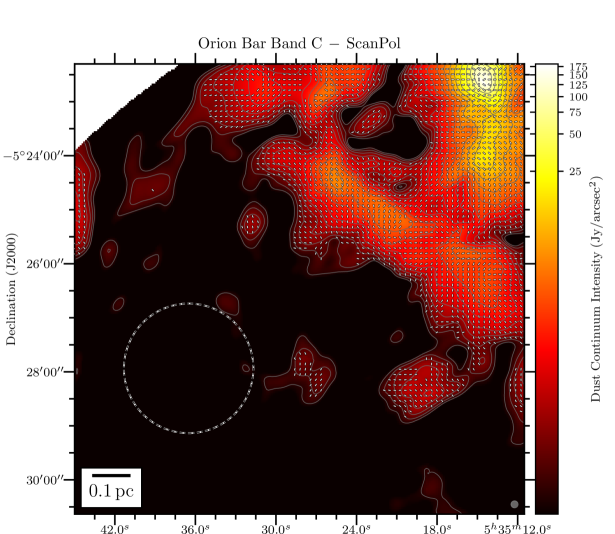
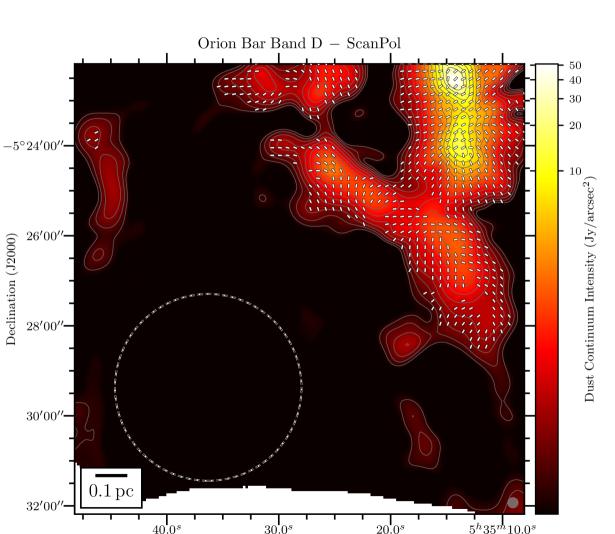
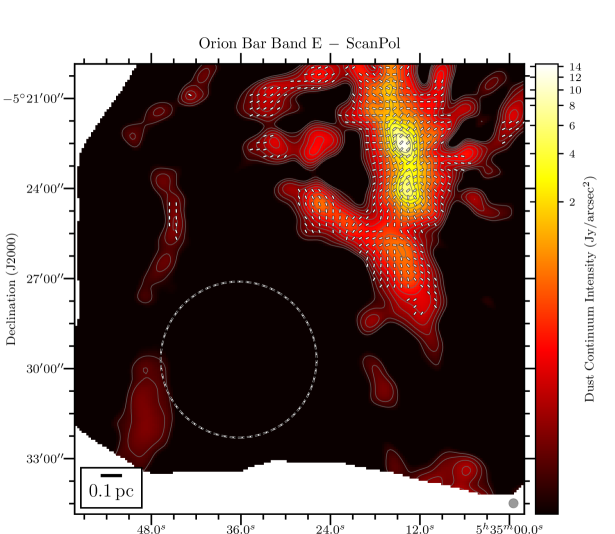
Appendix C C. Can mechanical torques contribute to the alignment of dust grains?
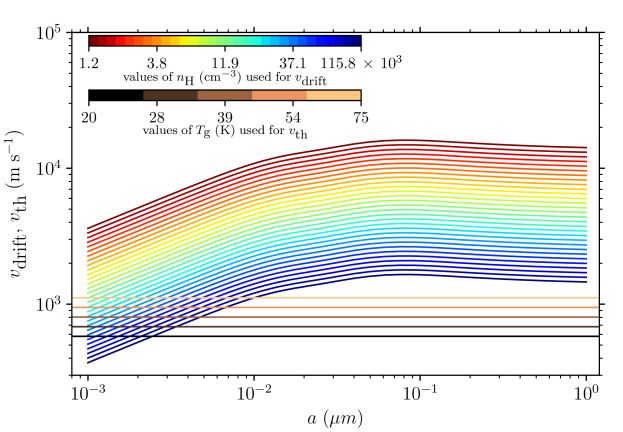
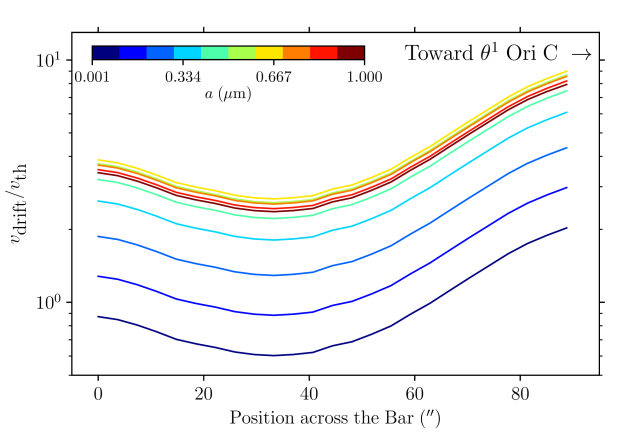
We now discuss the potential contribution that Mechanical Torques (METs) can have on the alignment of grains within the Orion Bar. Similarly to RATs, METs consist in the torque applied to dust grains induced by an anisotropic flow of colliding gas particles (Lazarian & Hoang, 2007). Numerically tested in Hoang et al. (2018); Reissl et al. (2022), the MET mechanism can contribute to the alignment of grains with the magnetic field (or even with the gas flow direction for high enough velocity), if internal alignment is ensured. There is, as of yet, no direct observational evidence for METs, given that is it highly degenerate to measure separately the orientation of magnetic field lines and gas-dust drift velocity. However, we can estimate the drift velocities of aggregates in the Orion Bar driven by the radiation pressure using a one-dimensional approach. We follow the method developed in Section 6.3 of Schirmer et al. (2022), which consists in deriving the asymptotic drift velocity of a grain subject to a radiative pressure force (induced by radiation field spectrum of Ori C), a drag force induced by gaseous collisions, and a gravitational force (assuming the local gravitational potential is governed by the Trapezium cluster). The left panel of Figure 16 shows the drift velocities obtained for the range of gas volume density values encountered in the Orion Bar (using the density values derived above from Chuss et al. 2019; see Section III.2) as a function of grain sizes. We also show the thermal velocities (i.e., the typical velocity of gas particles, with ) for the range of temperature values of Bar (assuming here ). We compute the ratio for every pixel of the Bar, and show in the right panel of Figure 16 the average evolution of the ratio as a function of the position along the minor axis of the Bar, directed toward Ori C, for different grain sizes. On the irradiated side of the Bar, we reach values of for grains of m in size, and values of for grains of m in size.
These calculations are, however, subject to several caveats. We assume that the drag force is totally anisotropic and entirely due to gas collisions. The plasma drag and Lorentz forces are thus not taken into account, even though they are expected to play an important role in the development of instabilities, that decouple gas from dust (see the work of (Hopkins et al., 2022) for HII regions). Additionally, because of its spatial resolution, the map of gas volume density used in our study does not reflect the presence of high density clumps (; see Lis & Schilke 2003; Andree-Labsch et al. 2017; Habart et al. 2022). Such high density layers should be efficient at reprocessing the radiation field from the Trapezium cluster. Indeed, the subsequent modification and attenuation of the spectrum of the heating source (taken as the blackbody of Ori C in the equation) can significantly decrease the efficiency of the radiative pressure force, which in turn can decrease the gas-dust drift velocity. Therefore, the drift velocities derived here are most likely overestimates, especially for the values passed the dissociation front.
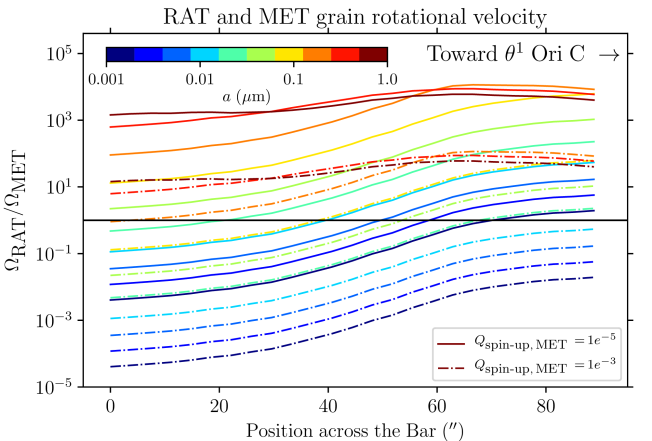
In order to determine which of the two alignment mechanisms between RATs and METs dominate within the Orion Bar, we show in Figure 17 the ratio of the respective grain rotational velocities as a function of the position across the Orion Bar, for different grain sizes. We use Equations of Section 3.2 and 3.4 of Hoang et al. (2022), with our derivation of the gas-dust drift velocities presented in Figure 16. We treat the spin-up efficiency of METs as a free parameter, and use explore the range , given the numerical calculations of Hoang et al. (2018); Reissl et al. (2022). We find that the deeper into the Orion Bar, the more important the contribution of METs is, due to the strong attenuation of the radiation field. However, this is where we trust our derivation of the gas-dust drift velocities the least, for the reasons discussed above. Close to the irradiated edge of the Bar, RATs dominate if we assume a low value of MET spin-up efficiency, i.e., , and METs can contribute to the alignment of grains m in size if we assume . In summary, the degeneracies generated by the estimation of the gas-dust drift velocities and the MET spin-up efficiencies make prediction of the role played by MET challenging. Staying conservative with those degeneracies, we do not predict that METs are dominant in the Orion Bar PDR.
Appendix D D. Starlight Polarization
Figure 18 presents detections of H-band (1.65 m) and K-band (2.2 m) starlight polarization detection toward the Orion nebula, on top of the HAWC+ Band C dust polarization map. The starlight polarization data (Clemens et al. in preparation) was taken with the Mimir instrument (Clemens et al., 2007) on the the 1.83m Perkins telescope, located outside Flagstaff, AZ. We retrieve the distance of those stars with Gaia DR3 (Gaia Collaboration et al., 2022), and separate them into three sub groups, i.e., foreground ( < 390 pc), within the cloud (410 < < 390 pc), and background ( > 410 pc). Our goal is to analyze the evolution of the starlight polarization angle as a function of distance, in order to constrain the 3D magnetic field topology, and to quantify the contribution of the background OMC-1 cloud in the dust polarized emission, in the LOSs of the Bar. Unfortunately, not enough stars have been detected within our region of interest to compute statistics. However, we highlight that such comparisons between polarization in extinction and polarization seen in emission is promising, toward such environments that are expected to experience intense gradients in grain alignment conditions. Figure 18 shows that such work can be done toward the Orion Veil nebula with future, more sensitive FIR polarization observation.