The Outburst of the Young Star Gaia19bey
Abstract
We report photometry and spectroscopy of the outburst of the young stellar object Gaia19bey. We have established the outburst light curve with archival Gaia “”, ATLAS “Orange”, ZTF -band and Pan-STARRS “”-filter photometry, showing an outburst of 4 years duration, longer than typical EXors but shorter than FUors. Its pre-outburst SED shows a flat far-infrared spectrum, confirming the early evolutionary state of Gaia19bey and its similarity to other deeply embedded young stars experiencing outbursts. A lower limit to the peak outburst luminosity is 182 at an assumed distance of 1.4 kpc, the minimum plausible distance. Infrared and optical spectroscopy near maximum light showed an emission line spectrum, including H I lines, strong red Ca II emission, other metal emission lines, infrared CO bandhead emission, and a strong infrared continuum. Towards the end of the outburst, the emission lines have all but disappeared and the spectrum has changed into an almost pure continuum spectrum. This indicates a cessation of magnetospheric accretion activity. The near-infrared colors have become redder as Gaia19bey has faded, indicating a cooling of the continuum component. Near the end of the outburst, the only remaining strong emission lines are forbidden shock-excited emission lines. Adaptive optics integral field spectroscopy shows the H2 1–0 S(1) emission with the morphology of an outflow cavity and the extended emission in the [Fe II] line at 1644 nm with the morphology of an edge-on disk. However, we do not detect any large-scale jet from Gaia19bey.
1 Introduction
Young Stellar Objects (YSOs) in Spectral Energy Distribution (SED) classes I and II, i.e. stars in their late accretion phase, often show substantial variability due to instabilities in the accretion process and variations of the extinction. The accretion characteristics of young stars have recently been reviewed by Hartmann et al. (2016) and we follow their general line of discussion and the references therein.
Traditionally, the photometric outbursts of young stars caused by increased accretion rates were divided by Herbig (1977) into two classes, based on a small number of photographically discovered cases: FU Orionis objects (FUor) and EX Lupi objects (EXor). The outburst amplitude is similar for both classes, but the FUor outbursts last for decades to centuries, while EXor outbursts last from months to maybe a few years.
The first known outburst of a young stellar object, FU Orionis, still remains the most substantial of these accretion instability events, having hardly declined in brightness from its maximum as first discussed by Herbig (1977). For a recent comparison of FUor-type light curves see Hillenbrand et al. (2019), who compare the recently discovered FUor PTF14jg with the classical examples, and the comprehensive review of eruptive YSOs by Audard et al. (2014).
The short duration EXor outbursts are typically repetitive on timescales of a few years to decades, as illustrated in the case of the deeply embedded EXor V1647 Ori in a series of papers culminating with Aspin (2011), and more broadly reviewed by Audard et al. (2014).
These two classical types of YSO outburst are also distinct spectroscopically. EXors are characterized by an emission line spectrum probably produced in optically thin funnel flows in a magnetospheric accretion scenario and veiling of photospheric absorption lines by an UV and optical continuum produced in high-temperature shocks. In contrast, the more substantial FUor outbursts show a low-gravity absorption line spectrum reminiscent of a supergiant photosphere thought to be caused by a self-luminous optically thick accretion disk.
As more and more YSO outbursts have been observed thanks to better all-sky monitoring at optical wavelengths, mostly at “red” wavelengths, and substantial surveys of star-forming regions in the infrared, these newer discoveries have begun to fill a continuum of light curve characteristics such as amplitude, rise time, and rate of decline. Such outbursts with intermediate characteristics, in particular those more deeply embedded than EX Lupi itself and associated with reflection nebulosity or outflow features and generally being more luminous than the prototypical EX Lupi, have been called “Newest EXors” by Lorenzetti et al. (2012) and “MNors” by Contreras Peña et al. (2017a, b)
The spectroscopic properties of eruptive young stars also show a wide diversity that challenges the simple EXor vs. FUor classification scheme established by Herbig (1977). In particular, some objects show a nearly featureless continuum spectrum, indicative of dominant dust emission, and therefore cannot be classified as either FUor or EXor. The first of these objects, initially called a “deeply embedded outburst star” was OO Ser discovered and studied by Hodapp et al. (1996, 2012) that also exhibited an outburst duration of about two decades, longer than any EXor and shorter than any FUor.
In this paper, we use the term “EXor” in the broad sense of a YSO outburst of short duration of at most a few years and with an emission line spectrum. We do not imply that all EXors must closely resemble the prototypical EX Lupi, a low-luminosity (L=0.73 ) T Tauri star (SED Class II) without associated nebulosity and essentially no extinction, with a rich optical emission line spectrum (Herbig, 2007) but a near-infrared absorption spectrum (Sipos et al., 2009).
The total number of known YSO outburst objects is still quite small, at most a few dozen objects of the FUor, EXor, and intermediate classes combined. A detailed study of each individual case is therefore important for understanding the full range of eruptive phenomena displayed in this type of objects.
We report here on the preliminary characterization of Gaia19bey at = 20:40:44.39 = +46:53:21.34 (J2000.0), first noted in a Gaia alert (Gaia19bey) (Gaia Collaboration, 2016) on 2019 April 3 as “red source brightens by 3 mags over 2.5 years”. 111http://gsaweb.ast.cam.ac.uk/alerts/alert/Gaia19bey/.
2 Gaia19bey: Location and Distance
Except for its inclusion in the IRAS and 2MASS point
source catalogs as IRAS 20390+4642 and
J20404439+4653215, respectively,
Gaia19bey has not been studied before.
It is not included in the Gaia-DR2 catalog
(Gaia Collaboration et al., 2018),
presumably because
it was too faint when those data were taken.
Consequently, we do not know its distance directly.
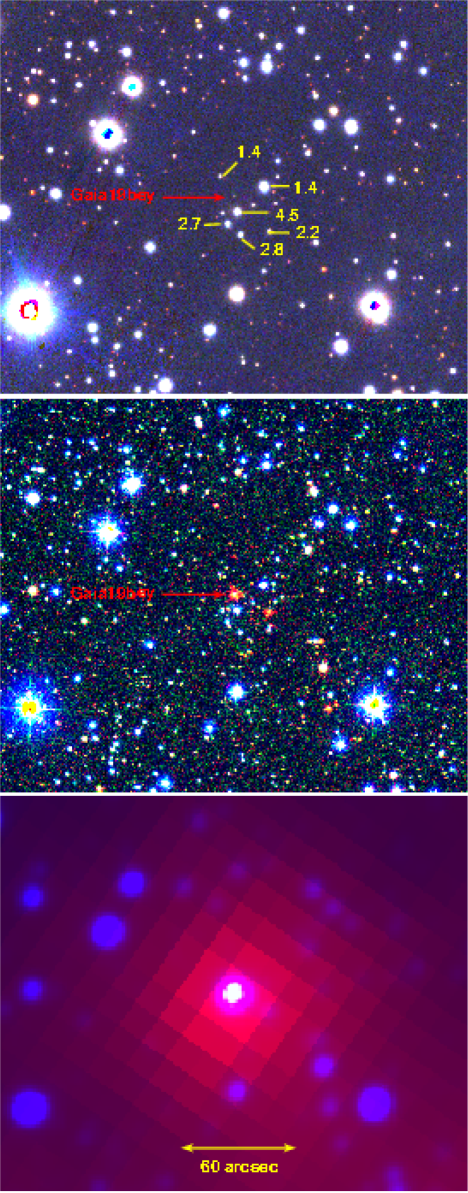
Gaia19bey is located at Galactic coordinates l = 85.48489°b = +3.07714°between the outer perimeter of the high extinction region Cygnus-X centered on Cygnus OB2 and the Cygnus OB7 region, summarized in the review chapter on Cygnus in Reipurth & Schneider (2008). The Cygnus-X star forming complex is at a distance of 1.40 0.08 kpc based on measurements of embedded methanol and water masers by Rygl et al. (2012). However, in this region of the sky, distance measurements are notoriously difficult since the line of sight is basically along the local spiral arm, as Rygl et al. (2012) had pointed out, and objects at different distances may be superposed on the sky.
| Gaia ID | Parallax [mas] | Error [mas] | RUWE | Dist [kpc] |
|---|---|---|---|---|
| 2167375909294267392 | 0.449 | 0.149 | 0.944 | 2.2 |
| 2167375913600701568 | 0.729 | 0.035 | 0.985 | 1.4 |
| 2167375707442271744 | 0.356 | 0.103 | 0.969 | 2.8 |
| 2167375913600703744 | 0.223 | 0.061 | 0.996 | 4.5 |
| 2167375707442274304 | 0.369 | 0.083 | 1.001 | 2.7 |
| 2167375909294286208 | 0.707 | 0.273 | 1.065 | 1.4 |
A small number of low-extinction stars near this group of reddened objects around Gaia19bey have Gaia DR-2 (Gaia Collaboration et al., 2018) distances with better than 3 significance. These are indicated as yellow labels (in kpc) in Figure 1 and are listed in Table 1 in order of increasing RA. All stars listed there have Renormalised Unit Weight Error (RUWE) around 1.0, well below the upper limit of 1.4 considered to be an indicator of astrometrically reliable data (Lindegren et al., 2018). The two shortest distances among this group of 5 stars are consistent with the distance to Cygnus-X of 1.4 kpc. However, three of these stars have a distance in the range of 2.2 - 2.8 kpc, and one is measured at a distance of 4.5 kpc. From this small number of Gaia distances, we conclude that the distance to the Cygnus-X region of 1.4 kpc is a lower limit to the distance to Gaia19bey, but that its distance is probably higher, at least in the range above 2 kpc. If we take the single 4.5 kpc measurement of an unreddened star as reliable, this makes 4.5 kpc a lower limit to its distance. For the purpose of determining the luminosity of the object, we use the lower limit of 1.4 kpc as the distance to Gaia19bey.
We have inspected publicly available images from the Pan-STARRS 3- survey
(Chambers et al., 2016),
the INT Photometric H-Alpha Survey IPHAS
(Drew et al., 2005),
the Two Micron All-Sky Survey 2MASS
(Skrutskie et al., 2006),
the United Kingdom Infrared Deep Sky Survey UKIDSS (Lawrence et al., 2007)
and the Wide-Field Infrared Survey Explorer WISE
(Wright et al., 2010).
A subset of these archival images has been included in the three
color composites in Figure 1. In all of these images, Gaia19bey is
the star in the center of the image, very faint at optical wavelengths,
but dominant in the far infrared. The middle panel shows the Pan-STARRS PS1 z-band
(Tonry et al., 2012)
and the UKIDSS and band images, showing that Gaia19bey is the brightest
in a small group of highly reddened stars clearly distinct from the
surrounding star field. We work under the assumption that this group of
reddened stars outlines a small molecular cloud seen in absorption against
more distant stars in the local spiral arm.
The bottom panel of Figure 1 is composed of WISE 3.4 m, WISE 12 m and
AKARI Far-Infrared Surveyor (FIS) Wide-S (90 m)
(Murakami et al., 2007)
data and shows that Gaia19bey is the
only object in this small group with
strong mid-IR and far-IR emission and that it does not suffer confusion with other
far-IR point sources so that its SED can be reliably measured.
The archival PS1 3 survey images used in Fig. 1 are composites of observations taken between MJD 55000 and 56500 and represent 222MJD = JD - 2400000.5 what we consider the quiescent state of Gaia19bey, despite some relatively minor variations that will be discussed in section 4.1. The UKIDSS and WISE images used in Figure 1 were taken in the same quiescent phase of the light curve as indicated in the top panel of Figure 2. The only image used in Fig. 1 that we cannot put into the context of the light curve is the 90 m images from AKARI. The AKARI mission (Murakami et al., 2007) operated between MJD 53863 and 54338, a few years before Pan-STARRS started its observations.
While the whole Cygnus-X region shows numerous H emission regions, a careful inspection of the available optical and near-infrared images, in particular the H images of the IPHAS survey (Drew et al., 2005; Barentsen et al., 2014) did not show any reflection nebulosity or large scale jet-like features associated with Gaia19bey at seeing-limited resolutions.
3 Observations and Results
3.1 Gaia and ATLAS
The Gaia -band photometric data were obtained from the Gaia alert data base and form the basis for the light curve in Figure 2. 333http://gsaweb.ast.cam.ac.uk/alerts From the start of the measurements on 2014 November 30 to 2016 August 4, Gaia did not return significant detections of our object, and from the faintest reported measurements we treat these non-detections as upper limits at = 20.5.
Many of the bright data points of the optical light curve of Gaia19bey are archival data from the ATLAS project described by Tonry et al. (2018). ATLAS usually takes more than one image of any given region of the sky in each suitable night to follow fast-moving asteroids. For the light curve points in Figure 2, we have median-combined the individual measurements for each night when the photometric zero points and sky brightness were stable. From the small number of epochs when closely coinciding Gaia and ATLAS or Pan-STARRS data points were available, the magnitude offset in each filter was determined and the other light curve points in that filter were shifted accordingly, so that the full light curve is effectively in Gaia- magnitudes. We did not have the data to also match second order (color) effects. The ATLAS data points have fairly large errors in the fainter phases of the light curve and we therefore include only the brighter (effectively 18.0) ATLAS “Orange” data points in Figure 2. The current outburst is the largest observed in the past decade, but smaller variations are seen in the older Pan-STARRS data.
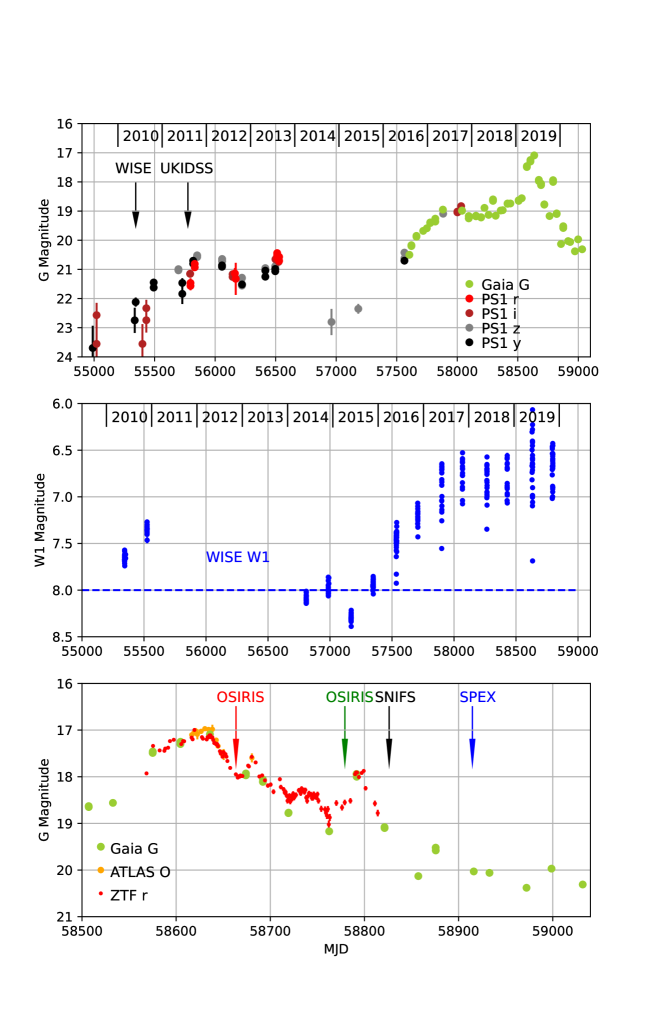
Middle Panel: WISE W1 photometry, combining data from the cryogenic mission, NEOWISE, and the resumed NEOWISE. The W1 band saturation limit is indicated by a dashed line.
Bottom Panel: The arrow symbols indicate the epochs when spectra were taken, and the colors are the same as used in Figures 5 (Section 3.4) and Figure 6 (Section 3.5).
3.2 Pan-STARRS-1
The Panoramic Survey Telescope and Rapid Response System (Kaiser et al., 2010, Pan-STARRS) is a wide-field optical imaging sky survey project. The PS1 3 survey (Chambers et al., 2016) patrolled the entire sky north of Declination. at multiple epochs between June 2009 and April 2014 and in 5 filters () (Tonry et al., 2012). The 5 single-epoch depths are down to 22.0, 21.8, 21.5, 20.9, and 19.7 mag, respectively and photometric calibration uncertainty of the survey is mag. We extracted the photometric data from the PS1 third full reduction data set through the PS1 internal database system. Additionally, we ingested some post-PS1 3 survey data covering our target, hence the time baseline extends up to May 2017. The additional data were also calibrated by a reference catalog generated from the previous reductions data (Magnier et al., 2016). For the light curve in Figure 2, we have shifted the magnitudes in any of the PS1 filters to the Gaia photometry, when closely coincident epochs were available. This shifting is just the first order of adjusting the different filter data and does not include color correction because coincident color information was not available. These adjusted Pan-STARRS data give an approximate light curve covering the years from 2009 to 2017 effectively in Gaia magnitudes, when neither Gaia nor ATLAS data are available.
3.3 Archival Data
To complement the ATLAS data, we have downloaded 444https://irsa.ipac.caltech.edu archival -band photometry of Gaia19bey from the Zwicky Transient Facility (ZTF) (Bellm et al., 2019) archive (Masci et al., 2019). These data reach about one magnitude fainter than the ATLAS data and cover the outburst maximum very well. Similar to the procedure for ATLAS and Pan-STARRS, we shifted the ZTF magnitudes by a fixed amount to match the Gaia photometry.
We have included archival data from the WISE (Wright et al., 2010) and NEOWISE (Mainzer et al., 2014) missions downloaded from the NASA/IPAC Infrared Science Archive 4 in the light curve (Middle panel in Figure 2). Most of the WISE data in the W1 and W2 bands on Gaia19bey are saturated, but the fainter W1 data points prior to the present outburst are unsaturated and confirm the brightness minimum that is otherwise only indicated by just two Pan-STARRS measurements. The W1 band data points above saturation still contain some useful information in that they confirm the basic shape of the light curve during the outburst.
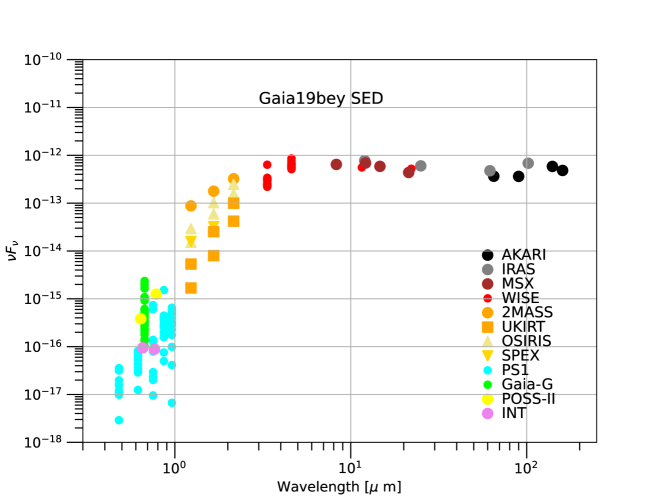
Figure 3 shows the spectral energy distribution (SED) of Gaia19bey based on ground-based and space-based survey data obtained from VizieR. The infrared and far-infrared data are from the compilation of catalog data by Abrahamyan et al. (2015, and references therein) and include data from WISE (Wright et al., 2010), MSX (Egan & Price, 1996), AKARI (Murakami et al., 2007), and IRAS (Neugebauer et al., 1984). The 2MASS data are from the point source catalog (Skrutskie et al., 2006). The photographic data points (DSS) are from the guide-star catalog of Lasker et al. (2008). In the optical and near-infrared we have compiled all available individual photometric values from Pan-STARRS PS1, the 2MASS and UKIDSS surveys, and NEOWISE. All these data were taken without any knowledge of the light variations of Gaia19bey and do not represent the full range of brightness variations that Gaia19bey may have experienced in the past, but they give an impression of the typical variations of the short end of the SED with its variability. Since Gaia has covered this object from invisibility, i.e. G 20.5, early in its mission to the current maximum, those data points represent a good lower limit of the total variability this object has experienced in the past. Also, we note that Gaia19bey must have been in a previous, but unrecognized outburst when the 2MASS photometry was obtained on 1998 November 3 since the 2MASS catalog photometry is brighter than the maximum of infrared photometry measured during the present outburst. For wavelength longer than 4.6 m, we do not have multi-epoch data from individual missions, but some of the observed scatter may still be due to variability.
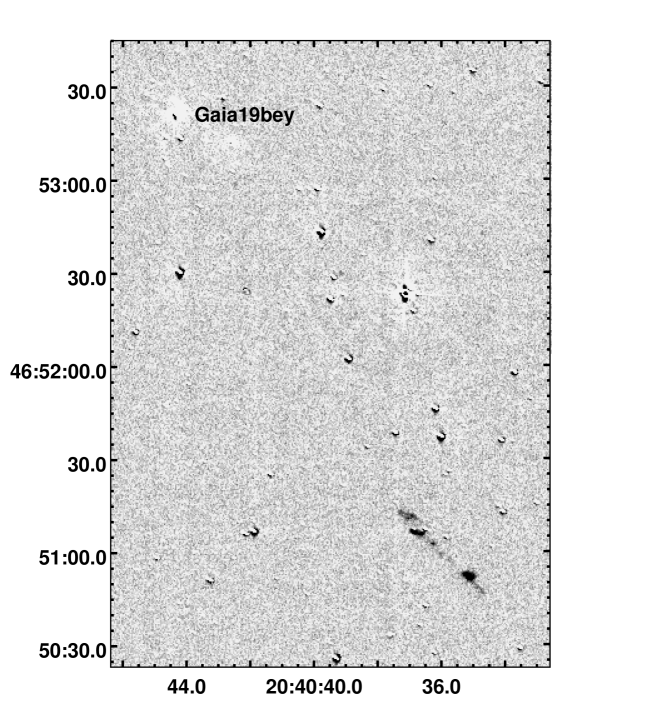
3.4 UKIRT WFCAM Imaging
Deep infrared images were obtained in the , , bands and the narrow-band S(1) line filter with the Wide-Field Camera (WFCAM) described by Casali et al. (2007) on UKIRT on 2020 June 20. The exposure time of individual frames was 1.0 s in J, H, and K with 5 coadds per position and a total of 72 dithered frames taken, resulting in a total integration time of 360s. We have verified that the detector did not saturate in the K band on this relatively bright object. In the S(1) filter, the individual frame exposure time was 20s, and the total integration time in the 72-point dither pattern was 1440 s. The continuum subtracted image in Figure 4 is the S(1) line image with 1.2 times the K-band in the 1 s individual exposures image subtracted for optimal subtraction of field star. The stars in the group of highly reddened stars near Gaia19bey had higher -band flux than the average field stars and are therefore oversubtracted in Figure 4. It is noteworthy that the UKIDSS image of Gaia19bey had an exposure time of 5 sec and was in the non-linear regime of the detector, despite the fainter magnitude at the time. 444http://casu.ast.cam.ac.uk/surveys-projects/wfcam/technical/linearity To account for this possible systematic effect, we estimate a larger error for this data point, as indicated in Table 2.
3.5 UH 88” SNIFS Optical Spectroscopy
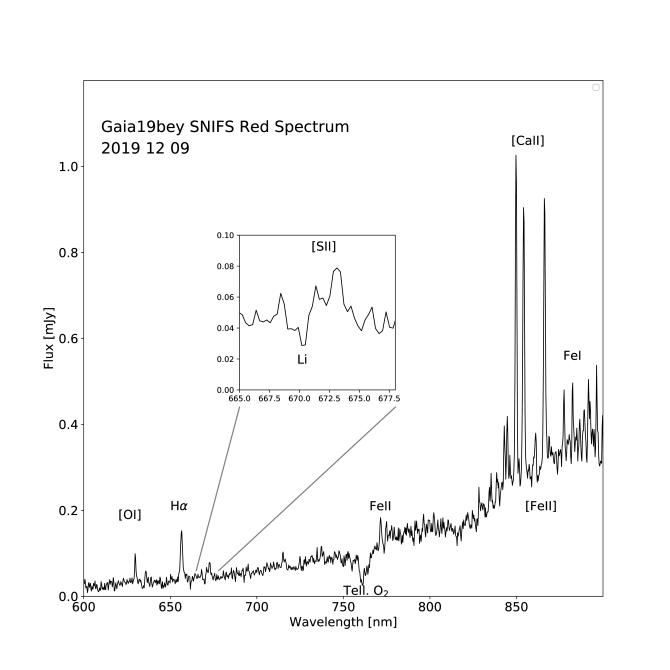
We obtained an optical spectrum of Gaia19bey with the “SuperNova Integral Field Spectrograph” (SNIFS) described in Lantz et al. (2004) at the UH 88” telescope on 2019 December 9 (MJD 58826). SNIFS is a dual-channel instrument, but we only show the red part of the spectrum in Figure 5 because the blue channel spectrum was too faint to show any features. The spectral resolution is approximately R 1300. The spectrum has not been corrected for telluric absorption, and the absorption feature of O2 at 760 nm (Rudolf et al., 2016) is clearly visible, but does not affect the interpretation of this spectrum. The line identifications are based on the study of Herbig AeBe stars by Hamann & Persson (1992).
3.6 Infrared Spectroscopy
We obtained infrared spectroscopy covering parts of the wavelength range 1.0 - 2.5 m during two observing nights at the Keck 1 telescope, and using director’s discretionary time on the NASA Infrared Telescope Facility (IRTF). All infrared spectra are shown in Figure 6.
3.6.1 Keck OSIRIS Infrared Spectroscopy
Gaia19bey was observed using the OSIRIS integral field spectrograph (Larkin et al., 2006) at the Keck 1 telescope on 2019 June 29 and 2019 October 23. The median spectral resolution at the wavelength of our H2 1–0 S(1) line observations is R 3500. The night of 2019 June 29 was mostly cloudy and Gaia19bey was observed as a backup program towards the end of the night through gradually clearing cirrus clouds. With OSIRIS, the three order sorting filters , , and were used, and observations of the telluric absorption standard HD 199217 were interleaved with the observations of Gaia19bey. While the correction of telluric atmospheric absorption worked reasonably well under these unstable weather conditions, the flux calibration is not reliable on the level of a few percent. Further, the large number of emission lines, in particular all the hydrogen lines in the filter, made fitting of the continuum flux difficult.
The spectrum of a star was reduced by first extracting the spectra of each spaxel (lenslet) using the OSIRIS data reduction pipeline (DRP). In order to subtract the night sky spectrum, aperture photometry with sky subtraction was done on the individual planes of the data cubes produced by the DRP, using a custom IRAF script based on the IRAF task apphot (Tody, 1986). The resulting spectrum was reformatted as input into the Spextool Xtelcorr tool developed by Cushing et al. (2004) for the IRTF SPEX instrument, so that we have commonality in the telluric correction and flux calibration procedures for the spectra from Keck and IRTF, which will be described further in section 3.6.2.
Some of the OSIRIS data cubes were used to extract continuum subtracted images (Figure 7) of Gaia19bey in the emission lines of [Fe II] at 1644 nm and H2 1–0 S(1). The Br, Na I, and the CO bandhead emission lines originate in an unresolved region around the star. While most spectra were obtained with the 50 mas spatial scale and the , , and filters of the OSIRIS instrument, a few setup images were taken with the wider 100 mas scale with the filter that leads to much wider spatial coverage of the data cubes. In the continuum-subtracted data cube planes, the H2 1–0 S(1) line emission is spatially resolved and suggests that it originates from the inner wall of an outflow cavity, as will be discussed in section 4.5.
3.6.2 IRTF SPEX Infrared Spectroscopy
The IRTF SPEX instrument (Rayner et al., 2003) in its short-wavelength cross-dispersed (SXD) mode was used on 2020 March 6 (UT) to obtain a spectrum of Gaia19bey at the faintest flux levels recorded so far during the present outburst, but still slightly above the pre-outburst upper limits from Gaia. We used a 03 slit and observed the A0V star HD 192538 at airmasses closely similar to that of the object observations as the telluric absorption standard. The Spextool software was used for the extraction of the spectrum, telluric absorption correction, in particular for the fitting of the deep hydrogen absorption lines in the standard star spectrum, and photometric calibration, using the same standard star for both telluric absorption correction and flux calibration as described in detail by Cushing et al. (2004).
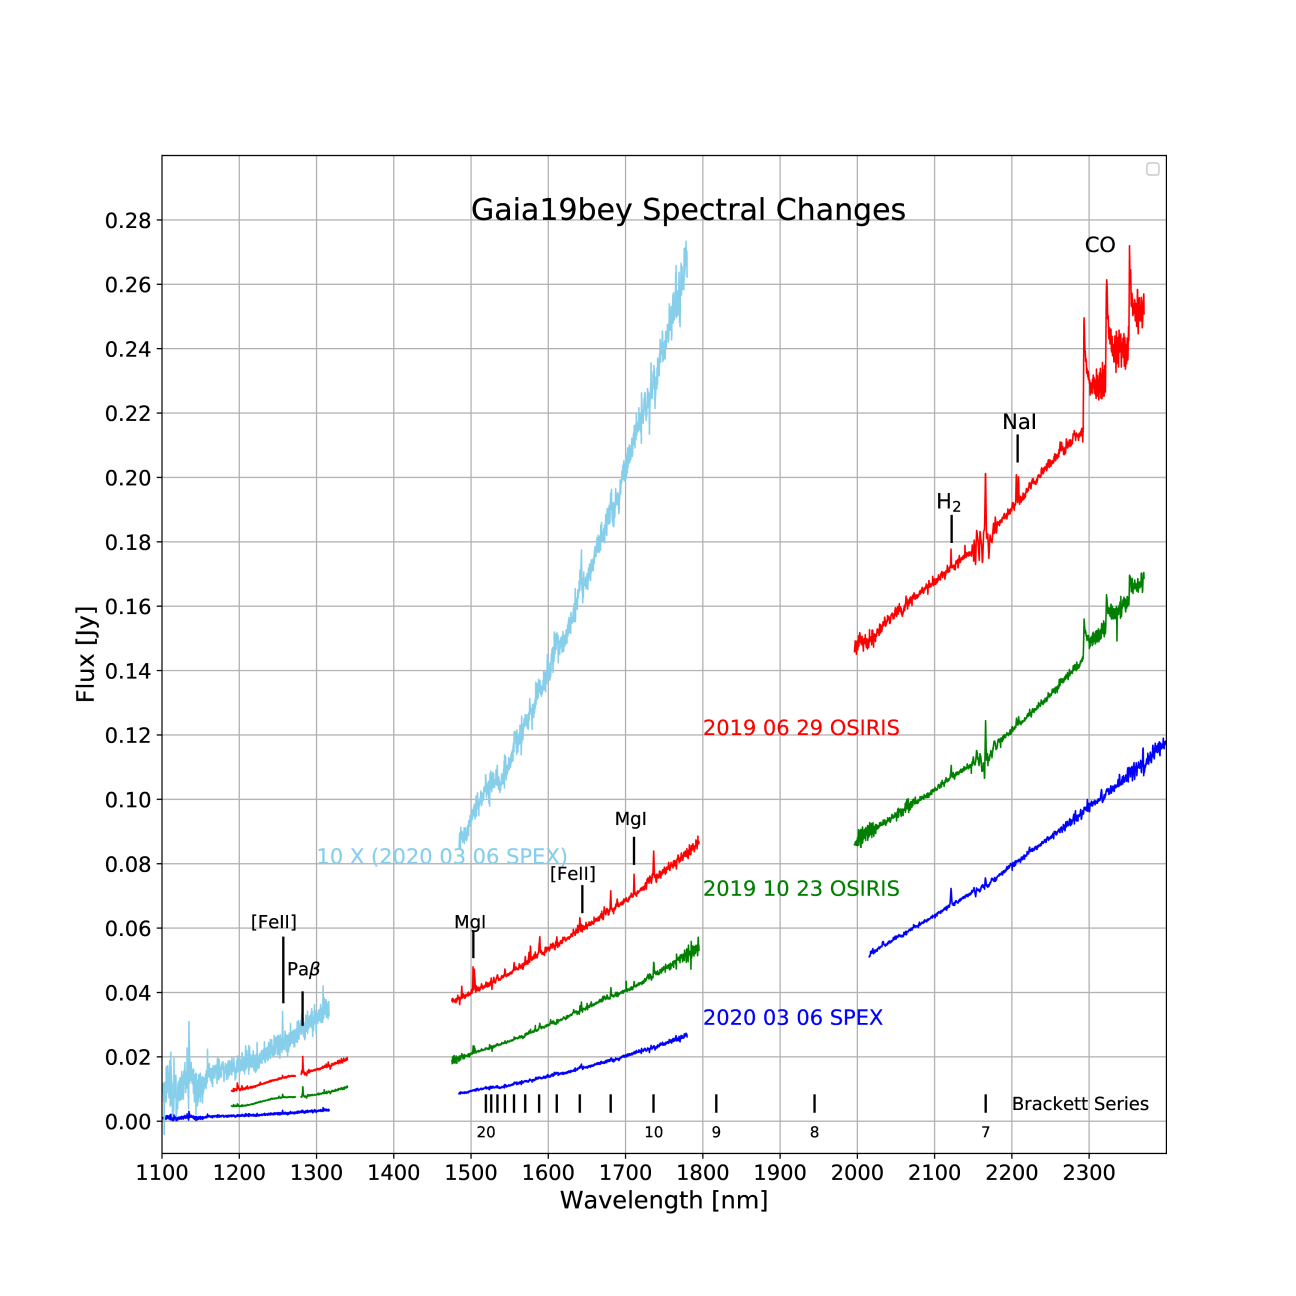
The spectra change from an emission line spectrum near the maximum brightness (red), typical of a deeply embedded EXor outburst, through diminished emission line strength further into the decline (green) to a pure continuum spectrum (blue) late in the outburst. The last spectrum (taken with SPEX) shows only shock-excited forbidden lines of [Fe II] and H2 probably originating in outflow shock fronts.
3.6.3 Photometry Extracted from the Spectra
We have extracted photometry from the flux calibrated OSIRIS and SPEX spectra. The OSIRIS spectra did not cover the full wavelength range of the 2MASS filters (Skrutskie et al., 2006) so the best method that we could use consistently for the OSIRIS and SPEX spectra was to use a line-free average of the measured flux density near the effective wavelength of the 2MASS filters as an approximation of 2MASS photometry. While the OSIRIS spectra are of high signal-to-noise ratio, the main uncertainties in these synthetic magnitudes stem from systematic calibration issues. The 2MASS catalog magnitude of HD199217 has errors of 0.029 mag in J, 0.051 mag in H, and 0.024 mag in Ks. The difference in airmass between the object and standard star observations of maximally 0.05 airmass, combined with an estimate of the extinction coefficient under the prevailing weather conditions of 0.044 mag/airmass from Tokunaga et al. (2002) give only 0.002 mag uncertainty and is negligible compared to the magnitude errors of the calibration star itself. Other erors may come from different Strehl ratio achieved by the adative optics system between the object (laser guide star use) and the standard (natural guide star used). Finally, the night of 2019 June 29 (UT) was non-photometric with the Gaia19bey data being obtained in the clearing phase after the passage of a large cirrus band. We estimate that photometric errors may have been as much as 0.05 mag rms in that night, while we expect the nominally photometric night of 2019 October 23 to have allowed 0.03 magnitudes photometric errors. We are including these error estimates in Table 2. The absolute calibration problems also make the Keck OSIRIS spectra problematic for any attempt to fit models of the continuum emission. We will therefore refrain from discussing possible modeling of this continuum emission.
In contrast to the situation with an integral field spectrograph like OSIRIS, the SPEX data were obtained with a slit of 03 width, chosen to maximize the spectral resolution, but clearly not accepting all the light from the object and therefore problematic for absolute flux determination. While calibrating the spectra with a standard star can give absolute photometry, variations in the seeing are the dominant limitation to the photometric precision of this technique. We have obtained 4 individual exposures of the telluric absorption standard HD192538 and 16 exposures of Gaia19bey. For each individual exposure, the signal profile along the slit direction was fitted with a Gaussian function, and the standard deviation of the best fit signals was computed. We have added the standard deviations of the standard star and the object in quadrature to arrive at an estimate for the error of the measured flux levels of 19% or 0.2 mag. Despite these limitations, the photometry derived from the SPEX data is valuable as it provides absolute fluxes simultaneous with the emission line measurements. We also note that the SPEX photometry where the full spectral range is recorded simultaneously, has much smaller errors in the color of the object, since the seeing, the pointing errors, as well as possible absorption by cirrus clouds, are very similar in adjacent photometric bandpasses, so that these effects largely subtract out.
4 Discussion
Our goal is to put the newly discovered and on-going outburst of Gaia19bey in the context of other, better studied eruptive events in young stars. As already mentioned in the Introduction, we will use the term “EXor” in the broadest sense describing a young eruptive variable with an emission-line spectrum and an outburst duration of at most a few years.
4.1 Light Curve
The light curve (Figure 2) shows a broad maximum from MJD 57500, when Gaia began recording significant detections, to MJD 59000, when the light curve appears to have faded back to within half a magnitude of the pre-outburst levels below = 20.5. The light curve showed a brief spike up to the maximum of = 17.09 on 2019 June 1 (MJD 58605) that had a total duration of less than one year and led to the Gaia alert at a magnitude of = 17.49. While the one-year brightness spike is of the same duration as typical EXor outbursts, the overall outburst duration above = 20.5 (the Gaia detection limit) of 4 yr is longer than those found in classical EXors, but much shorter than that of FUors. The longer duration is in line with many of the higher luminosity eruptive events discovered and studied at infrared wavelengths by Lorenzetti et al. (2012), who called them “Newest EXors” and that Contreras Peña et al. (2017b) used to tentatively define the new MNOR class.
Continguous coverage of the light curve started around MJD 55000 when Pan-STARRS 1 (PS1) began the PS1 3 sky survey. Until the Gaia mission started reporting significant detections of Gaia19bey, these and a few unsaturated data points from the WISE and NEOWISE missions are the only available observations of this object. The earliest Pan-STARRS measurements, combined from all the filters, between MJD 55000 and 55300 (2009) showed a brightness near = 23. Around MJD 55500, the brightness increased by 2 magnitudes to 21 mag, and this rise was partly confirmed by WISE. The light curve between MJD 56500 and the start of the Gaia data at MJD 57500 is only poorly covered since PS1 had completed the 3 sky survey and was now concentrating on asteroid searches and only covered the position of Gaia19bey on two occasions. This flux minimum was, however, observed by the NEOWISE-R mission with four additional data points. These data points were, in fact, the only NEOWISE data points that were not saturated and therefore are a reliable confirmation of the minimum prior to the outburst when the brightness dropped again to 23 mag. In the brighter phase at approximately 21 magnitude, the object showed additional variations of about one magnitude and timescale of 500 days. The outburst amplitude depends on how the quiescent brightness is defined. Prior to the present outburst, our Pan-STARRS photometry suggests a minimum of 22.5 around MJD 57000, even though that time interval is poorly covered with only two Pan-STARRS observations. Relative to this minimum, the outburst amplitude is 5.5 mag in the band.
We have no spectroscopic data from that time period and from optical photometry alone cannot distinguish variations due to accretion variations from variations causes by variable extinction in the light path. Given that the morphology of the forbidden line emission (Figure 7) strongly suggests a disk seen nearly edge-on, variability due to extinction variations is very likely to occur and may be the dominant reason for those brightness variations. Between the start of the PS1 observations and the first Gaia detections, the data indicate initially a faint phase, a brighter phase of 1000 days, and again fainter magnitudes. This is, of course, insufficient to determine that those changes are periodic. However, if we assume some semi-periodicity, it is likely that the latest, much brighter outburst coincided with a period of lower extinction, even though it was not caused solely by lower extinction. In this working assumption of a combination of extinction variations and a stronger variation of accretion, we assume that the baseline for the accretion outburst is the brighter level of the extinction variations in the light curve at 21 mag. Calculating the outburst relative to this mean gives an outburst amplitude of 4 mag, well in the range of other eruptive events in YSOs.
| Date | J | H | K | Source |
|---|---|---|---|---|
| 1998 11 03 | 11.610.02 | 10.050.02 | 8.640.02 | 2MASS |
| 2011 08 02 | 15.900.01 | 13.420.01 | 10.860.03 | UKIDSS |
| 2019 06 29 | 12.800.06 | 10.650.07 | 8.930.06 | OSIRIS |
| 2019 10 23 | 13.510.05 | 11.240.06 | 9.430.05 | OSIRIS |
| 2020 03 06 | 14.710.20 | 11.910.20 | 9.900.20 | SPEX |
| 2020 06 20 | 14.650.01 | 12.170.01 | 9.920.01 | WFCAM |
Some evidence for a prior major outburst comes from the 2MASS catalog (Skrutskie et al., 2006) that shows , , and magnitudes (Table 1) brighter than those seen in the present outburst, and from the fact that the UKIDSS survey recorded much fainter , , and values that we assume represent the quiescent state of Gaia19bey. The UKIDSS -band data point is brighter than the saturation limit reported by Lucas et al. (2008) and is therefore not reliable.
While the early parts of the Gaia light curve prior to MJD 58200 appear to be smooth, starting shortly before MJD 58300, through the maximum, and in the declining phase we see several brief spikes in brightness with typical duration of 10 to 50 days and amplitudes of order 0.5 mag, the earlier of which are very well confirmed by the high-cadence ZTF observations. The durations and amplitudes of these brief spikes are similar to those reported by Semkov (2006); Semkov & Peneva (2012) in the declining phases of the recent outbursts of V1647 Ori. Since these minor spikes in brightness occur in the phase where our spectra indicate on-going accretion activity, they are most likely associated with fluctuations in the magnetospheric accretion process.
4.2 The SED Variations and Luminosity
The SED is a typical “flat spectrum” distribution (Greene et al., 1994). The flat part of the SED extends from the WISE 2 band (4.6 m) out to 160 m from AKARI, characterizing Gaia19bey as a YSO in transition from a deeply embedded infrared object (Class I) to a moderately embedded Class II. At optical and near-infrared wavelengths, the SED rises steeply, indicating substantial dust obscuration in the line of sight. In Section 4.5, we will determine the extinction to the immediate vicinity of the star to be AV = 12 mag. Figure 3 also shows that the observed outburst amplitude is strongly wavelength dependent, being much larger at optical wavelengths than in the infrared.
To determine the luminsity of Gaia19bey during the outburst, we integrated over the available F values and selected the flux at the outburst maximum for the Gaia, 2MASS, and WISE wavelengths, while using the available archival data for longer FIR wavelengths, even though these measurement were not taken during an outburst. Assuming the minimal possible distance of 1.4 kpc, this method gives a lower limit to the luminosity during outburst of 182 , placing Gaia19bey in the luminosity range of typical Herbig Ae/Be stars (Hillenbrand et al., 1992). Considering the uncertainty in the distance, an order of magnitude higher luminosity is within the range of possibilities.
4.3 Color-Color Diagram Locus and Variation
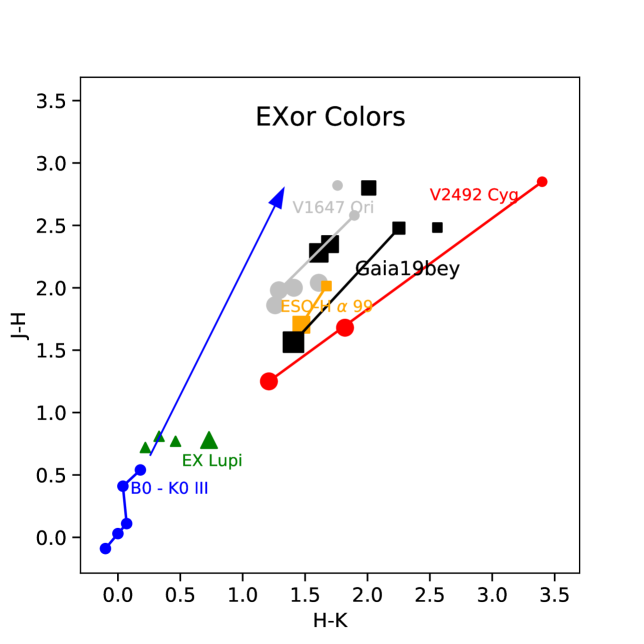
Herbig (2008) has found that eruptive young stars of the EXor type occupy a characteristic locus in the color diagram (their Fig. 10), with redder colors than what main-sequence stars obscured by interstellar extinction would have. Lorenzetti et al. (2012) has shown a similar color-color diagram including all known EXors at the time. While classical EXors, including the prototypical EX Lupi, are only moderately reddened, many of the recently discovered deeply embedded stars with EXor-like spectra are much redder and occupy the upper right area in Figure 8. All these deeply embedded EXors for which , , and photometry in different phases of their outburst is available change their position in the color-color diagram in the sense of being bluer when bright. The variation path in the color-color diagram is flatter than the interstellar extinction vector. If the variations were to be interpreted as solely the effect of extinction variations, this would indicate a less wavelength dependent extinction law, consistent with larger grains than are prevalent in the interstellar medium. However, we will show in Sections 4.4 and 4.5 that the outburst of Gaia19bey is not solely caused by extinction variations. The newly discovered Gaia19bey shares the color-color diagram locus and its variation with other deeply embedded outburst stars studied by Lorenzetti et al. (2012) and is closely similar to ESO-H 99, studied by Hodapp et al. (2019) While these “new EXors” (Lorenzetti et al., 2012) share the basic characteristic of having an emission line spectrum with classical EXors, their outbursts last longer, they are of higher luminosity, and their locus in the color-color diagram is markedly redder.
4.4 Emission Lines
In the optical light curve in Figure 2 we have indicated the times when the spectra were taken with the same color coding as used in Figures 5 and 6 for the spectra. The first infrared spectrum (shown in red in Figure 5), taken on 2019 June 29 (MJD 58664), was taken just one month after the maximum brightness of Gaia19bey during its present outburst at a magnitude of 18.0. The second spectrum (shown in green in Figure 6) on 2019 October 23 (MJD 58779) shows an intermediate stage of the brightness decline ( = 18.5) after the maximum when the brightness was rising again to a minor temporary spike. The emission lines were fainter at that time than in the first spectrum both in absolute terms and relative to the continuum. The change in line strength (Table 3) was more pronounced for the Na I and Mg I doublet lines than for the hydrogen lines. The last spectrum shown in blue in Figure 6, taken with SPEX on 2020 March 6 (MJD 58915) when the Gaia magnitude of 20.0 mag was about 3 magnitudes below the maximum at optical wavelengths, has changed fundamentally, showing an almost pure continuum spectrum with emission lines being an order of magnitude fainter than on 2019 October 23. The most pronounced emission lines in this spectrum are the forbidden shock-excited lines presumably emerging in the outflow at some distance from the star, and apparently not directly affected by the variability.
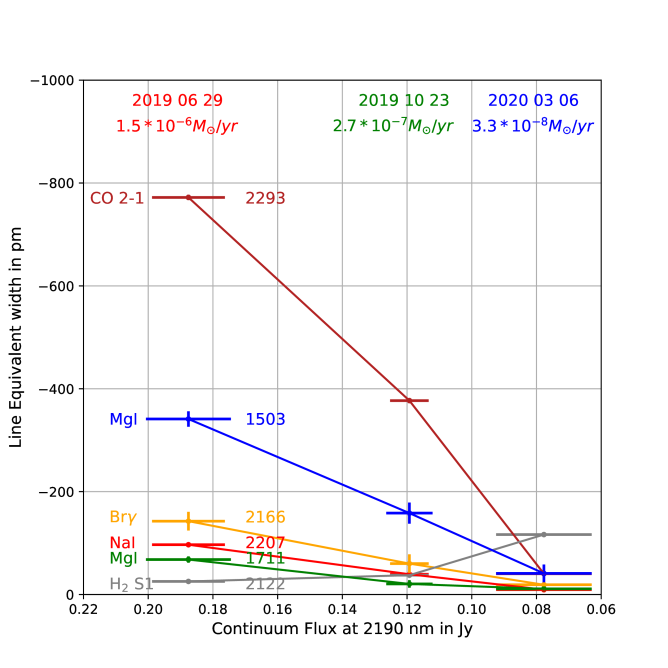
We have measured the equivalent width of several emission lines (Table 3) and plot them against the continuum flux at 2190 nm in Figure 9. This particular wavelength was chosen to be free of detectable emission lines and therefore representative of the continuum component. In this plot, extinction variation due to dust absorption would not change the equivalent width of emission lines shining through that extinction, leading to horizontal lines in this plot. In contrast to this, the equivalent widths strongly decline with declining continuum brightness of the object, indicating that the strong photometric outburst from MJD 57500 to 59000 was caused by a substantial increase in magnetospheric accretion, leading to an EXor-type emission line spectrum.
| Line | Wavelength | 20190629 Flux | 20190629 EW | 20191023 Flux | 20191023 EW | 20200306 Flux | 20200306 EW |
|---|---|---|---|---|---|---|---|
| nm | 10-18 Wm-2 | pm | 10-18 Wm-2 | pm | 10-18 Wm-2 | pm | |
| Pa | 1282 | 6.4 1.3 | -234 49 | 3.5 0.8 | -246 57 | 0.9 0.5 | -165 94 |
| Mg I | 1504 | 18.3 0.8 | -341 15 | 4.5 0.6 | -158 21 | 0.5 0.2 | -41 17 |
| Br 11 | 1681 | 6.9 1.0 | -100 15 | 2.7 0.8 | -65 18 | 0.4 0.1 | -22 7 |
| Mg I | 1711 | 4.9 0.4 | -68 6 | 0.9 0.3 | -21 8 | 0.2 0.1 | -11 5 |
| Br 10 | 1736 | 10.0 0.9 | -133 12 | 4.0 0.6 | -89 13 | 0.2 0.2 | -7 6 |
| H2 S(1) | 2122 | 2.9 0.3 | -25 3 | 2.7 0.2 | -38 3 | 5.2 0.2 | -117 5 |
| Br 7 | 2166 | 16.6 2.2 | -143 19 | 4.4 1.3 | -60 18 | 0.9 0.2 | -19 4 |
| Na I | 2207 | 11.5 0.5 | -97 5 | 3.0 0.3 | -39 4 | 0.5 0.3 | -9 5 |
| CO 2-1 | 2294 | 94.4 0.6 | -770 5 | 30.8 0.4 | -377 5 | 2.2 0.3 | -40 6 |
The optical spectrum taken with SNIFS at the UH 88” telescope (Figure 5) was taken on 2019 December 9 (MJD 58826) at around a magnitude of 19, between the last two infrared spectra both in time and in object brightness. It clearly shows the forbidden line of [O I] at 630.0 nm and weakly indicated the 636.3 nm line The H emission is strong and the blended [S II] 671.6/673.1 nm are weakly indicated. In combination these lines are characteristic of Herbig-Haro shocks. In addition, the Ca II triplet is very strong in emission as is often found in T Tauri stars as discussed, e.g., by Muzerolle et al. (1998). The ratio of these 3 lines is expected to be 1:9:5 proportional to their (gf) values in the optically thin case, as discussed by Azevedo et al. (2006) for the case of classical T Tauri stars. In Gaia19bey, the line ratio is much closer to unity, indicating that the conditions in the line emitting region are close to optically thick. This is similar to the pattern of line strength found by Hamann & Persson (1992) and Hamann & Persson (1992) for T Tauri and Herbig AeBe stars in that the Ca II line at 849.8 nm has the highest line flux. The only absorption line detected in the optical spectrum is the Li I line at 670.8 nm (the insert in Figure 5). The lithium line is an indicator of young age in stars since in convective atmospheres, it is being transported sufficiently deep into the stellar interior to be destroyed by nuclear reactions, as described in the review by Pinsonneault (1997) and the references therein.
4.5 Accretion Luminosity
We have used two infrared emission lines of hydrogen to measure the line luminosity and deduce an estimate for the extinction and the accretion luminosity. For Herbig AeBe stars, less obscured analogs to Gaia19bey in terms of luminosity, Fairlamb et al. (2017) have recently measured both UV continuum emission, a direct indicator of accretion onto the stellar surface, and the line luminosities of many optical and near-infrared emission lines, and have given empirical relationship between these line luminosities and the total accretion luminosity. Gaia19bey is in the luminosity range of Herbig AeBe stars, and we used these Lacc vs. Lline relationships to derive Lacc for two strong hydrogen emission lines (Br and Br 11-4) in our Keck OSIRIS spectra from 2019 June 29 and 2019 October 23. As a side note, Fairlamb et al. (2017) do not give the calibration for Br 10-4, so that we could not use this strong line. Used naively, their calibration procedure ignores the effect of extinction. We can get an estimate of the extinction, and correct the accretion luminosity for extinction by assuming that the two emission lines, when properly corrected for extinction, should give the same accretion luminosity. We used the continuum extinction law measured by Boogert et al. (2011) in lines of sight through dense molecular cores as the best available estimate of the extinction through the edge-on protostellar disk of Gaia19bey. For the 2019 June 29 data when the emission lines were strong, we solved for the extinction, expressed as AK when the accretion luminosity determined by each line becomes the same and obtained an AK = 1.59 0.6 and = 1.39 0.35. For the 2019 October 23 data, when the emission lines were substantially weaker and the determination of the extinction much more difficult, we assumed the same extinction as on 2019 June 29: AK = 1.59, and took the average of the accretion luminosities measured in Br and Br 11-4 as the best estimate listed in Table 4.
| Date | Lacc | dM/dt | AK |
|---|---|---|---|
| L⊙ | M⊙yr-1 | mag | |
| 2019 06 29 | 1.59 0.6 | ||
| 2019 10 23 | 1.59 assumed | ||
| 2020 03 06 | 1.59 assumed |
The uncertainties in these measurements are large, partly due to the faintness of the lines, the less-than-perfect subtraction of the hydrogen absorption lines in the spectrum of the telluric absorption standard star, and due to uncertainty over the extinction law. Despite all this, we conclude that shortly after the maximum of the light curve, Gaia19bey has a similar accretion luminosity and mass accretion rate than the higher end of the distribution of mass accretion rates in Herbig AeBe stars, whose accretion has been studied by Mendigut´ıa et al. (2011). The accretion rate is much lower than that of FU Orionis outbursts where dM/dt = M⊙yr-1 is possible (Audard et al., 2014). For an approximate conversion of the AK extinction into the commonly used AV, we use AV = 7.5 * AK, corresponding to RV = 5 (Cardelli, 1985). Our extinction measurement of AK = 1.59 corresponds to AV = 12 5.
4.6 Spatial Distribution of Shock-Excited Emission
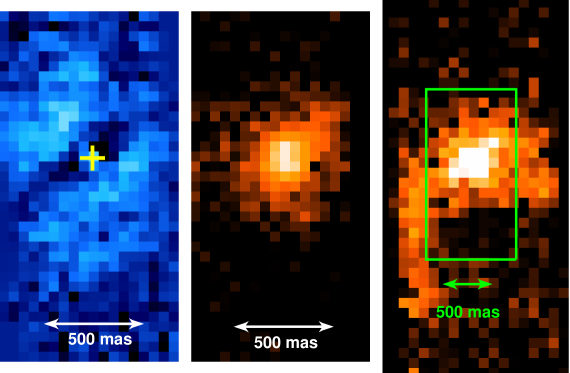
The adaptive optics OSIRIS data cubes were used to extract continuum subtracted images of the emission in the [Fe II] line at 1644 nm, and the H2 1–0 S(1) line at 2122 nm in Figure 7. For the S(1) line, we have two images in the 50 mas and 100 mas per spaxel spatial scales. The [Fe II] emission is extended over 1 ″and shows bifurcating band of low emission across the position of the unresolved continuum source. This morphology strongly suggests that we look at a region of extended [Fe II] emission in an edge-on disk system with the disk plane oriented at P.A. 125°. Similar morphologies were found to be common in young outflow sources when imaged at high spatial resolution with HST by Padgett et al. (1999). Morphological features related to outflow activity are also seen in most other deeply embedded EXors and FUors. The S(1) line shows very different features. At the 50 mas scale, the S(1) emission is only slightly extended to the NW, in the same direction as the dark lane in [Fe II]. The wider view in the 100 mas scale, the right panel in Figure 7, shows what looks like the inner walls of an outflow cavity. The western side of this outflow cavity is not included in our field of view, but in combination with the absorption lane seen in the [Fe II] image (left panel in Figure 7) it is consistent with the axis of the outflow cavity being oriented at P.A. 215°.
We have recorded both the [Fe II] lines at 1256 and 1644 nm, from which, in principle, a value for the extinction can be calculated. However, the lines are very faint in our spectra, and for the OSIRIS spectra, the close proximity of the [Fe II] 1644 nm with the H Br 12 emission line, and consequently the excess noise associated with the correction of the telluric standard absorption line, is problematic. We have therefore decided to forego this exercise. In any case, as Figure 7 shows, the [Fe II] 1644 nm emission arises in an extended region around the star and a dark lane bisecting this extended emission indicates absorption in an edge-on disk, as discussed in Section 4.5.
The presence of an edge-on disk is also consistent with the flat-spectrum characteristics of its SED, which indicates the presence of a substantial amount of relatively cold dust around the object. In young stars, such cold dust is almost inevitably in the form of a disk.
We have imaged the wider field around Gaia19bey with the UKIRT WFCAM in search of more shock-excited outflow features and the continuum-subtracted image (Figure 4) does indeed show a H2 jet with several knots and shock fronts. While this jet lies in the general direction of the opening of the outflow cavity seen in the adaptive optics image (Figure 7), it does not align well with Gaia19bey, and, more importantly, the morphology of the shock fronts suggest that this jet is moving in the general SW to NE direction, i.e., in the general direction towards Gaia19bey. We cannot determine the source of this jet with certainty, but a plausible candidate source is the WISE object J204008.40+464708.0, 6.0 arcmin SW of the jet, that is detectable out to the WISE band 4, and is associated with faint S(1) line emission closer to it. This object is not included in the SIMBAD data base and no records exist in the literature. The important point is that Gaia19bey is not associated with a large scale H2 S(1) jet, outside of the features seen in the adaptive optics images very close to the star. As was mentioned in Section 2, there is also no H emission that could be morphologically associated with Gaia19bey.
4.7 Comparison with Similar Objects
Both the optical spectrum (Figure 5) and the first two of the infrared spectra in Figure 6 show the characteristic emission lines seen in very young EXors. The hydrogen emission lines are generally assumed to originate in the accretion funnels in the magnetosphere of the accreting star, where material flows onto the star along magnetic field lines. The CO bandhead emission is also produced in the hot innermost parts of the accretion disk by irradiation from the accretion hotspots near the surface of the star (Calvet et al., 1991). In the infrared, the emission lines are on a strong continuum indicating substantial emission from hot dust probably irradiated and heated by the accretion hotspots.
While not two eruptive YSOs have identical characteristics, it is useful to put Gaia19bey in the context of similar objects. Gaia19bey is a fairly high luminosity, deeply embedded object in a distant star-forming region. An interesting comparison case is V346 Norma, for which Kóspál et al. (2020) have recently published a detailed spectrum and have discussed changes of the spectrum over the past several decades. V346 Nor has undergone a long-lasting outburst from 1980 to 2010, a relatively brief minimum, and for most of the past decade, a rise back close to the previous outburst level. While the timescales of its variations are an order of magnitude longer than for Gaia19bey, the dip in brightness before the rise to the present maximum appears qualitatively similar.
A spectrum of V346 Norma obtained in 1983 by Reipurth (1985) showed only an absorption spectrum. Less than one year later, in 1984 Graham and Frogel 1985 obtained a spectrum showing weak Li absorption, but also a strong H emission line with a P Cygni profile. Later in the outburst of V346 Nor, in 1993, an infrared spectrum by Reipurth et al. (1997) detected emission of Br, NaI (2206 nm) FeI (2240nm) and CO bandhead emission, similar to what we have observed for Gaia19bey during its outburst. However, the latest infrared spectrum from 2015 (Kóspál et al., 2020) do not detect any of these lines, and the CO bandhead may be absent or weakly in absorption. Their spectrum is dominated by a multitude of [FeII] and H2 emission lines originating in shocks, possibly indicating the emergence of a new HH object or jet. Otherwise, the spectrum is essentially a continuum, similar to what we observe in Gaia19bey in the declining phase of its present outburst.
Another object with characteristics similar to Gaia19bey is the eruptive variable PV Cep. The infrared spectrum obtained by Caratti o Garatti et al. (2013) shows many emission lines, both permitted lines, in particular of atomic hydrogen, similar to those seen in Gaia19bey and probably originating in magnetospheric accretion. In addition, many forbidden lines of [FeII] and H2 were detected and indicate outflow activity, similarly, but with stronger forbidden lines than in Gaia19bey. However, Kun et al. (2011) have demonstrated that the brightness variations in PV Cep cannot solely be explained by accretion variations, but that variations in the extinction also play an important role.
The eruptive young object V1647 Ori, sometimes referred to as McNeil’s Nebula (reference) and being the prototype of the “MNOR” class of deeply embedded high luminosity EXor that Contreras Peña et al. (2017b) have defined, shared many characteristics with Gaia19bey:
1) have SEDs of class I or are flat-spectrum sources, 2) show outburst durations 1.5 yr but shorter than those usually associated with FUors, 3) show spectroscopic characteristics of eruptive variables, i.e. CO emission or absorption, and 4) usually have 2122 nm H2 emission. Also, their sample contains several objects of high bolometric luminosity in the range of hundreds to thousands of , the same range as Gaia19bey, considering the substantial uncertainty of its distance. 5) Similar to at least one object in their sample, Gaia19bey changed from an emission spectrum to a continuum during the declining phase of the outburst.
Aspin et al. (2009) derived a mass accretion rate of during the outburst of V1647 Ori from the Br line, and Aspin et al. (2008) obtained during quiescence. They also point out the substantial role that extinction variations in the scattering path of the reflection nebula must play in explaining the light curve of this object. While we do not detect a reflection nebula near Gaia19bey in continuum, the prevalence of extinction variations in other YSOs strongly suggests that such variations play a role in explaining brightness variations in phases of the light curve when magnetospheric accretion, evident by emission lines, has already subsided.
The spectral changes observed in Gaia19bey are similar to those observed by Guo et al. (2020) in at least two YSOs of the MNOR type in their sample. Their object VVVv374 changed from an emission line -band spectrum to absorption of Br over the course of roughly one year, associated with a 0.5 mag increase in brightness during a longer brightening phase. Their VVVv662 went from Br emission to a pure continuum spectrum after a 1 magnitude drop in -band magnitude.
Changes in the spectrum of Class I protostars were studied by Connelley & Greene (2014) in a sample of non-eruptive objects. Even without major outburst events, changes in emission line ratios were routinely found. However, only one object in their sample, IRAS 03301+3111 showed a strong increase in the near-infrared continuum and a transition from CO in absorption to emission over the course of 3 years.
5 Summary and Conclusions
We have reported observations of the recent outburst of Gaia19bey. The outburst duration of Gaia19bey of 4 yr is longer than typical EXor outbursts, but much less than FUor outbursts and places it between those traditional classes, but it is certainly closer to EXors than to FUor. Gaia19bey shares the NIR colors and mid-to-far IR SED with the most deeply embedded objects in the broadly defined EXor class. Outbursts of Gaia19bey appear to be repetitive: The 2MASS catalog photometry, in comparison with UKIDSS photometry, strongly suggests a prior outburst of similar amplitude sometime around 1998.
The optical spectrum and the two infrared spectra taken in the bright phase of the present outburst show many emission lines, in particular H I,Ca II, Mg I, Na I line and CO bandhead emission, making Gaia19bey also spectroscopically similar to those deeply embedded EXor outbursts. The third spectrum, taken well past the maximum in the declining phase of the outburst, shows a substantial change in the spectral characteristics. All emission lines are an order of magnitude fainter, except the forbidden shock-excited lines that the adaptive optics images show are emitted in nebulosity surrounding the star. The color-color diagram indicates redder colors as the outburst was fading and can be interpreted as a cooling of the continuum component of the spectrum. In the shock-excited H2 1–0 S(1) emission line, Gaia19bey shows the morphology of an outflow cavity, strongly suggesting that it is an active outflow source. The [Fe II] line emission at 1644 nm is extended and shows indications of a disk seen nearly edge-on, with an orientation consistent with the outflow cavity structure seen in the S(1) line.
At the time of writing this paper, the outburst of Gaia19bey appears to be nearing its end, but the pre-outburst brightness has not yet been reached again. The future evolution of the spectrum should be monitored and the quiescent state of Gaia19bey needs to be studied. In particular, it remains to be seen whether a photospheric absorption spectrum will emerge in the quiescent phase, when the dust has sufficiently cooled.
The SPEX data in this paper were obtained at the Infrared Telescope Facility, which is operated by the University of Hawaii under contract NNH14CK55B with the National Aeronautics and Space Administration.
The Pan-STARRS1 Surveys (PS1) and the PS1 public science archive have been made possible through contributions by the Institute for Astronomy, the University of Hawaii, the Pan-STARRS Project Office and their partner institutions, the Max-Planck Society and its participating institutes, the Max Planck Institute for Astronomy, Heidelberg and the Max Planck Institute for Extraterrestrial Physics, Garching, The Johns Hopkins University, Durham University, the University of Edinburgh, the Queen’s University Belfast, the Harvard-Smithsonian Center for Astrophysics, the Las Cumbres Observatory Global Telescope Network Incorporated, the National Central University of Taiwan, the Space Telescope Science Institute, NASA under Grant No. NNX08AR22G, and issued through the Planetary Science Division of the NASA Science Mission Directorate, the NSF Grant No. AST-1238877, the University of Maryland, Eotvos Lorand University (ELTE), the Los Alamos National Laboratory, and the Gordon and Betty Moore Foundation.
This work has made use of data from the ESA mission Gaia 555https://www.cosmos.esa.int/gaia and processed by the Gaia Data Processing and Analysis Consortium (DPAC, 666https://www.cosmos.esa.int/web/gaia/dpac/consortium and the Photometric Science Alerts Team. 777http://gsaweb.ast.cam.ac.uk/alerts Funding for the DPAC has been provided by national institutions, in particular the institutions participating in the Gaia Multilateral Agreement.
ATLAS observations and this work were supported by NASA grant NN12AR55G.
This publication makes use of data products from the Near-Earth Object Wide-field Infrared Survey Explorer (NEOWISE), which is a joint project of the Jet Propulsion Laboratory/California Institute of Technology and the University of Arizona. NEOWISE is funded by the National Aeronautics and Space Administration.
Based on observations obtained with the Samuel Oschin 48-inch Telescope at the Palomar Observatory as part of the Zwicky Transient Facility project. ZTF is supported by the National Science Foundation under Grant No. AST-1440341 and a collaboration including Caltech, IPAC, the Weizmann Institute for Science, the Oskar Klein Center at Stockholm University, the University of Maryland, the University of Washington, Deutsches Elektronen-Synchrotron and Humboldt University, Los Alamos National Laboratories, the TANGO Consortium of Taiwan, the University of Wisconsin at Milwaukee, and Lawrence Berkeley National Laboratories. Operations are conducted by COO, IPAC, and UW. This work uses archival data obtained by AKARI, a JAXA project with the participation of ESA. This work made use of the ADS, Simbad, and VieziR.
This work is based in part on data obtained as part of the UKIRT Infrared Deep Sky Survey and additional near-infrared imaging data from the WFCAM at the UKIRT observatory operated by the University of Hawaii. This publication makes use of data products from the Two Micron All Sky Survey, which is a joint project of the University of Massachusetts and IPAC/Caltech, funded by NASA and NSF.
This paper makes use of data obtained as part of the INT Photometric H Survey of the Northern Galactic Plane (IPHAS, www.iphas.org) carried out at the Isaac Newton Telescope (INT). The INT is operated on the island of La Palma by the Isaac Newton Group in the Spanish Observatorio del Roque de los Muchachos of the Instituto de Astrofisica de Canarias. All IPHAS data are processed by the Cambridge Astronomical Survey Unit, at the Institute of Astronomy in Cambridge. The bandmerged DR2 catalogue was assembled at the Centre for Astrophysics Research, University of Hertfordshire, supported by STFC grant ST/J001333/1.
M.A.T. acknowledges support from the DOE CSGF through grant DE-SC0019323.
We thank the referee for constructive comments that helped improve the paper.
References
- Abrahamyan et al. (2015) Abrahamyan, H. V., Mickaelian, A. M., & Knyazyan, A. V. 2015, Astronomy and Computing, 10, 99
- Aspin et al. (2008) Aspin, C., Beck, T. L., & Reipurth, B. 2008, AJ, 135, 423
- Aspin et al. (2009) Aspin, C., Reipurth, B., Beck, T. L., et al. 2009, ApJ, 692, L67
- Aspin (2011) Aspin, C. 2011, AJ, 142, 135
- Audard et al. (2014) Audard, M., Ábrahám, P., Dunham, M. M., et al. 2014, Protostars and Planets VI, 387
- Azevedo et al. (2006) Azevedo, R., Calvet, N., Hartmann, L., et al. 2006, A&A, 456, 225
- Barentsen et al. (2014) Barentsen, G., Farnhill, H. J., Drew, J. E., et al. 2014, MNRAS, 444, 3230
- Bellm et al. (2019) Bellm, E. C., Kulkarni, S. R., Graham, M. J., et al. 2019, PASP, 131, 018002
- Boogert et al. (2011) Boogert, A. C. A., Huard, T. L., Cook, A. M., et al. 2011, ApJ, 729, 92
- Calvet et al. (1991) Calvet, N., Patino, A., Magris, G. C., et al. 1991, ApJ, 380, 617
- Caratti o Garatti et al. (2013) Caratti o Garatti, A., Garcia Lopez, R., Weigelt, G., et al. 2013, A&A, 554, A66
- Cardelli (1985) Cardelli, J. A. 1985, AJ, 90, 1494
- Casali et al. (2007) Casali, M., Adamson, A., Alves de Oliveira, C. et al. 2007, A&A, 467, 777
- Chambers et al. (2016) Chambers, K. C., Magnier, E. A., Metcalfe, N., et al. 2016, arXiv e-prints, arXiv:1612.05560
- Connelley & Greene (2014) Connelley, M. S., & Greene, T. P. 2014, AJ, 147, 125
- Contreras Peña et al. (2017b) Contreras Peña, C., Lucas, P. W., Kurtev, R., et al. 2017, MNRAS, 465, 3039
- Contreras Peña et al. (2017a) Contreras Peña, C., Lucas, P. W., Minniti, D., et al. 2017, MNRAS, 465, 3011
- Cushing et al. (2004) Cushing, M. C., Vacca, W. D., & Rayner, J. T. 2004, PASP, 116, 362
- Drew et al. (2005) Drew, J. E., Greimel, R., Irwin, M. J. et al. MNRAS, 362, 753
- Egan & Price (1996) Egan, M. P., & Price, S. D. 1996, AJ, 112, 2862
- Fairlamb et al. (2017) Fairlamb, J. R., Oudmaijer, R. D., Mendigutia, I., et al. 2017, MNRAS, 464, 4721
- Gaia Collaboration (2016) Gaia Collaboration, Prusti, T., de Bruijne, J. H. J., et al. 2016, A&A, 595, A1
- Gaia Collaboration et al. (2018) Gaia Collaboration, Brown, A. G. A., Vallenari, A., et al. 2018, A&A, 616, A1
- Giannini et al. (2017) Giannini, T., Antoniucci, S., Lorenzetti, D., et al. 2017, ApJ, 839, 112
- Glass & Penston (1974) Glass, I. S., & Penston, M. V. 1974, MNRAS, 167, 237
- Guo et al. (2020) Guo, Z., Lucas, P. W., Contreras Peña, C., et al. 2020, MNRAS, 492, 294
- Greene et al. (1994) Greene, T. P., Wilking, B. A., Andre, P., et al. 1994, ApJ, 434, 614
- Hamann & Persson (1992) Hamann, F., & Persson, S. E. 1992, ApJS, 82, 285
- Hamann & Persson (1992) Hamann, F., & Persson, S. E. 1992, ApJS, 82, 247
- Hartmann et al. (2016) Hartmann, L., Herczeg, G., & Calvet, N. 2016, ARA&A, 54, 135
- Herbig (1977) Herbig, G. H. 1977, ApJ, 217, 693
- Herbig (2007) Herbig, G. H. 2007, AJ, 133, 2679
- Herbig (2008) Herbig, G. H. 2008, AJ, 135, 637
- Hillenbrand et al. (2019) Hillenbrand, L. A., Miller, A. A., Carpenter, J. M., et al. 2019, ApJ, 874, 82
- Hillenbrand et al. (1992) Hillenbrand, L. A., Strom, S. E., Vrba, F. J., et al. 1992, ApJ, 397, 613
- Hodapp et al. (2019) Hodapp, K. W., Reipurth, B., Pettersson, B., et al. 2019, AJ, 158, 241
- Hodapp et al. (2012) Hodapp, K. W., Chini, R., Watermann, R., & Lemke, R. 2012, ApJ, 744, 56
- Hodapp et al. (1996) Hodapp, K.-W., Hora, J. L., Rayner, J. T., Pickles, A. J., & Ladd, E. F. 1996, ApJ, 468, 861
- Hughes et al. (1994) Hughes, J., Hartigan, P., Krautter, J., et al. 1994, AJ, 108, 1071
- Indebetouw et al. (2005) Indebetouw, R., Mathis, J. S., Babler, B. L., et al. 2005, ApJ, 619, 931
- Juhász et al. (2012) Juhász, A., Dullemond, C. P., van Boekel, R., et al. 2012, ApJ, 744, 118
- Kaiser et al. (2010) Kaiser, N., Burgett, W., Chambers, K., et al. 2010, Proc. SPIE, 77330E
- Kóspál et al. (2020) Kóspál, Á., Szabó, Z. M., Ábrahám, P., et al. 2020, ApJ, 889, 148
- Kun et al. (2011) Kun, M., Szegedi-Elek, E., Moór, A., et al. 2011, MNRAS, 413, 2689
- Lantz et al. (2004) Lantz, B., Aldering, G., Antilogus, P., et al. 2004, Proc. SPIE, 146
- Larkin et al. (2006) Larkin, J., Barczys, M., Krabbe, A., et al. 2006, Proc. SPIE, 6269, 62691A
- Lasker et al. (2008) Lasker, B. M., Lattanzi, M. G., McLean, B. J., et al. 2008, AJ, 136, 735
- Lawrence et al. (2007) Lawrence, A. et al. 2007, MNRAS, 379, 1599
- Lindegren et al. (2018) Lindegren, L., Hernández, J., Bombrun, A., et al. 2018, A&A, 616, A2
- Lorenzetti et al. (2012) Lorenzetti, D., Antoniucci, S., Giannini, T., et al. 2012, ApJ, 749, 188
- Lucas et al. (2008) Lucas, P. W., Hoare, M. G., Longmore, A., et al. 2008, MNRAS, 391, 136
- Magnier et al. (2016) Magnier, E. A., Schlafly, E. F., Finkbeiner, D. P., et al. 2016, arXiv e-prints, arXiv:1612.05242
- Mainzer et al. (2014) Mainzer, A., Bauer, J., Cutri, R. M., et al. 2014, ApJ, 792, 30
- Masci et al. (2019) Masci, F. J., Laher, R. R., Rusholme, B., et al. 2019, PASP, 131, 018003
- Mendigut´ıa et al. (2011) Mendigutía, I., Calvet, N., Montesinos, B., et al. 2011, A&A, 535, A99
- Murakami et al. (2007) Murakami, H., Baba, H., Barthel, P., et al. 2007, PASJ, 59, S369
- Muzerolle et al. (1998) Muzerolle, J., Hartmann, L., & Calvet, N. 1998, AJ, 116, 455
- Neugebauer et al. (1984) Neugebauer, G., Habing, H. J., van Duinen, R., et al. 1984, ApJ, 278, L1
- Padgett et al. (1999) Padgett, D. L., Brandner, W., Stapelfeldt, K. R., et al. 1999, AJ, 117, 1490
- Pinsonneault (1997) Pinsonneault, M. 1997, ARA&A, 35, 557
- Rayner et al. (2003) Rayner, J. T., Toomey, D. W., Onaka, P. M., et al. 2003, PASP, 115, 362
- Reipurth (1985) Reipurth, B. 1985, A&A, 143, 435
- Reipurth et al. (1997) Reipurth, B., Olberg, M., Gredel, R., et al. 1997, A&A, 327, 1164
- Reipurth & Schneider (2008) Reipurth, B., & Schneider, N. 2008, Handbook of Star Forming Regions, Volume I, 36
- Rudolf et al. (2016) Rudolf, N., Günther, H. M., Schneider, P. C., et al. 2016, A&A, 585, A113
- Rygl et al. (2012) Rygl, K. L. J., Brunthaler, A., Sanna, A., et al. 2012, A&A, 539, A79
- Semkov (2006) Semkov, E. H., & Peneva, S. P. 2012, Information Bulletin on Variable Stars, 6025, 1
- Semkov & Peneva (2012) Semkov, E. H., & Peneva, S. P. 2012, Information Bulletin on Variable Stars, 6025, 1
- Sipos et al. (2009) Sipos, N., Ábrahám, P., Acosta-Pulido, J., et al. 2009, A&A, 507, 881
- Skrutskie et al. (2006) Skrutskie, M. F., Cutri, R. M., Stiening, et al. 2006, AJ, 131, 1163
- Straižys et al. (2008) Straižys, V., Corbally, C. J., & Laugalys, V. 2008, Baltic Astronomy, 17, 125
- Tody (1986) –Confirmed Tody, D. 1986, in Proc. SPIE, Instrumentation in Astronomy VI, ed. D. L. Crawford, 627, 733
- Tokunaga et al. (2002) Tokunaga, A. T., Simons, D. A., & Vacca, W. D. 2002, PASP, 114, 180
- Tonry et al. (2012) Tonry, J. L., Stubbs, C. W., Lykke, K. R., et al. 2012, ApJ, 750, 99
- Tonry et al. (2018) Tonry, J. L., Denneau, L., Heinze, A. N., et al. 2018, PASP, 130, 064505
- Wegner (2014) Wegner, W. 2014, Acta Astron., 64, 261
- Wright et al. (2010) Wright, E. L., Eisenhardt, P. R. M., Mainzer, A. K. et al., AJ, 140, 1868