The PEPSI Exoplanet Transit Survey (PETS) I:
Investigating the presence of a silicate atmosphere on the super-Earth 55 Cnc e
Abstract
The study of exoplanets and especially their atmospheres can reveal key insights on their evolution by identifying specific atmospheric species. For such atmospheric investigations, high-resolution transmission spectroscopy has shown great success, especially for Jupiter-type planets. Towards the atmospheric characterization of smaller planets, the super-Earth exoplanet 55 Cnc e is one of the most promising terrestrial exoplanets studied to date. Here, we present a high-resolution spectroscopic transit observation of this planet, acquired with the PEPSI instrument at the Large Binocular Telescope. Assuming the presence of Earth-like crust species on the surface of 55 Cnc e, from which a possible silicate-vapor atmosphere could have originated, we search in its transmission spectrum for absorption of various atomic and ionized species such as Fe , Fe +, Ca , Ca +, Mg and K , among others. Not finding absorption for any of the investigated species, we are able to set absorption limits with a median value of 1.9 RP. In conclusion, we do not find evidence of a widely extended silicate envelope on this super-Earth reaching several planetary radii.
keywords:
planets and satellites: atmospheres – planets and satellites: composition – planets and satellites: terrestrial planets1 Introduction
The detection of atmospheric fingerprints from terrestrial planets outside the Solar System is an important aim of exoplanet science. A suitable method for this is to analyze transmitted stellar light through the atmosphere of an exoplanet, a method called transmission spectroscopy (Seager & Sasselov, 2000). The comparison of the atmospheric fingerprints of the solar system planets to those worlds, especially those with similar properties to Earth (see e.g. Grenfell 2017; Keles et al. 2018; Wunderlich et al. 2021), will help to increase our knowledge about their evolution.
Terrestrial exoplanets could possess different atmospheres, such as a primordial atmosphere, being rich in hydrogen and helium, or a secondary atmosphere with a larger mean molecular weight and absence of hydrogen and helium (Kite & Barnett, 2020). The presence of a secondary type atmosphere on an exoplanet can be attributed to the evolution of a primordial atmosphere. Under the absence of a magnetic field, there is a possibility that a planet in a close-in orbit can lose its hydrogen-rich primordial atmosphere and remain with a rocky surface. Strong stellar irradiation can sputter particles from the exposed surface (Schaefer & Fegley, 2009) and can build up a partly ionized silicate atmosphere or exosphere (Ridden-Harper et al., 2016; Vidotto et al., 2018). Such silicate-vapor atmospheres might be built up also by outgassing processes from molten magma on the surface (Miguel et al., 2011; Ito et al., 2015) and can contain species such as Na , K , Fe , Si , SiO , O and O2, and probably also hydrogen due to resupply processes from magma outgassing (Kite et al., 2019).
Among the close-in terrestrial exoplanets detected to date, the super-Earth 55 Cnc e (Demory et al., 2011; Winn et al., 2011), with MP = 8.0 0.3 M and RP = 1.88 0.03 R (Bourrier et al., 2018), is one of the most studied targets, due to its short orbital period of P 0.66 days and bright host star with a Vmag 6. However, the atmospheric conditions for this planet are still under discussion, due to the applicability of different interior composition scenarios estimated from the observed planetary radius and mass.
Under the assumption of a solid interior mainly composed of iron, carbon, and silicates, the planet might have no thick atmospheric envelope, i.e. exposes mostly a rocky surface (Madhusudhan, 2012), enabling the evolution of silicate-species building up a thin envelope around the planet. On the other hand, considering a less solid rocky interior, the presence of a thick atmospheric envelope is necessary (Bourrier et al., 2018), e.g. an envelope rich in water (Demory et al., 2011; Gillon et al., 2012) or in carbon dioxide and molecular nitrogen (Angelo & Hu, 2017). A primordial gaseous envelope dominated by hydrogen-helium is mainly ruled out as it may evaporate in short timescales, which is also supported by the absence of hydrogen Ly (Ehrenreich et al., 2012) and helium absorption (Zhang et al., 2021).
Different investigations made efforts to confirm one of those scenarios, by searching for atomic and molecular features applying moderate and high-resolution transmission spectroscopy using ground-based facilities:
Assuming the presence of a rocky surface, Ridden-Harper et al. (2016) investigated if the strong stellar irradiation ejected atoms from the surface by sputtering to the exosphere. In their work, a tentative absorption relative to the stellar spectrum of 2.3 × 10⁻³ in the Na-D-lines at a 3- level and 7 × 10⁻² in the ionized CaII h&k lines at a 4.1- level is shown. However, the authors did not claim detection due to low significance of the Na absorption and variable Ca+ signal. Another study on the rocky surface scenario for 55 Cnc e is presented by Tabernero et al. (2020) investigating the absorption in the Na-D-lines and H line. The authors showed an upper limit of (3.4 0.4) × 10-4 to the presence of the Na-D-lines and (7 1) × 10-4 to the presence of the H line, not detecting absorption of these species. The non-detection of hydrogen is in agreement with the findings shown by Ehrenreich et al. (2012), confirming the absence of a primordial atmosphere. Another study that supports this result is demonstrated by Zhang et al. (2021), who did not find evidence of helium absorption on this planet.
Furthermore, different studies investigated molecular absorption features within the atmosphere of 55 Cnc e studying the presence of a secondary atmosphere. For instance, Esteves et al. (2017) and Jindal et al. (2020) investigated the water absorption in the optical wavelength range, not detecting water absorption signature. In addition, Jindal et al. (2020) searched for the absorption signature of TiO also not finding any evidence for this molecule. Note that a water-rich steam atmosphere would dissociate at high altitudes, enriching the upper atmosphere with hydrogen (Bourrier et al., 2018). Thus, the non-detection of water is in agreement with the non-detection of hydrogen (Ehrenreich et al., 2012), favoring a scenario with a dry atmosphere (Bourrier et al., 2018). Further molecular features were investigated by Deibert et al. (2021). The authors searched for absorption features from CO, CO2, H2O, HCN, NH3 and C2H2. This study did not detect these features, but they were able to put upper volume mixing ratio limits on the last three of them.
Overall, the aforementioned studies remark that the results demonstrated are still consistent with a heavyweight atmosphere scenario as well as a rocky surface scenario, further to the possible presence of clouds which might mask absorption signature. This is a valid assumption for 55 Cnc e where the formation of mineral clouds is possible (Mahapatra et al., 2017). Nevertheless, to date, no significant absorption signature for this planet, using high-resolution transit observations, has been reported.
In this study, we make use of one high-resolution transit observation of 55 Cnc e using a larger telescope than in previous studies to search for absorption by various atmospheric silicate species. This paper is structured as follows: In Section 2 the observation and data reduction process is described. Section 3 explains the methodology of this paper. The results are presented in Section 4 and discussed and concluded in Section 5.
| Species | O | Si | Al | Fe* | Ca* | Na | Mg | K | Ti* | H | P | Mn* | F | Ba* | Sr | S | C | Zr* | Cl | V | Cr |
|---|---|---|---|---|---|---|---|---|---|---|---|---|---|---|---|---|---|---|---|---|---|
| mixing ratio [] | 46.10 | 28.20 | 8.23 | 5.60 | 4.15 | 2.36 | 2.33 | 2.09 | 0.57 | 0.14 | 0.11 | 0.10 | 0.06 | 0.04 | 0.04 | 0.04 | 0.02 | 0.02 | 0.01 | 0.01 | 0.01 |
|
Investigated |
x | x | ✓ | ✓ | ✓ | ✓ | ✓ | ✓ | ✓ | x | x | ✓ | x | ✓ | ✓ | ✓ | x | ✓ | x | ✓ | ✓ |
2 Observation and Data Reduction
2.1 The PEPSI Exoplanet Transit Survey
This observation is part of the PEPSI Exoplanet Transit Survey (PETS). PETS is a high-resolution spectroscopic survey of exoplanet transits, secondary eclipses, and host-star characterization of a large number of targets. Our goal is to characterize their planetary atmospheres in exquisite detail. The strengths and uniqueness of this project are the combination of the high-resolution spectrograph PEPSI (Potsdam Echelle Polarimetric and Spectroscopic Instrument) and throughput and the light-collecting power of the Large- Binocular- Telescope (LBT) in binocular mode with its 2 8.4m mirrors.
2.2 Observation
One transit of 55 Cnc e was observed on 2021 January 13 from 07:56 to 11:13 UT at the LBT operated in binocular mode with the fiber-fed spectrograph PEPSI (Strassmeier et al., 2015; Strassmeier et al., 2018b). The spectrograph is located in a pressure-controlled chamber at a constant temperature and humidity to ensure that the refractive index of the air inside stays constant over a long-term period, providing a radial velocity stability of around 5 m/s (Strassmeier et al., 2018a).
PEPSI has a blue and a red arm with three cross-dispersers (CD) in each arm: only one CD per arm can be used at a time. The resolving power obtained from the ThAr frames is R 130 000 in the CD selected in the blue arm (CD3: 4800-5441Å) and R 115 000 in the idem in the red arm (CD6: 7419–9067Å). The ThAr wavelength solution is determined from about 3000 ThAr lines with an error of the fit at the image center of 4 m/s. A CCD binning factor of two was used in wavelength direction. The light from the target and the sky from the two telescopes is rendered through four image slicers via respective octagonal fibers into the spectrograph, in which the echelle image is formed on two k STA1600LN CCDs with m pixel size and 16 amplifiers.
We obtained 83 spectra from CD3 and CD6, with 41 spectra acquired during transit and 42 spectra acquired out-of-transit. Due to the high velocity orbital semi-amplitude of KP 228 km/s of 55 Cnc e, a short exposure time of 90 seconds was used to prevent the smearing of possible atmospheric absorption signatures. The continuum signal-to-noise ratio (S/N) per pixel is 500 in CD3 and 700 in CD6.
2.3 Data Reduction
The data reduction was performed on a generic software platform written in C++, on Linux, and it is called the Spectroscopic Data Systems (SDS), which can work with different échelle spectrographs with the same tools. The image processing pipeline is specifically designed to handle PEPSI data calibration flow and image specific content (SDS4PEPSI based on Ilyin (2000)). It provides an automated process from the beginning to the end product without human interaction and it relies on robust statistics. Further information for its application to PEPSI is provided in (Strassmeier et al., 2018a).
The specific steps of the image processing include bias subtraction and variance estimation of the source images, super-master flat-field correction for the CCD spatial noise, echelle orders definition from the tracing flats, scattered light subtraction, wavelength solution for the ThAr images, optimal extraction of image slicers and cosmic spikes elimination of the target image, wavelength calibration and merging slices in each order, normalization to the master flat field spectrum to remove CCD fringes and blaze function, a global 2D fit to the continuum of the normalized image, and rectification of all spectral orders in the image to a 1D spectrum.
The continuum of the final spectra in the time series is rectified with the use of the mean spectrum that is calculated from weighted average of all the spectra. The mean spectrum is normalized to the continuum to eliminate any residual effects in the continuum. The ratio of each spectrum and the mean is then used to fit a smoothing spline which constitutes the improved continuum for the individual spectrum. The final spectra are then shifted to the stellar rest frame with the Earth-Sun and stellar radial velocities removed from the laboratory wavelength scale, and put on a uniform wavelength grid with 0.01Å separation considering error propagation.
3 Methods
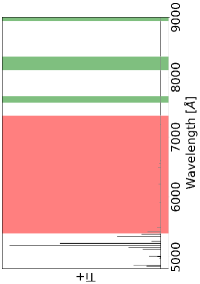
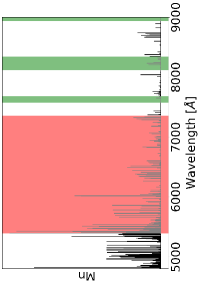
In this work, we search for the presence of atomic species in the high spectral resolution transmission spectrum of the super-Earth 55 Cnc e. Due to the presence of strong telluric contamination of mostly saturated oxygen and water lines within the observed wavelength range, we exclude the wavelength ranges 7580Å - 7680Å, 8120Å - 8350Å and 8940Å - 9007Å from the analysis. We employ the pixel-by-pixel approach (see Section 3.2) using a second-order polynomial function to create the combined transmission spectrum of 55 Cnc e. Here, we fit the normalized and wavelength calibrated flux value at a certain wavelength position over time and divide the data by the fit. We do this for all flux values at each wavelength position. Within the combined transmission spectrum we derive this way, we investigate the absorption by various neutral atomic and ionized species on 55 Cnc e, assumed to originate from a silicate-vapor atmosphere. In order to be able to make a preselection of the species that might build up the silicate atmosphere, we assume that the crust of 55 Cnc e contains similar species as the Earth’s crust (Lide, 2008). Table 1 shows the species with mixing ratios larger than 0.01% in the Earth’s crust composition. We inspect the transmission spectrum around the Mg i-lines at 5167.3Å, 5172.7Å and 5183.6Å, the K i- line at 7699.0Å , the H-line at 4861.3Å and the Ca ii- lines at 8498.0Å, 8542.0Å and 8662.1Å. Furthermore, we calculate synthetic template spectra (see Section 3.1) and compare these with the combined transmission spectrum via the cross-correlation method where a large number of absorption lines are co-added (Snellen et al., 2010; Brogi et al., 2016; Hoeijmakers et al., 2018). We do this within a velocity range of 200 km/s in steps of 1 km/s and use the PyAstronomy111https://github.com/sczesla/PyAstronomy tool pyasl.crosscorrRV, expecting an upward peak at 0 km/s velocity for absorption. To calculate the significance of the detection, we divide the cross-correlation signal by the standard deviation of it excluding 20 km/s around the 0 km/s region (Hoeijmakers et al., 2018). Finally, we determine the upper limit of the atmospheric extension Rext for each species (see Section 3.3). Note, that we do not correct for the effects of centre-to-limb variation (see e.g. Yan et al. 2017) and the Rossiter–McLaughlin effect (see e.g. Borsa et al. 2021) which are insignificant for this observation. The following provides further information regarding the data analysis.
3.1 Synthetic species template absorption spectra
Using the cross-correlation technique we aim to ascertain the potential presence of different atoms and ions in the observed high-resolution spectrum of 55 Cnc e. To perform cross-correlation calculations, we create a set of spectral templates as described in e.g. Hoeijmakers et al. (2018) or Hoeijmakers et al. (2020). Where available, we use the VALD line list data (Ryabchikova et al., 2015; Pakhomov et al., 2019) to compute the opacities of the atoms and ions. For the remaining cases, we employ the Kurucz line list database (Kurucz, 2017). The opacity calculations are done with the HELIOS-k code, described in Grimm et al. (2021).
We adopt the mass and radius values for 55 Cnc e from Bourrier et al. (2018) and use a surface pressure of 1.4 bar following the study of Angelo & Hu (2017). We use element abundances that correspond to the composition of the Earth’s mantle (see Table 1), assuming the potential atmosphere originates from evaporated mantle material. Due to the lack of constraints regarding the atmospheric structure of 55 Cnc e’s terminator region, we assume the atmosphere to be isothermal during the calculations of the transmission spectra for simplicity and set the atmospheric temperature to T = 2500 K, which is close to the equilibrium temperature Teq 2350 K (inferred from the TEPCat222https://www.astro.keele.ac.uk/jkt/tepcat/ database (Southworth, 2011)). Due to the absence of absorption lines in the investigated wavelength range, some atomic species have been excluded from the analysis. For the species Fe, Ca, Ti, Mn, Ba and Zr, also the singly ionized forms are investigated. Table 1 gives an overview of the selected species. As non-thermal processes (such as sputtering) could play a significant role to heat-up the near surface environment above the equilibrium temperature, we repeat the analysis accounting for hotter atmospheric temperature with T = 5000 K for the selected species. The abundances of the chemical species are determined by the chemical equilibrium code FastChem 2.0333https://github.com/exoclime/FastChem (Stock et al., 2018) for different values of the temperature and assumed element abundances.
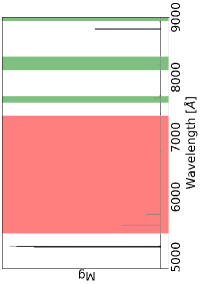
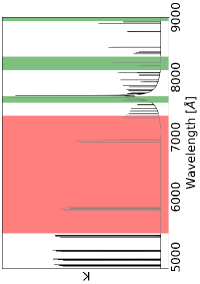
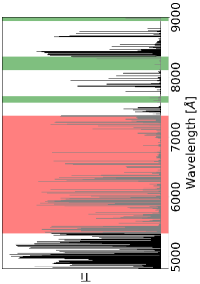
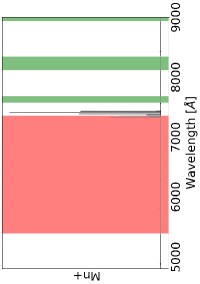
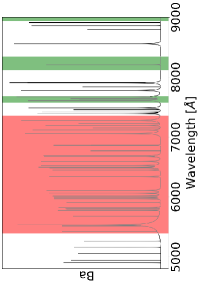
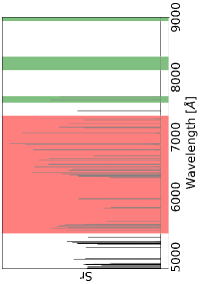
All template spectra are initially calculated with a constant step size in wavenumber space of 0.01 cm-1 and converted via 1-RP2/RS2. Finally, the template spectra are continuum corrected, convolved to the resolution of the PEPSI instrument and put on a uniform wavelength grid with 0.01Å at the planetary rest-frame. The template spectra are shown in the Figures 6 - 9.
3.2 Searching for atmospheric absorption feature
We aim to probe the planetary atmosphere of 55 Cnc e for possible absorption signatures, which will manifest themselves on top of the stellar spectra observed within the in-transit phases. Due to the planetary motion, the wavelength position of possible absorption signature becomes Doppler-shifted at different orbital phases , depending on the line-of-sight velocity of the atmosphere via RV = KP . To extract the planetary absorption, it is necessary to eliminate the stellar lines from the observations by creating the transmission spectrum for each single exposed spectrum. Finally, the combined transmission spectrum can be created by shifting the in-transit phase transmission spectra to the planetary rest-frame and then by co-adding these. This procedure allows the detection of exoplanet atmospheres and is successfully demonstrated in different investigations where atmospheric absorption from atoms and molecules has been inferred especially for giant planets (see e.g. Snellen et al. 2008; Casasayas-Barris et al. 2019; Hoeijmakers et al. 2018; Keles et al. 2020; Cauley et al. 2021).
Different possibilities exist to derive the transmission spectrum. One approach is to divide the spectra from the in-transit phases by the mean out-of-transit spectrum. This approach showed great success and was used in several investigations (Wyttenbach et al., 2015; Yan & Henning, 2018; Casasayas-Barris et al., 2019). However, using this approach, one has to take care about possible telluric line contamination arising from Earth’s atmosphere. As the depth of telluric lines varies overnight, the telluric lines need to be removed from the observations for instance by using telluric absorption correction tools such as Molecfit (Smette et al., 2015), as else they would introduce spurious signature in the transmission spectra, if they arise in the wavelength region of interest. This is demonstrated in Figure 1, which shows in the top panel the spectrum observed at the lowest airmass (yellow) and highest airmass (blue) at a spectral region where telluric water lines are evident. As the entire observation is taken at excellent airmass conditions below 1.2, the telluric lines do not show strong variation. The central panel shows the combined transmission spectrum from the in-transit spectra, where the residuals from the telluric lines are visible.
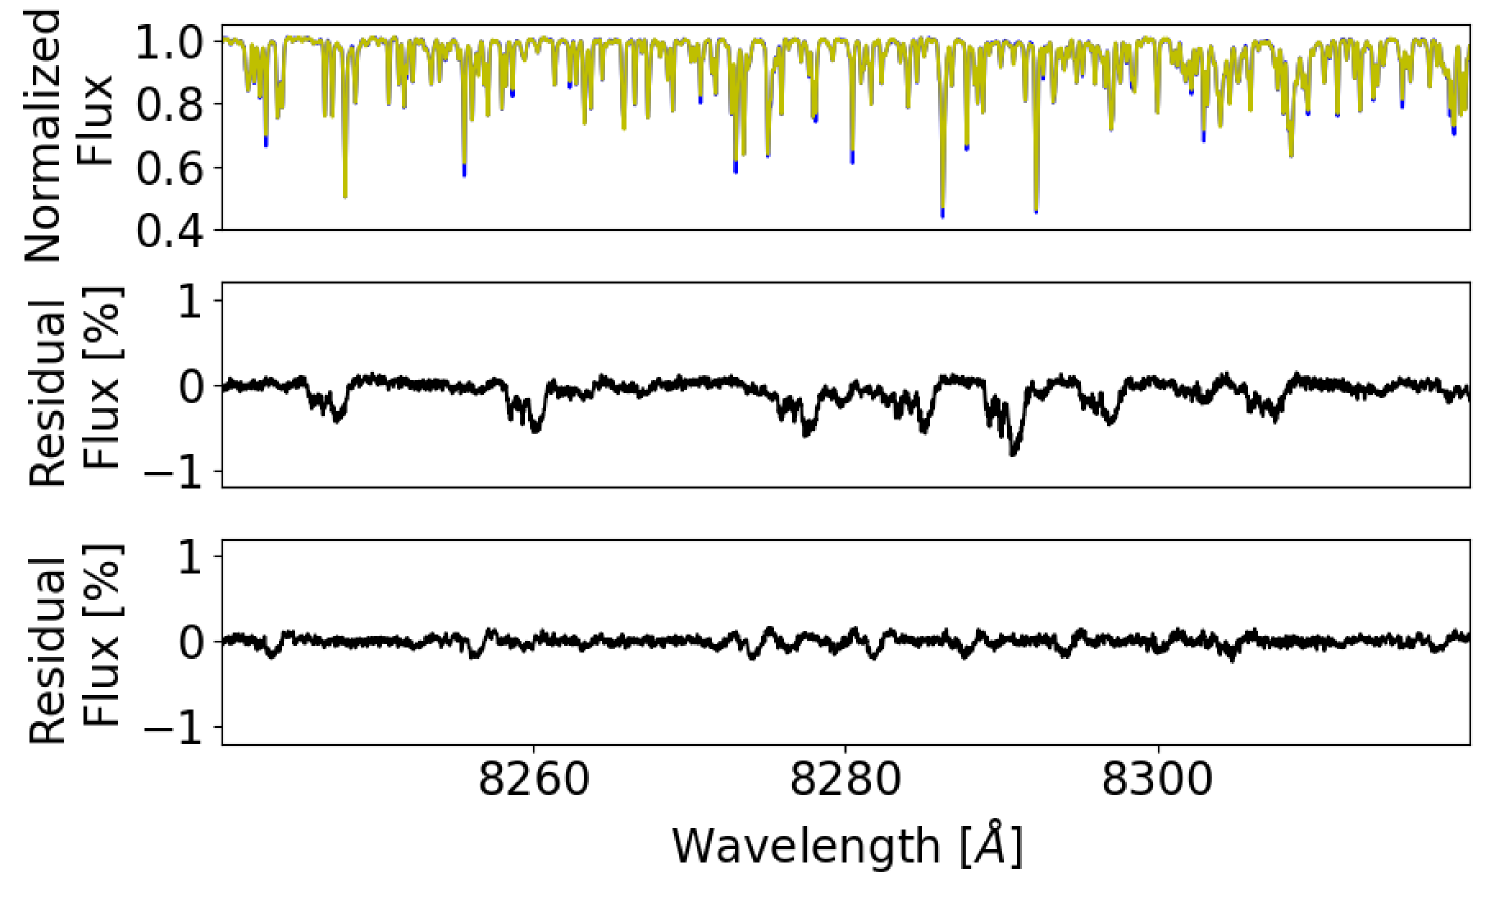
However, there is another approach that enables the derivation of the transmission spectrum, a pixel-by-pixel approach, with the further benefit of removing additionally non-saturated telluric lines, which bases on a similar approach successfully demonstrated in Strassmeier et al. (2020). During the observation, the normalized flux value at a certain pixel after wavelength calibration should not change for the entire observation, except at those pixels where the planetary atmosphere introduces additional absorption during the transit and at the positions where the telluric lines arise. Regarding the latter, in our observation, the observer’s velocity (i.e. the sum of diurnal, orbital, and Solar System Barycenter velocities of the observer) increased in total linearly by around 350 m/s over the full observational period. Therefore, the telluric lines do not move significantly in our observation compared to the pixel size of around 1250 m/s. Applying a second-order polynomial fit to the flux values at each wavelength resolution element over time and dividing the data by this fit removes therefore efficiently the telluric lines and yields the transmission spectrum. As a possible absorption from the planetary atmosphere would affect only a few data points for a large timely resolved dataset, this is mainly ignored by the second-order polynomial fit that considers the variance from each flux value. Therefore, the pixel-by-pixel approach removes only slight variations overnight, not significantly affecting possible absorption arising from the planetary atmosphere within the transmission spectra. We demonstrate this in Section 3.3 by recovering artificially injected absorption signature from the data. Figure 1 shows in the bottom panel the combined transmission spectrum derived using this approach, showing smaller residuals at regions with telluric lines than in the central panel using the formerly mentioned approach. A similar procedure has been applied to create the transmission spectrum as well as to remove telluric line contamination for the planet of interest e.g. by Esteves et al. (2017) and Zhang et al. (2021) using the SYSREM tool (Tamuz et al., 2005; Mazeh et al., 2007) which relies on the method of Principal Component Analysis.
3.3 Deriving the extension limit of the atmosphere
We estimate a limit on the atmospheric altitude from which a possible absorption of a certain species arises. The absorption strength within the template spectra depends on different factors such as the atmospheric composition, which affects the atmospheric mean-molecular weight and thus the atmospheric scale height. As the composition of the atmosphere might be different than assumed in Section 3.1, the different species might be able to reach much higher altitude levels, e.g. due to a increase in the scale height, than calculated within the template spectra. Therefore, the template spectrum of interest is scaled and injected into the data with the aim to recover it. More precisely, after aligning the normalized spectra onto a common wavelength grid in the stellar rest-frame, the spectra from the in-transit phase are multiplied with the template spectrum of interest which we Doppler-shift beforehand with the opposite sign of the line of sight velocity of the planet. The opposite sign velocity is used to avoid smearing with a possible absorption signature (Merritt et al., 2021). Creating now the combined transmission spectrum and applying the cross-correlation, only injections can be recovered that have introduced a significant absorption into the data. This is due to the circumstance, that the pixel-by-pixel approach makes use of a polynomial fit to derive each of the transmission spectra at the different in-transit phases. The polynomial fit again depends on the data quality. Thus, if the injected absorption is too weak, i.e. the absorption within the planetary atmosphere arises at low altitudes, this will not affect significantly the corresponding pixels where the absorption is introduced and later fitted by the polynomial, thus will not be recovered.
We scale the synthetic template spectra, so that the strongest absorption line in the investigated wavelength region reaches different levels which we denote as the atmospheric extension limits Rext and repeat the analysis, i.e. we inject this template again into the observations and repeat the cross-correlation analysis. For larger Rext values, the recovery will show larger detection signals. We determine the atmospheric extension limit Rext in units of the planetary radius, at which the cross-correlation analysis would yield a 3- detection for the species of interest. Note, that the investigated wavelength region has only two chunks within the optical wavelength range and that we scale the template only according to the strongest absorption line in the accessible (i.e. not excluded) wavelength range of the observations. The template spectra are shown in Section The PEPSI Exoplanet Transit Survey (PETS) I: Investigating the presence of a silicate atmosphere on the super-Earth 55 Cnc e, where one can see that most of the species investigated have the strongest absorption line within the accessible wavelength range, and that the differences for the other templates are small.
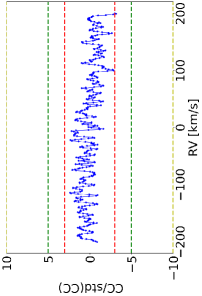
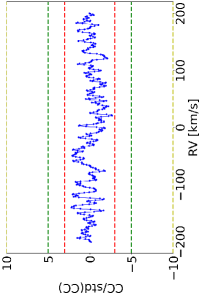
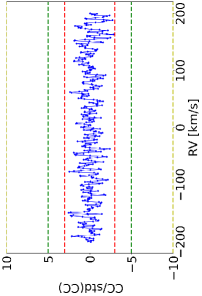
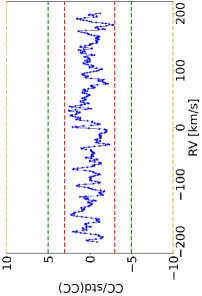
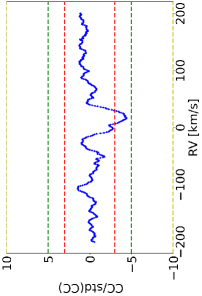
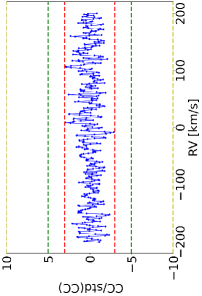
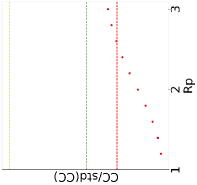
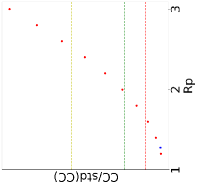
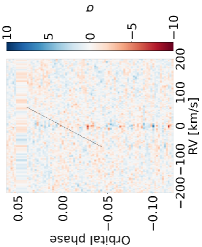
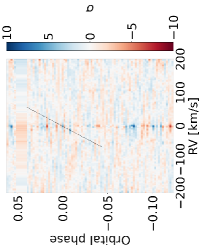
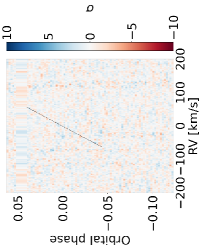
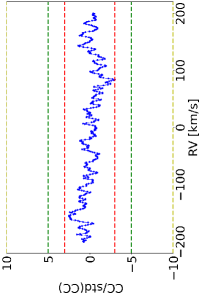
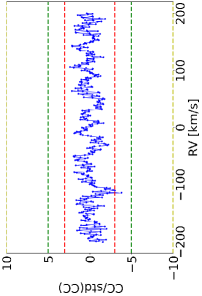
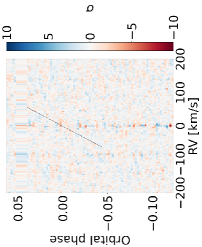
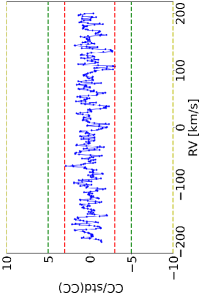
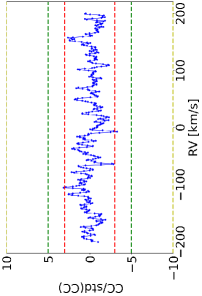
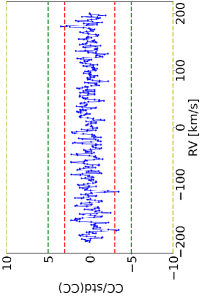
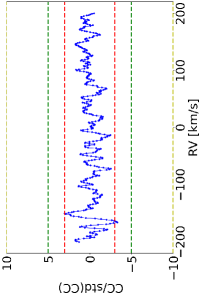
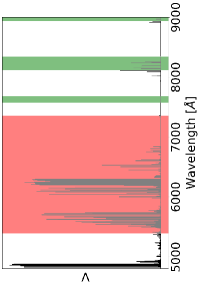
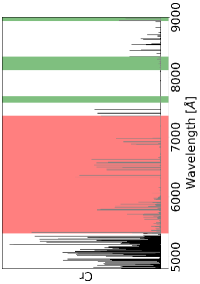
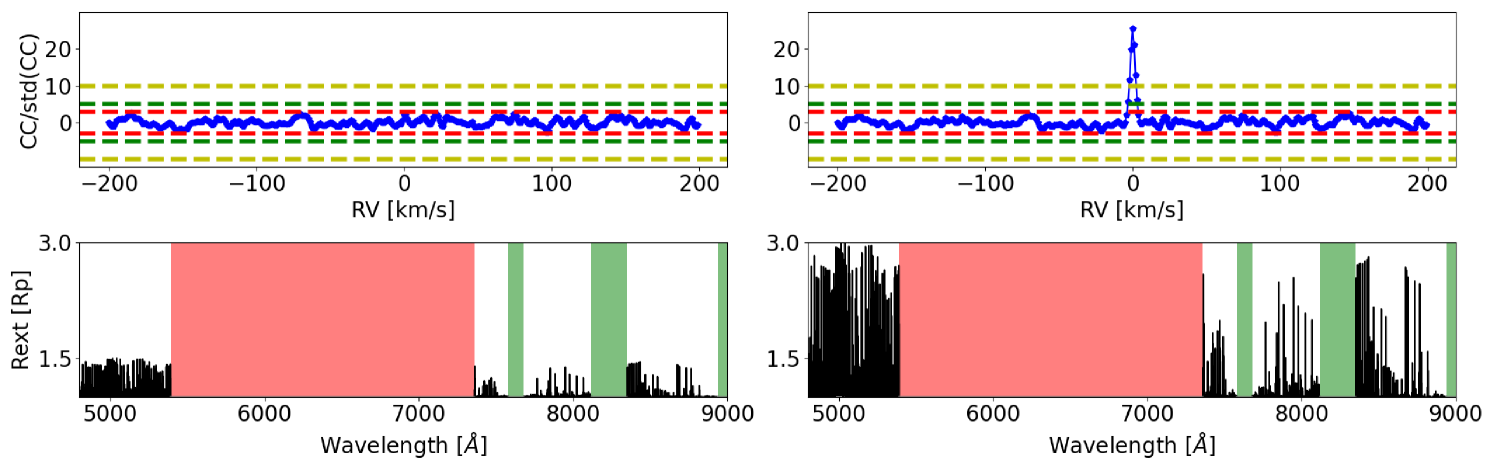
Figure 2 shows the injection approach, on the left side for Rext = 1.5 RP and on the right side for Rext = 3.0 RP. The top panels show the cross-correlation signal divided by its standard deviation and the bottom panel shows the scaled Ti template spectra. The injection recovery yields a detection > 10 for Rext = 3.0 RP and no detection for Rext = 1.5 RP. This verification demonstrates that the applied method is suitable to derive possible absorption arising from the planetary atmosphere.
4 Results
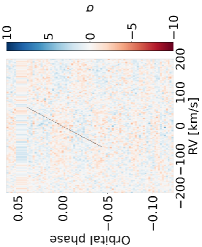
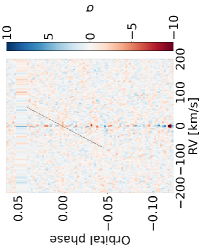
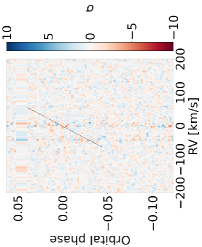
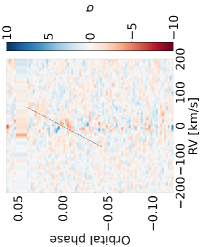
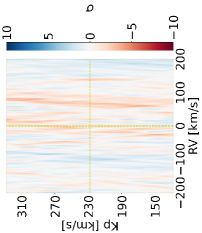
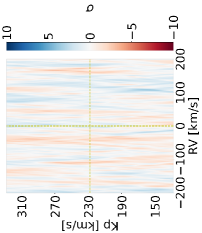
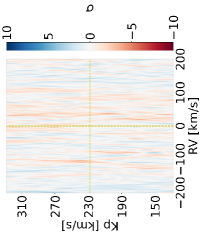
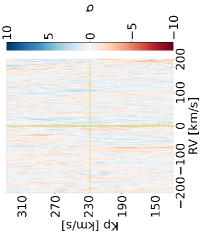
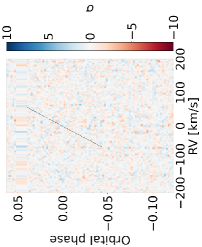
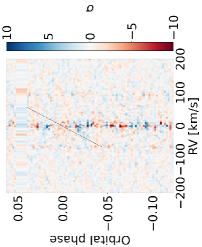
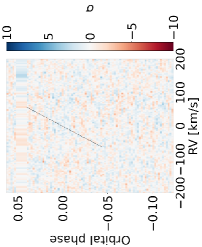
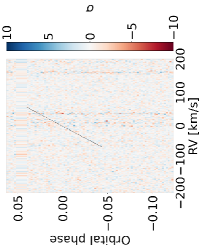
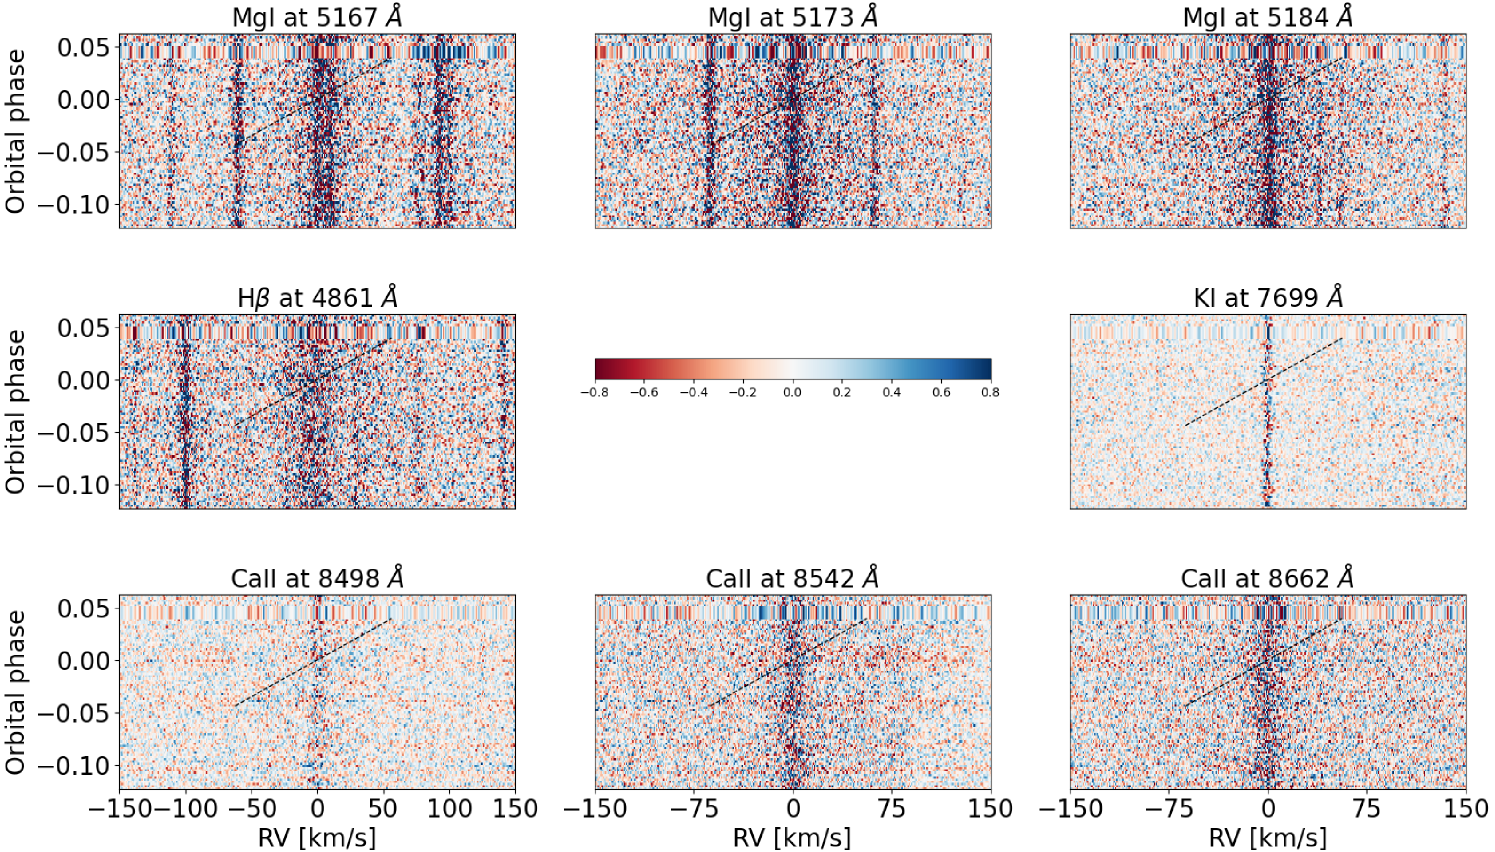
Figure 3 shows the combined transmission spectrum around strong opacity bearing species. Here, the standard deviation at 1Å around the line core is 6.05 10-4 at the H-line, 2.78 10-4 at the K i-line, 6.49 10-4 at the Mg i-lines and 5.09 10-4 at the Ca ii-lines (see Table 2). Figure 4 shows the color-coded 2D map of the residual spectra at different orbital phases for these species. None reveals evidence of absorption.
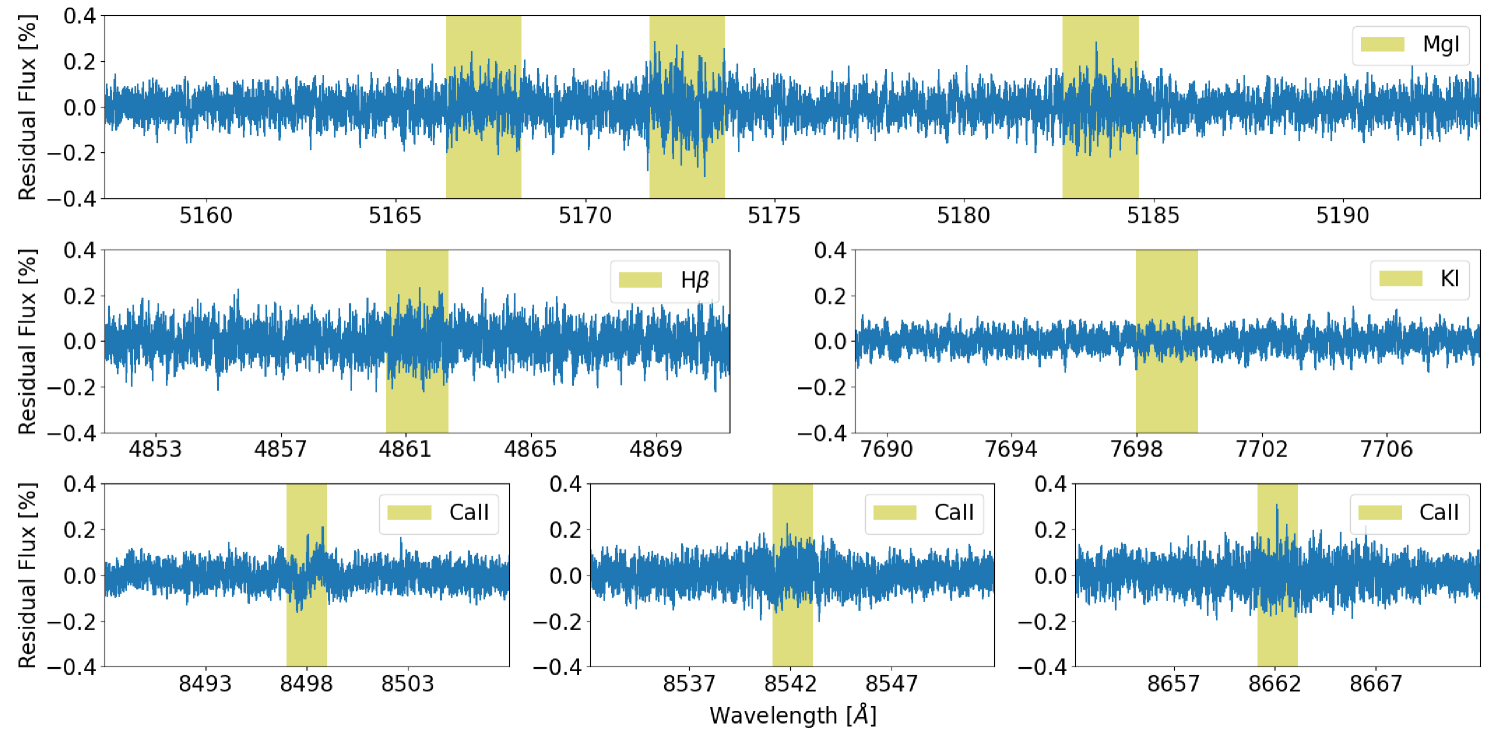
| Line | Standard deviation |
|---|---|
| H-line | 6.05 10-4 |
| K i-line | 2.78 10-4 |
| Mg i-lines | 6.49 10-4 |
| Ca ii-lines | 5.09 10-4 |
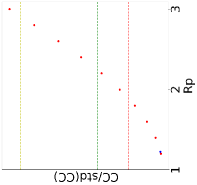
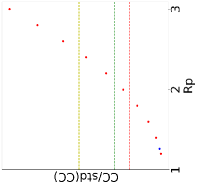
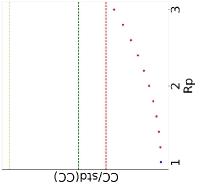
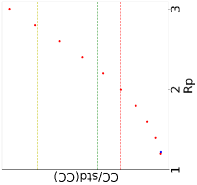
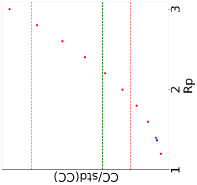
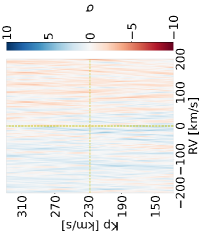
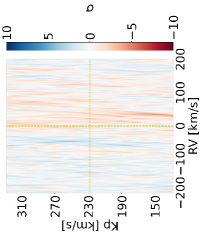
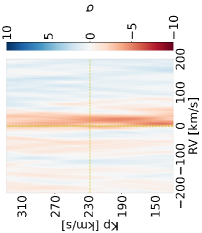
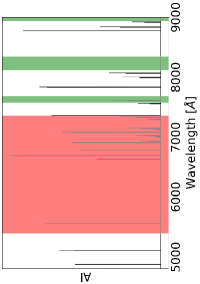
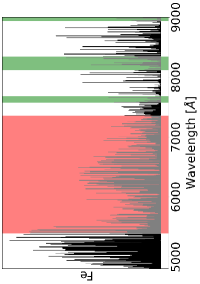
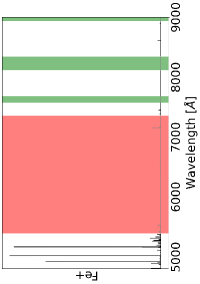
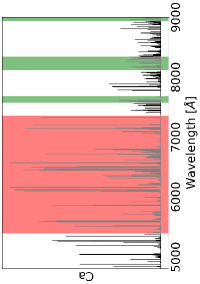
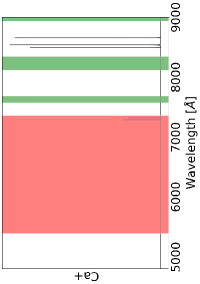
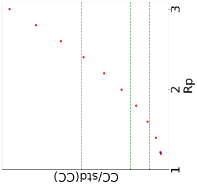
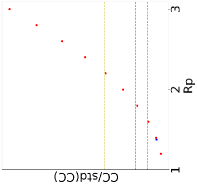
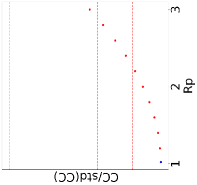
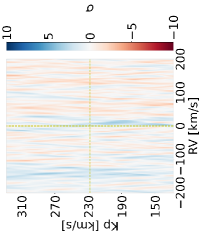
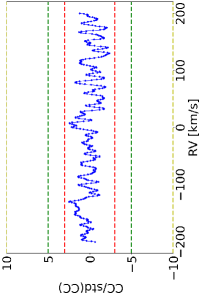
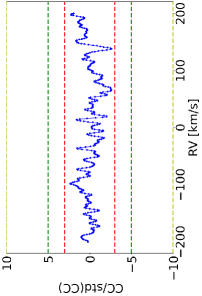
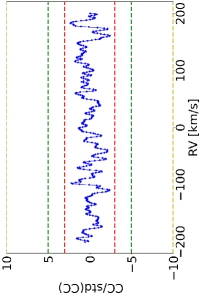
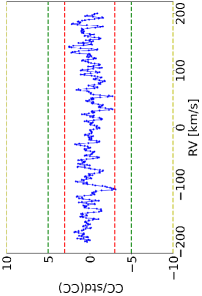
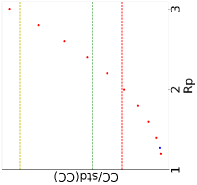
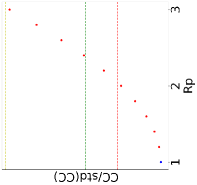
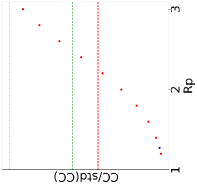
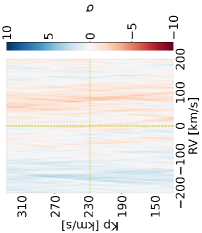
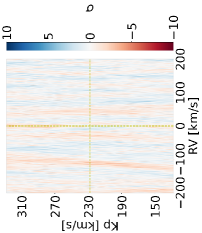
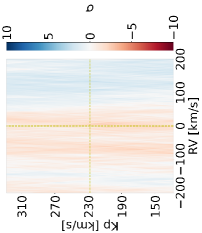
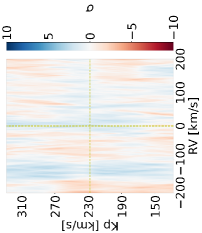
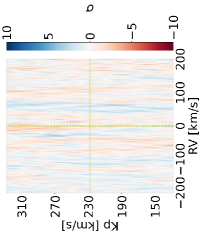
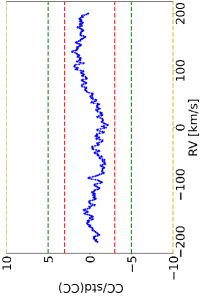
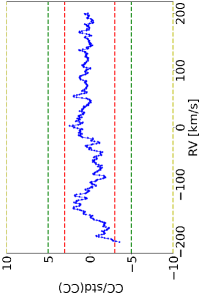
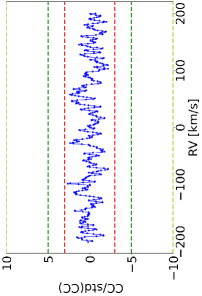
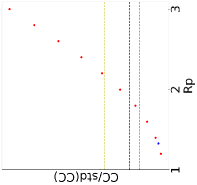
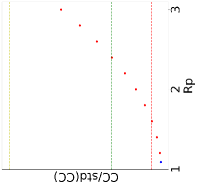
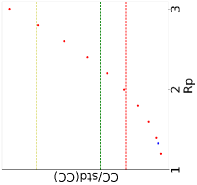
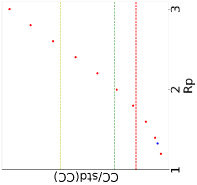
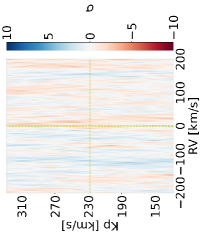
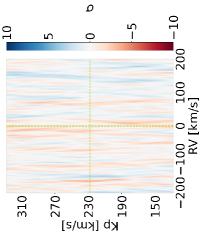
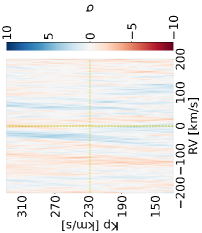
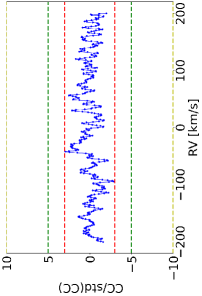
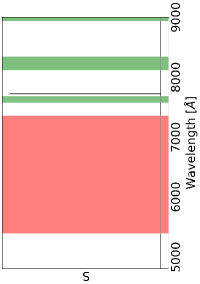
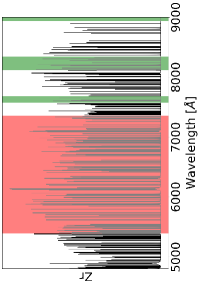
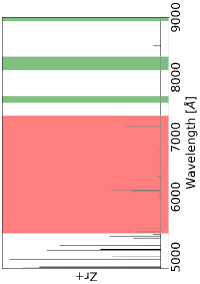
Figures 6- 9 show the cross-correlation approach searching for different atmospheric species for the scenario with the atmospheric temperature of T = 2500 K. From left to right in landscape format, the first panels show the template spectrum, the second panels the cross-correlation signal, the third panels the colour coded cross-correlation signal for the transmission spectra at different orbital phases in the velocity range and the fourth panel the colour coded KP - RV maps. The KP - RV maps are calculated 100 km/s around the expected velocity-semi amplitude of the planet and are used to verify that a possible absorption signal arises only at the expected KP value and is thus of planetary origin. The inspection of the cross-correlation signals shows no evidence of absorption for any of the investigated species. The scatter remains mainly below 3 standard deviations. Also, no evidence of significant absorption is visible in the third panels or visible at different KP positions in the fourth panels.
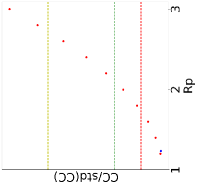
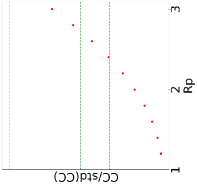
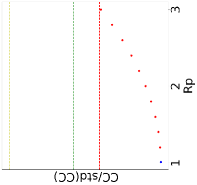
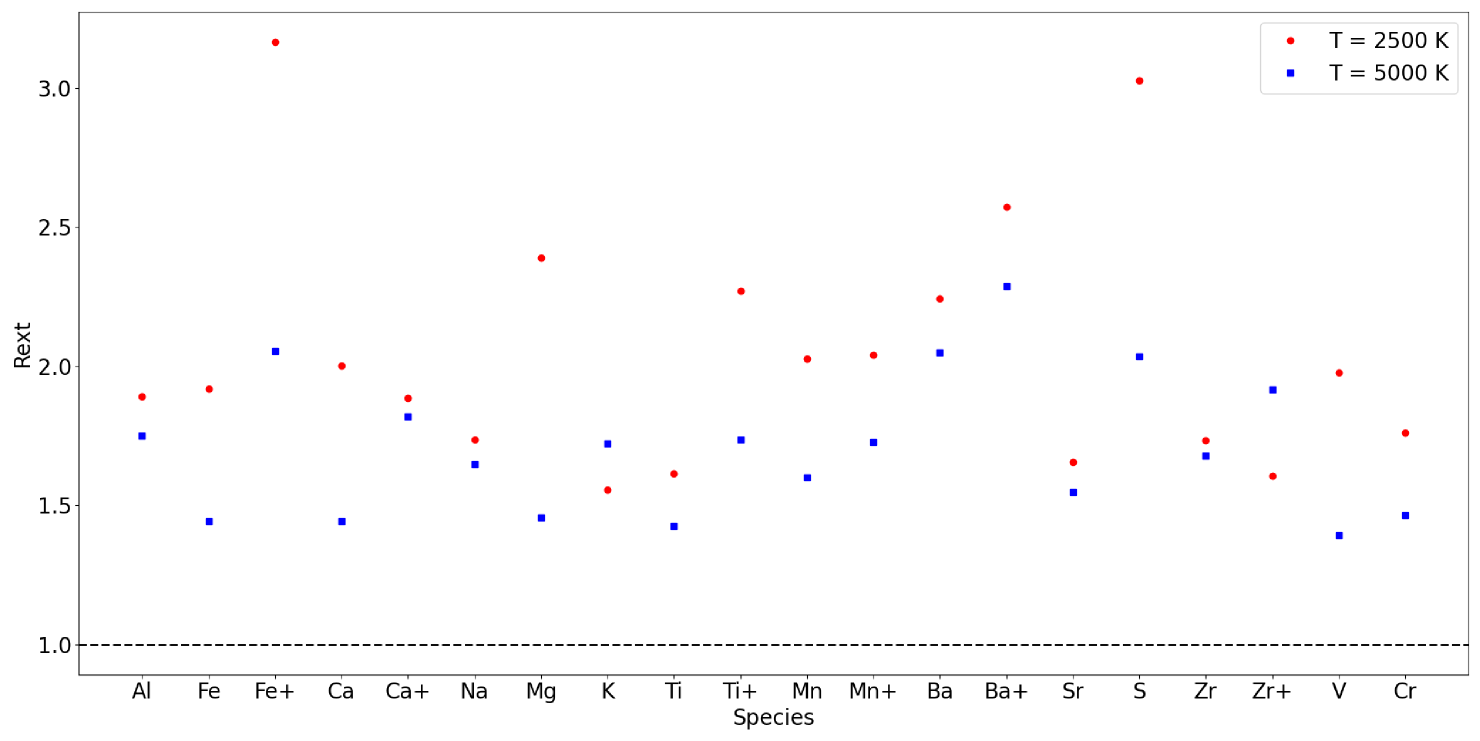
The fifth panel shows the detection thresholds for different Rext values applied for the injection recovery up to 3 RP, with the blue dot showing the significance for the injection of the unscaled template calculated according to the planetary properties as described in Section 3.1. Due to the high-mean molecular weight of the atmosphere, the extension of the atmosphere is mainly below 1.4 RP in the unscaled templates for all species investigated, not detectable at a 3 confidence level within the observation available. We are able to put an upper limit of the atmospheric extension for the investigated species by injecting scaled templates into the data and recovering them. Figure 5 shows the atmospheric extension Rext limits which we would able to probe for the investigated species for the T = 2500 K scenario (red dots) and the T = 5000 K scenario (blue squares) at the 3 confidence level. The dashed line marks the planetary surface at 1 RP. The upper limit of the atmospheric extension shows a decrease for most species going from T = 2500 K scenario to the T = 5000 K scenario, mainly due to the variation in the number of absorption lines, but depends also on the quality of the combined transmission spectrum at the regions compared to the synthetic templates. Table 3 shows the derived limits for the investigated species at a 3 confidence level, with a median value of Rext = 1.9 RP for the T = 2500 K scenario and Rext = 1.7 RP for the T = 5000 K scenario, ruling out absorption from an atmospheric envelope which is widely extended for most of the species.
| Species | Al | Fe | Fe+ | Ca | Ca+ | Na | Mg | K | Ti | Ti+ | Mn | Mn+ | Ba | Ba+ | Sr | S | Zr | Zr+ | V | Cr |
|---|---|---|---|---|---|---|---|---|---|---|---|---|---|---|---|---|---|---|---|---|
| T = 2500K | 1.88 | 1.91 | 3.16 | 2.00 | 1.88 | 1.73 | 2.39 | 1.55 | 1.61 | 2.27 | 2.02 | 2.04 | 2.24 | 2.57 | 1.65 | 3.02 | 1.73 | 1.60 | 1.97 | 1.75 |
|
T = 5000K |
1.75 | 1.44 | 2.05 | 1.44 | 1.81 | 1.64 | 1.45 | 1.72 | 1.42 | 1.73 | 1.60 | 1.72 | 2.04 | 2.28 | 1.54 | 2.03 | 1.67 | 1.91 | 1.39 | 1.46 |
5 Discussion and Conclusion
The search for absorption by silicate species in the transmission spectrum of 55 Cnc e, for instance released by a magma ocean, did not show an absorption for any of the investigated species. To account for different conditions in the upper atmosphere of 55 Cnc e, we repeated the cross-correlation analysis with template spectra calculated for T = 5000 K i.e. 2 Teq, yielding the same non-detection of any absorption signature in all cases.
Our non-detection of H agrees with previous investigations not finding evidence of hydrogen absorption for this planet (Ehrenreich et al., 2012; Tabernero et al., 2020). Other absorption signatures from species with strong opacities previously resolved on gaseous exoplanets such as Mg i (Cauley et al., 2019), K i (Keles et al., 2019) or Ca ii (Yan et al., 2020) are not detected either for 55 Cnc e.
For short period exoplanets, high escape rates of Na i, Ca ii and Mg ii can be expected to build up large planetary tails on hot rocky exoplanets (Mura et al., 2011). In this study, we derived limits for the atmospheric extension related to the absorption of major species (see Table 3), including the major abundant species in the Earth’s crust such as Al, Fe, Ca, Na, Mg and K (see Table 1), which are far below the Roche lobe radius of RRoche = 5.35 R (Ridden-Harper et al., 2016), i.e. RRoche 2.85 RP, showing that this might be not the case for 55 Cnc e.
We compare our results to the findings by Ridden-Harper et al. (2016) who showed a possible 3- sodium signature at the Na d lines and a variable 4.1- Ca+ signature at the Ca h&k lines on 55 Cnc e. As Ridden-Harper et al. (2016) uses a larger planetary radius which bases on Gillon et al. (2012), we compare the inferred probed altitudes in terms of R. The Na d signal from Ridden-Harper et al. (2016) corresponds to RP = 5 R. To be able to compare our findings,we scale the Na- template so that the Na d lines in the templates reach this altitude and repeat the analysis. Note, that we have no access to the resonance lines in our observations, but the scaling affects all lines within the wavelength range accessible. For Na d lines reaching 5 R in the template, the injection recovery would yield a 5.8- detection. Therefore, we can rule out the presence of sodium at such extended altitudes. In our work, the inferred 3- limit for the Na investigation shows an upper limit of Rext = 1.73 RP, which would correspond to Na d lines reaching Rext = 1.99 RP and thus RP = 3.75 R compared to the RP = 5 R presented by Ridden-Harper et al. (2016). We apply the same comparison for the Ca+ lines. The Ca h&k lines reach around RP = 25 R in Ridden-Harper et al. (2016), corresponding to Rext 13.30 RP. We scale the ionized calcium- template so that the Ca h&k lines in the templates reach this altitude and repeat the analysis. Note, that we have also no access to these resonance lines in our observations. For such an atmospheric extension, we would yield a > 64- detection, which is not the case. A 4.1- detection of ionized calcium would correspond to an upper limit of around Rext = 2.1 RP in this work, which would correspond to Ca h&k lines reaching Rext = 2.39 RP and thus RP = 4.5 R, compared to the RP = 25 R presented by Ridden-Harper et al. (2016). Thus, within the direct comparison to Ridden-Harper et al. (2016) regarding the Na- and Ca+- absorption, we can only put a slightly lower absorption limit regarding the presence of sodium, but more than five times lower limit regarding the presence of the ionized calcium in the exosphere of 55 Cnc e, probably due to the larger S/N values achieved by the observation and the cross-correlation analysis, although Ridden-Harper et al. (2016) have access to stronger resonance absorption lines.
Note, that Ridden-Harper et al. (2016) did not claim detection and reported the variability of the Ca h&k absorption, which might be due to stellar activity. Probably also induced by stellar variability, a broad downward showing feature is visible in the cross-correlation analysis for the ionized Ca ii lines (see Figure 6) at a significance of 4 . As the template spectrum and the transmission spectrum have the same alignment for the cross-correlation analysis, a downward peaking feature suggests emission rather than absorption. Inspecting the Ca ii- infrared triplet lines that have the major contribution within the cross-correlation analysis, in the combined transmission spectrum (Figure 3), only the Ca ii line around 8498Å shows a hint for an emission. We repeat the cross-correlation analysis for the ionized Ca ii excluding this line, which results in the decrease of the significance of the feature down to 3 . Therefore, this strengthens the possibility that the emission feature does not arise from the planet or from an ionized calcium-rich envelope, but is rather due to variability in the stellar calcium lines, also strengthened by the fact that the emission is not following the atmospheric trace (see the third panel in Figure 6).
The atmospheric conditions on 55 Cnc e are still puzzling: is there a detectable atmosphere on this planet? Possible scenarios include a purely rocky surface, a rocky surface with a magma ocean on top releasing species and building up a thin silicate-vapor envelope, or a atmosphere e.g. with a water envelope or a N2 or CO2 rich atmosphere (Angelo & Hu, 2017) with a surface pressure similar to Earth. The non-detection of water (Esteves et al., 2017; Jindal et al., 2020) with the non-detection of light elements (Ehrenreich et al., 2020; Zhang et al., 2021) seems to make the water envelope scenario unlikely. A detectable thin silicate-vapor atmosphere scenario can not be strengthened either by Tabernero et al. (2020) who did not find evidence for Na i absorption or by this work not finding evidence of absorption for a variety of species. Overall, our work provide indications that favor the heavyweight atmospheric scenario. This would be in agreement with the shift detection of the hot spot east of the substellar point on 55 Cnc e detected by Demory et al. (2016). Such a shift is usually driven by atmospheric circulation processes, including a significant amount of atmospheric mass (Showman & Polvani, 2011; Miller-Ricci Kempton & Rauscher, 2012; Keles, 2021). Although we cannot rule out a heavy silicate-atmosphere existing below the presented altitude limits inferred in this work, with a median value of Rext = 1.9 RP, or a deck of mineral clouds (Mahapatra et al., 2017) that hide absorption signatures, this study showed that very high S/N data can deliver informative upper limits on the extension of the possibly existing silicate atmospheres probing deeply the atmospheres of terrestrial exoplanets.
Acknowledgements
This survey is a collaborative effort from AIP, MPIA, INAF, University of Arizona, Ohio State University and the LBT.
EK is thankful for the support and granting the LBT time for this observation by the Rat Deutscher Sternwarten (RDS).
XA is grateful for the financial support from the Potsdam Graduate School (PoGS) in the form of a doctoral scholarship.
KM: This research was supported by the Excellence Cluster ORIGINS which is funded by the Deutsche Forschungsgemeinschaft (DFG, German Research Foundation) under Germany’s Excellence Strategy - EXC-2094 - 390783311.
KP and LK acknowledge support from the Leibniz-Gemeinschaft under project number P67/2018.
Data Availability
The data underlying this article will be shared on reasonable request to the corresponding author.
References
- Angelo & Hu (2017) Angelo I., Hu R., 2017, The Astronomical Journal, 154, 232
- Borsa et al. (2021) Borsa F., et al., 2021, A&A, 645, A24
- Bourrier et al. (2018) Bourrier V., et al., 2018, Astronomy & Astrophysics, 619, A1
- Brogi et al. (2016) Brogi M., Kok R. J. d., Albrecht S., Snellen I. A. G., Birkby J. L., Schwarz H., 2016, ApJ, 817, 106
- Casasayas-Barris et al. (2019) Casasayas-Barris N., et al., 2019, A&A, 628, A9
- Cauley et al. (2019) Cauley P. W., Shkolnik E. L., Ilyin I., Strassmeier K. G., Redfield S., Jensen A., 2019, AJ, 157, 69
- Cauley et al. (2021) Cauley P. W., Wang J., Shkolnik E. L., Ilyin I., Strassmeier K. G., Redfield S., Jensen A. G., 2021, AJ, 161, 152
- Deibert et al. (2021) Deibert E. K., de Mooij E. J. W., Jayawardhana R., Ridden-Harper A., Sivanandam S., Karjalainen R., Karjalainen M., 2021, The Astronomical Journal, 161, 209
- Demory et al. (2011) Demory B.-O., et al., 2011, Astronomy & Astrophysics, 533, A114
- Demory et al. (2016) Demory B.-O., et al., 2016, Nature, 532, 207–209
- Ehrenreich et al. (2012) Ehrenreich D., et al., 2012, Astronomy & Astrophysics, 547, A18
- Ehrenreich et al. (2020) Ehrenreich D., et al., 2020, Nature, 580, 597–601
- Esteves et al. (2017) Esteves L. J., de Mooij E. J. W., Jayawardhana R., Watson C., de Kok R., 2017, AJ, 153, 268
- Gillon et al. (2012) Gillon M., et al., 2012, A&A, 539, A28
- Grenfell (2017) Grenfell J. L., 2017, Physics Reports, 713, 1–17
- Grimm et al. (2021) Grimm S. L., et al., 2021, ApJS, 253, 30
- Hoeijmakers et al. (2018) Hoeijmakers H. J., et al., 2018, Nature, 560, 453
- Hoeijmakers et al. (2020) Hoeijmakers H. J., et al., 2020, A&A, 641, A123
- Ilyin (2000) Ilyin I. V., 2000, PhD thesis, Astronomy Division Department of Physical Sciences P.O.Box 3000 FIN-90014 University of Oulu Finland
- Ito et al. (2015) Ito Y., Ikoma M., Kawahara H., Nagahara H., Kawashima Y., Nakamoto T., 2015, The Astrophysical Journal, 801, 144
- Jindal et al. (2020) Jindal A., et al., 2020, The Astronomical Journal, 160, 101
- Keles (2021) Keles E., 2021, MNRAS,
- Keles et al. (2018) Keles E., Grenfell J. L., Godolt M., Stracke B., Rauer H., 2018, Astrobiology, 18, 116
- Keles et al. (2019) Keles E., et al., 2019, MNRAS: Letters, 489, L37
- Keles et al. (2020) Keles E., et al., 2020, Monthly Notices of the Royal Astronomical Society, 498, 1023–1033
- Kite & Barnett (2020) Kite E. S., Barnett M. N., 2020, Proceedings of the National Academy of Science, 117, 18264
- Kite et al. (2019) Kite E. S., Jr. B. F., Schaefer L., Ford E. B., 2019, The Astrophysical Journal, 887, L33
- Kurucz (2017) Kurucz R. L., 2017, Canadian Journal of Physics, 95, 825
- Lide (2008) Lide D. R., 2008, CRC Handbook of chemistry and physics: a ready-reference book of chemical and physical data
- Madhusudhan (2012) Madhusudhan N., 2012, The Astrophysical Journal, 758, 36
- Mahapatra et al. (2017) Mahapatra G., Helling C., Miguel Y., 2017, Monthly Notices of the Royal Astronomical Society, 472, 447–464
- Mazeh et al. (2007) Mazeh T., Tamuz O., Zucker S., 2007, in Afonso C., Weldrake D., Henning T., eds, Astronomical Society of the Pacific Conference Series Vol. 366, Transiting Extrapolar Planets Workshop. p. 119 (arXiv:astro-ph/0612418)
- Merritt et al. (2021) Merritt S. R., et al., 2021, MNRAS, 506, 3853
- Miguel et al. (2011) Miguel Y., Kaltenegger L., Fegley B., Schaefer L., 2011, ApJ, 742, L19
- Miller-Ricci Kempton & Rauscher (2012) Miller-Ricci Kempton E., Rauscher E., 2012, The Astrophysical Journal, 751, 117
- Mura et al. (2011) Mura A., et al., 2011, Icarus, 211, 1
- Pakhomov et al. (2019) Pakhomov Y. V., Ryabchikova T. A., Piskunov N. E., 2019, Astronomy Reports, 63, 1010
- Ridden-Harper et al. (2016) Ridden-Harper A. R., et al., 2016, A&A, 593, A129
- Ryabchikova et al. (2015) Ryabchikova T., Piskunov N., Kurucz R. L., Stempels H. C., Heiter U., Pakhomov Y., Barklem P. S., 2015, Phys. Scr., 90, 054005
- Schaefer & Fegley (2009) Schaefer L., Fegley B., 2009, ApJ, 703, L113
- Seager & Sasselov (2000) Seager S., Sasselov D. D., 2000, ApJ, 537, 916
- Showman & Polvani (2011) Showman A. P., Polvani L. M., 2011, The Astrophysical Journal, 738, 71
- Smette et al. (2015) Smette A., et al., 2015, Astronomy & Astrophysics, 576, A77
- Snellen et al. (2008) Snellen I. A. G., Albrecht S., de Mooij E. J. W., Le Poole R. S., 2008, A&A, 487, 357
- Snellen et al. (2010) Snellen I. A. G., de Kok R. J., de Mooij E. J. W., Albrecht S., 2010, Nature, 465, 1049
- Southworth (2011) Southworth J., 2011, MNRAS, 417, 2166
- Stock et al. (2018) Stock J. W., Kitzmann D., Patzer A. B. C., Sedlmayr E., 2018, MNRAS, 479, 865
- Strassmeier et al. (2015) Strassmeier K. G., et al., 2015, Astronomische Nachrichten, 336, 324
- Strassmeier et al. (2018a) Strassmeier K. G., Ilyin I., Steffen M., 2018a, A&A, 612, A44
- Strassmeier et al. (2018b) Strassmeier K. G., Ilyin I., Weber M., 2018b, A&A, 612, A45
- Strassmeier et al. (2020) Strassmeier K. G., Ilyin I., Keles E., Mallonn M., Järvinen A., Weber M., Mackebrandt F., Hill J. M., 2020, Astronomy & Astrophysics, 635, A156
- Tabernero et al. (2020) Tabernero H. M., et al., 2020, Monthly Notices of the Royal Astronomical Society, 498, 4222–4229
- Tamuz et al. (2005) Tamuz O., Mazeh T., Zucker S., 2005, MNRAS, 356, 1466
- Vidotto et al. (2018) Vidotto A. A., et al., 2018, Monthly Notices of the Royal Astronomical Society, 481, 5296–5306
- Winn et al. (2011) Winn J. N., et al., 2011, ApJ, 737, L18
- Wunderlich et al. (2021) Wunderlich F., Scheucher M., Grenfell J. L., Schreier F., Sousa-Silva C., Godolt M., Rauer H., 2021, Astronomy & Astrophysics, 647, A48
- Wyttenbach et al. (2015) Wyttenbach A., Ehrenreich D., Lovis C., Udry S., Pepe F., 2015, A&A, 577, A62
- Yan & Henning (2018) Yan F., Henning T., 2018, Nature Astronomy, 2, 714
- Yan et al. (2017) Yan F., Pallé E., Fosbury R. A. E., Petr-Gotzens M. G., Henning T., 2017, A&A, 603, A73
- Yan et al. (2020) Yan F., et al., 2020, Astronomy & Astrophysics, 640, L5
- Zhang et al. (2021) Zhang M., Knutson H. A., Wang L., Dai F., Oklopcic A., Hu R., 2021, The Astronomical Journal, 161, 181
Appendix A