The Physical Nature of the Off-centered Extended Emission Associated with the Little Red Dots
Abstract
A significant fraction of little red dots (LRDs) exhibit nearby extended emission of unknown origin. If physically associated with the LRD, this component may trace stellar emission from an off-centered host galaxy, neighboring companions, or nebular gas illuminated by the active nucleus. We investigate the detailed spectral energy distribution of the extended emission near four LRDs in the JWST UNCOVER and MegaScience surveys. We accurately decompose the extended emission from the dominant point source by simultaneously fitting the images in eight broad-band and nine medium-band filters. After considering both the results from photometric redshift fitting and the probability of galaxies at different redshift overlapping, we confirm that the off-centered blobs in three sources are physically associated with the LRDs, with two of them showing strong [O III] emission captured by the medium-band filters. While the spectral energy distributions of all three blobs can be modeled assuming star-forming galaxies with stellar mass , the exceptionally strong [O III] emission of two sources is best interpreted as pure nebular emission from low-density (), low-metallicity () gas photoionized by the ultraviolet radiation from the nearby LRD. Adopting LRD halo masses constrained by clustering measurements and theoretical considerations, we estimate a typical baryonic halo mass accretion rate of . If the halo accretion rate is sustained to and stars form with an efficiency of 10%, the accreted gas would form a galaxy with stellar mass , potentially rendering them spatially resolved at lower redshift.
1 Introduction
While searching the early Universe for supermassive black holes in their infancy, the James Webb Space Telescope (JWST) came across numerous point-like sources with distinctive colors, a population now popularly dubbed the little red dots (LRDs). These objects are often observed to have a characteristic “V-shape” spectral energy distribution (SED) that is blue in the rest-frame ultraviolet (UV) and red in the optical, as well as extremely compact physical size of or less (Kocevski et al., 2023; Furtak et al., 2024; Kokorev et al., 2024; Matthee et al., 2024; Akins et al., 2025; Kocevski et al., 2025; Labbé et al., 2025a). The red continuum slope of the LRDs flattens toward the near- and mid-infrared (Pérez-González et al., 2024; Williams et al., 2024; Akins et al., 2025; Naidu et al., 2025; Wang et al., 2025) and eventually becomes completely undetected in the far-infrared (Akins et al., 2025; Labbé et al., 2025a; Setton et al., 2025). Apart from establishing their extragalactic nature and high redshifts (), follow-up spectroscopic observations reveal that LRDs possesses strong and emission lines with full width at half maximum (Greene et al., 2024), superficialy similar to those seen in broad-line active galactic nuclei (AGNs). If local estimators of virial mass (e.g., Greene & Ho 2005) can be applied, LRDs have estimated black holes masses radiating at Eddington ratios of .
The physical nature of the LRDs—whether they are early-formed galaxies or AGNs—is a subject of intensive ongoing debate. Under the galaxy scenario, a highly dust-reddened stellar population produces the red optical slope as well as the prominent drop near Å that resembles the Balmer break observed in relatively evolved stellar populations (Furtak et al., 2024; Greene et al., 2024; Wang et al., 2024, 2025). On the other hand, while it is possible to generate broad emission lines in extremely dense stellar systems (Baggen et al., 2024), such systems appear to be dynamically unstable to runaway collisions (Guia et al., 2024). Forming such massive stellar systems at early cosmic epoch would also be in conflict with the standard framework of structure formation (Inayoshi & Ichikawa, 2024). Under the AGN scenario, emission from the accretion disk needs to be attenuated by a combination of dust and high-density () gas in order to simultaneously produce both the red optical slope and Balmer absorption features (Inayoshi & Maiolino, 2025; Ji et al., 2025; Naidu et al., 2025). Although the degree of dust attenuation varies with different models, dust geometry, and possibly grain size distribution (Killi et al., 2024; Li et al., 2025), all current models struggle to explain the deficit of dust emission (Labbé et al., 2025a; Setton et al., 2025).
Besides the already enchanting story for the “dots” themselves, another interesting fact often left undiscussed in the literature is that many LRDs exhibit nearby emission of unknown origin. Chen et al. (2025) discovered extended, off-centered emission near the dominant point source in five out of eight LRDs. A more robust statistic is later reported in Rinaldi et al. (2025), in which 30 out of 99 LRDs display complex UV morphologies, featuring either a highly symmetric structure or at least two distinctive neighboring sources. In a few cases in which detailed parametric morphologies are measured for these extended blobs, they are found to have low central concentration, characterized by a Sérsic profile with (Chen et al., 2025; Labbé et al., 2025b).
The number density of LRDs is significantly higher than UV luminous quasars at similar redshift (Greene et al., 2024; Kokorev et al., 2024; Matthee et al., 2024), which implies that most LRDs will not become quasars but end up as normal Seyferts or composite (AGN plus star-forming) galaxies in the local Universe. As the only resolvable structures near the LRDs, these off-centered blobs are an important piece of the puzzle as to how the LRDs gradually lose their characteristic signatures and join the general galaxy population at lower redshifts. Understand the physical properties of these blobs, as well as their potential interactions with the LRDs, would shed light into the evolution of these peculiar objects. The small angular separation between these blobs and the LRDs render their emission heavily blended and in some cases almost completely dominated by the light from the point source. As a result, deriving the SED for the off-centered emission is particularly challenging. Chen et al. (2025) made a first attempt with images in six broad-band filters and one medium-band filter. By simultaneously decomposing the images using parametric models, they found that the SEDs of three off-centered blobs in their sample can be modeled by stellar populations at similar or lower redshift as the LRD point sources, while the SEDs of the blobs in the other LRDs cannot be well-fit with either galaxy or nebular gas ionized by stars. A more extreme case has been reported in Tanaka et al. (2025), in which the nearby source has similar SED as the predominant point source, prompting the authors to regard them as dual LRDs.
This Letter revisits four LRDs previously analyzed in Chen et al. (2025). By simultaneously analyzing images in eight broad-band filters supplemented with nine additional medium-band filters, we offer a much more precise depiction of the SEDs of the off-centered blobs, hoping to better unveil their nature. We assume a flat cosmology with , , and Hubble constant (Planck Collaboration et al., 2020).
2 Data and Sample
The data used in this work were taken as part of the JWST Cycle 1 Treasury program Ultradeep NIRSpec and NIRCam ObserVations before the Epoch of Reionization (UNCOVER; Bezanson et al. 2024), and the Cycle 2 Medium Bands, Mega Science (MegaScience; Suess et al. 2024) survey. Together, the UNCOVER and MegaScience surveys provide a comprehensive set of deep () images in all NIRCam medium-band and broad-band filters spanning from F070W to F480M, centered on the galaxy cluster Abell 2744 at . We utilize the data release 3 (DR3) multi-band mosaic images from the UNCOVER and MegaScience reduced by Bezanson et al. (2024) and Suess et al. (2024), respectively, in which the images were aligned to stars from the Gaia DR3 catalog (Gaia Collaboration et al., 2023), co-added, and subtracted for the large-scale background using the Grizli pipeline (Brammer et al., 2022). Images in the short-wavelength (SW) bands (F070W, F090W, F115W, F140M, F150W, F162M, F182M, F200W, and F210M) were drizzled to a pixel scale of 002, while those in the long-wavelength (LW) bands (F250M, F277W, F300M, F335M, F356W, F360M, F410M, F430M, F444W, F460M, and F480M) were drizzled to a pixel scale of 004. The final data products include mosaics from 20 filters.
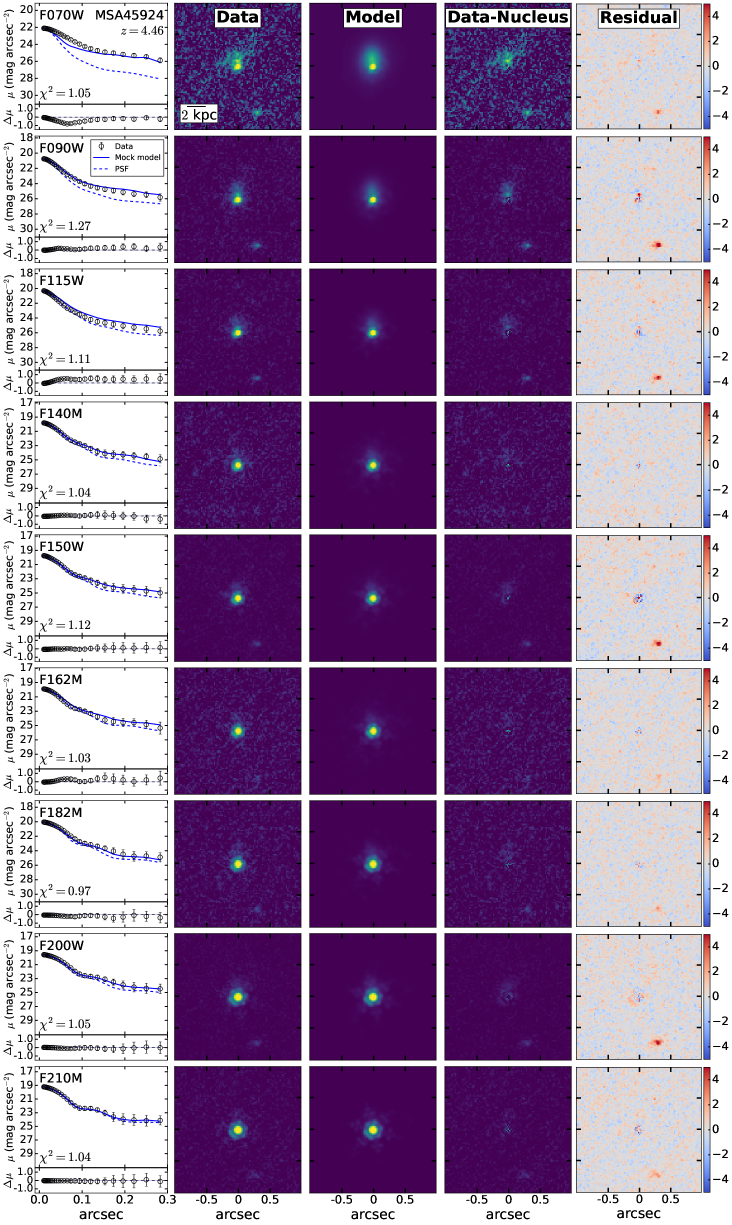
The targets analyzed in this work (MSA10686, MSA13821, MSA41225, MSA45924) were initially classified as LRDs in Labbé et al. (2025a) based on the identification of their point source-dominated morphology exhibiting a characteristic “V-shape” SED. Follow-up observations with NIRSpec/PRISM using the Micro-Shutter Assembly (MSA) were subsequently conducted by Greene et al. (2024), who reported (tentative) detection of broad H emission. The simultaneous seven-band (F115WF444W) image analysis by Chen et al. (2025) revealed extended off-centered components located within 02 () of the dominant point sources111Chen et al. (2025) also discovered an off-centered blob in another source, MSA4286, but we removed it from our sample since it has not been imaged by the MegaScience program.. The SED analysis of Chen et al. suggests that the off-centered blob near MSA41225 could be produced by a projected, intervening galaxy at , while the off-centered emission associated with MSA10686, MSA13821, and MSA45924 is consistent with either either a nearby galaxy or nebular emission at the same redshift as the point sources.
3 Image Fitting
3.1 PSF Construction
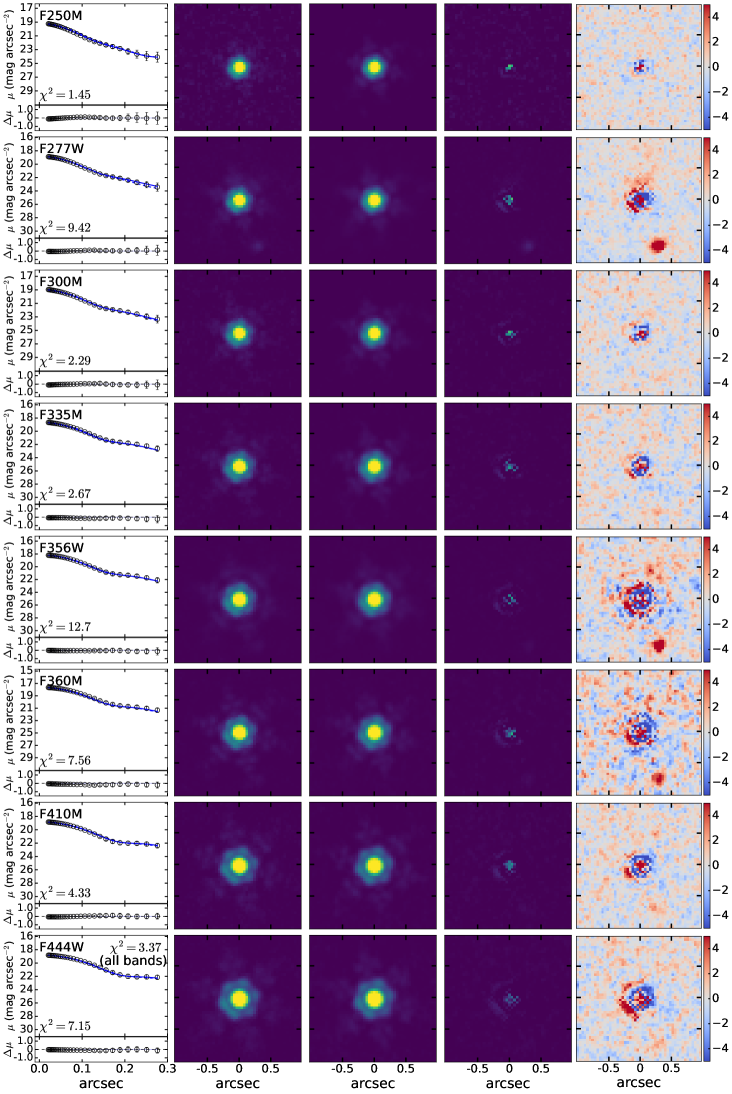
We follow the procedures in Chen et al. (2025) for PSF model construction. For each target, field stars observed with the same telescope on-sky position angle are selected by identifying sources with point-like morphology using SExtractor (Bertin & Arnouts, 1996) and comparing their SEDs with stellar spectral templates. Empirical PSF models are then generated using the pixel-based algorithm PSFEx (Bertin, 2013). The signal-to-noise ratio of the field-star images varies with wavelength, as the LW filters generally have lower signal-to-noise ratio compared to the SW filters because of the decline in stellar flux toward the redder bands. The signal-to-noise ratio of the medium-band filters is also lower that that of the broad-band filters owing to their narrower bandpass. In order to achieve PSFs with more uniform quality across different bands, we construct hybrid PSF models that combine the central core of an empirical PSF with the outer wings of a theoretical PSF generated using WebbPSF (Perrin et al., 2015). For the two reddest medium bands (F460M and F480M), even the inner core of their PSFs proved impossible to constrain, and we therefore excluded them from further consideration.
| MSA | F070W | F090W | F115W | F140M | F150W | F162M | F182M | F200W | F210M |
|---|---|---|---|---|---|---|---|---|---|
| (nJy) | (nJy) | (nJy) | (nJy) | (nJy) | (nJy) | (nJy) | (nJy) | (nJy) | |
| 10686 | |||||||||
| 13821 | |||||||||
| 41225 | |||||||||
| 45924 |
| MSA | F250M | F277W | F300M | F335M | F356W | F360M | F410M | F444W |
|---|---|---|---|---|---|---|---|---|
| (nJy) | (nJy) | (nJy) | (nJy) | (nJy) | (nJy) | (nJy) | (nJy) | |
| 10686 | ||||||||
| 13821 | ||||||||
| 41225 | ||||||||
| 45924 |
3.2 Data Preparation and Fitting Procedure
We use GalfitS (R. Li & L. C. Ho, in preparation), a parametric image modeling code that simultaneously fits multi-band images with different resolutions and pixel scales. For each source, the fit is conducted on a image cutout centered on the point source. The input error map contains three major components: the background, readout noise provided by the weight maps in UNCOVER DR3, and Poisson noise estimated from the mosaics. The final error map is generated adopting the procedures described in the DAWN JWST Archive222https://dawn-cph.github.io/dja/index.html. To remove nearby contaminants for MSA13821, we follow Chen et al. (2025) to create a cutout image in the F277W band that serves as the detection image, perform source detection using the Photutils.detect_source package with nstd = 0.7, npix = 15, and contrast = 0.01, and then measure and remove the local sky background with all sources masked. For MSA10686 and MSA41225, extended wings of foreground galaxies are visible within their cutout images. As these potentially can affect the measurement for the extended off-centered component of the LRD, especially in the LW filters, we do not mask but simultaneously fit and subtract them from the cutout images in all bands. Specifically, we model the light profiles of the nearby galaxies with a Sérsic (1968) function and the LRDs are described as a point source. Then, the nearby galaxies, LRDs, and a uniform background model are fit together in cutout images large enough to include the centers of all nearby galaxies, which in our case is for MSA10686 and for MSA41225. During the fitting, , , and the positions of the Sérsic and point source profiles are fixed across different bands, allowing only the brightness of the light profiles and background to vary. The extended wings from nearby galaxies as well as the local background in the final cutout images are subsequently subtracted using the best-fit models. Note that in the above fitting, we do not include an additional component to describe the off-centered blobs, because the morphology and brightness of these low-surface brightness components hardly can be constrained in the relatively large image cutouts. Since our goal in this initial step is to remove contamination from the extended wings of much brighter nearby galaxies, the effect of these much fainter blobs should be minimal.
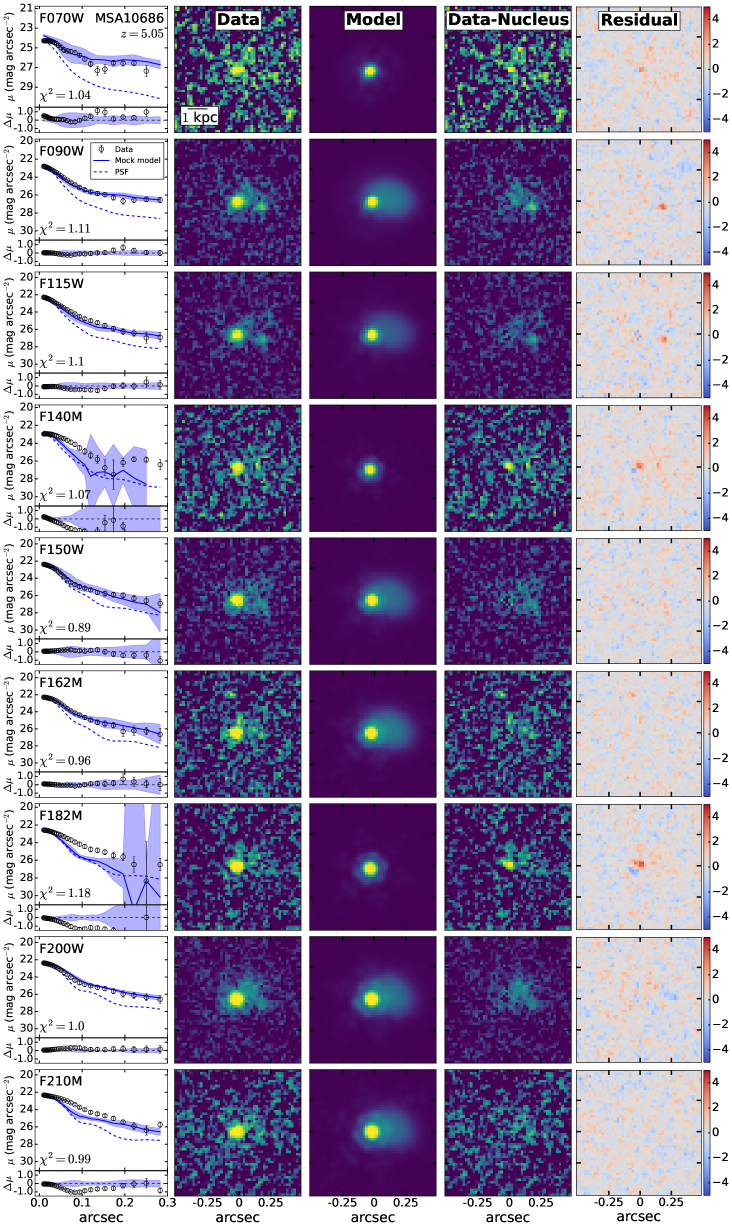
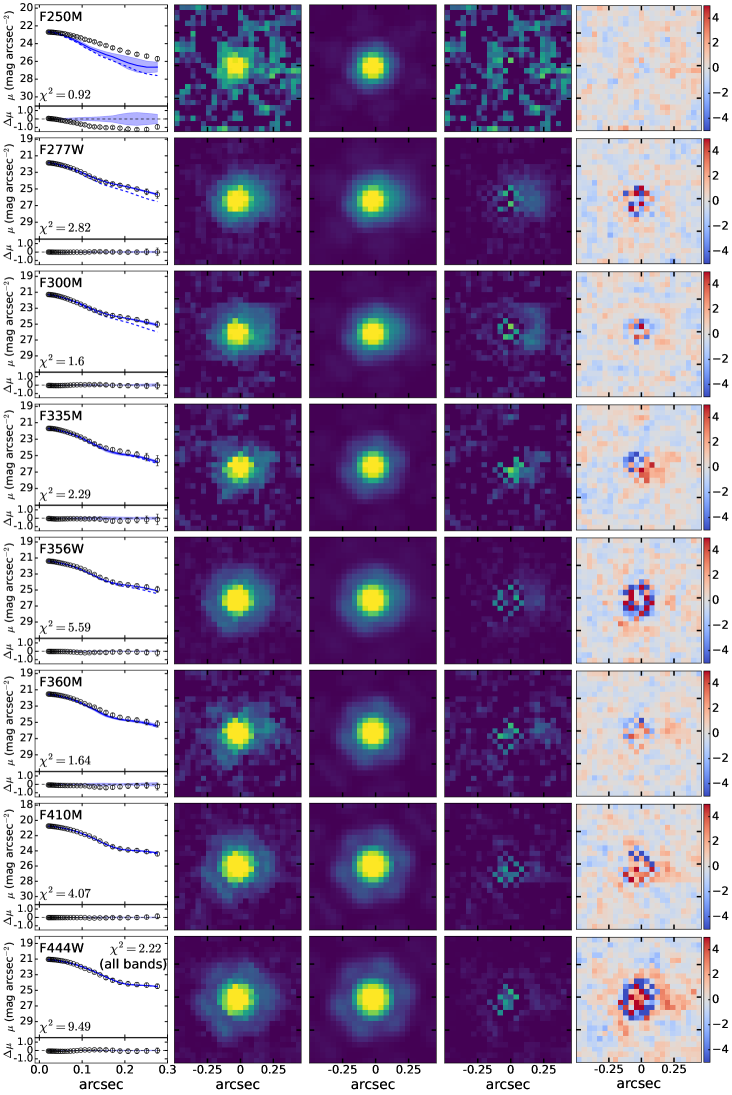
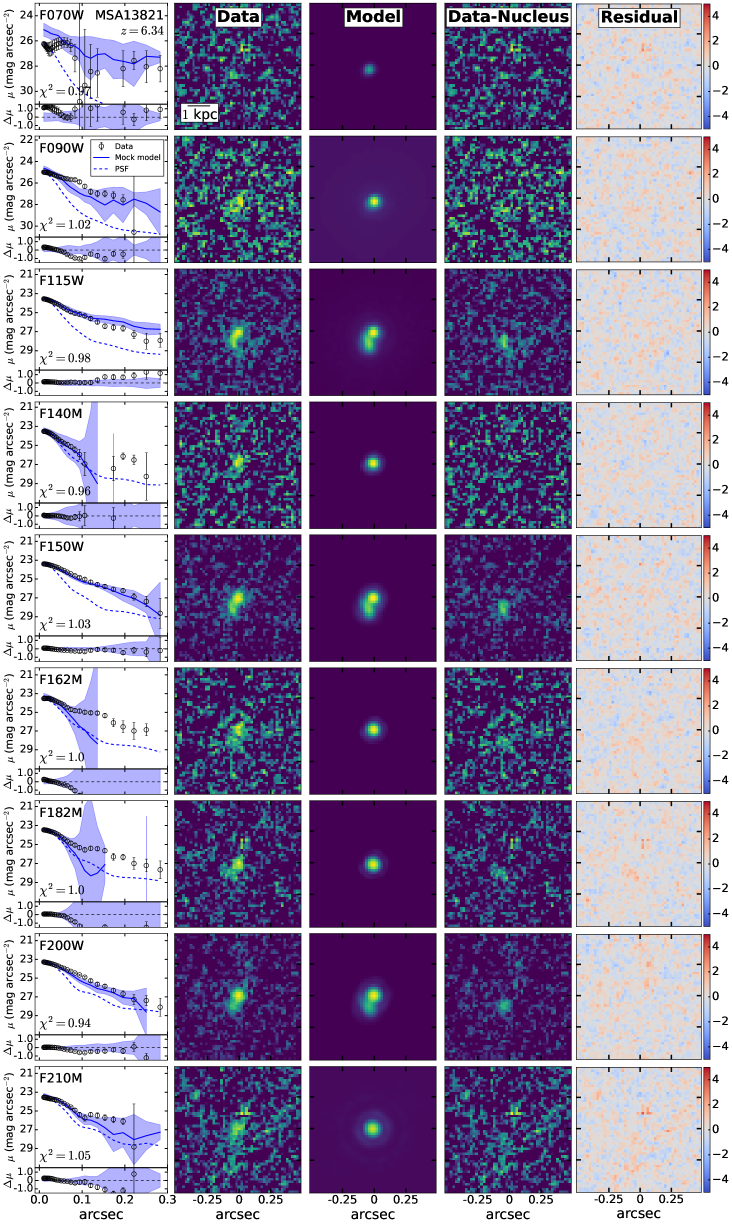
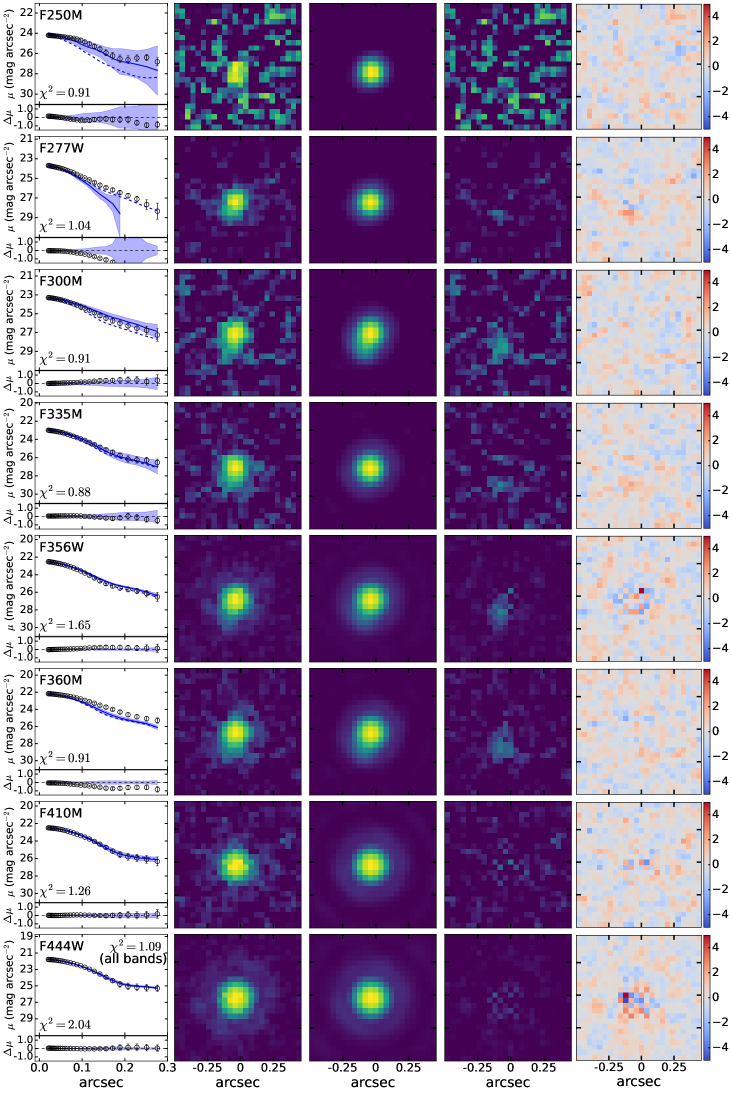
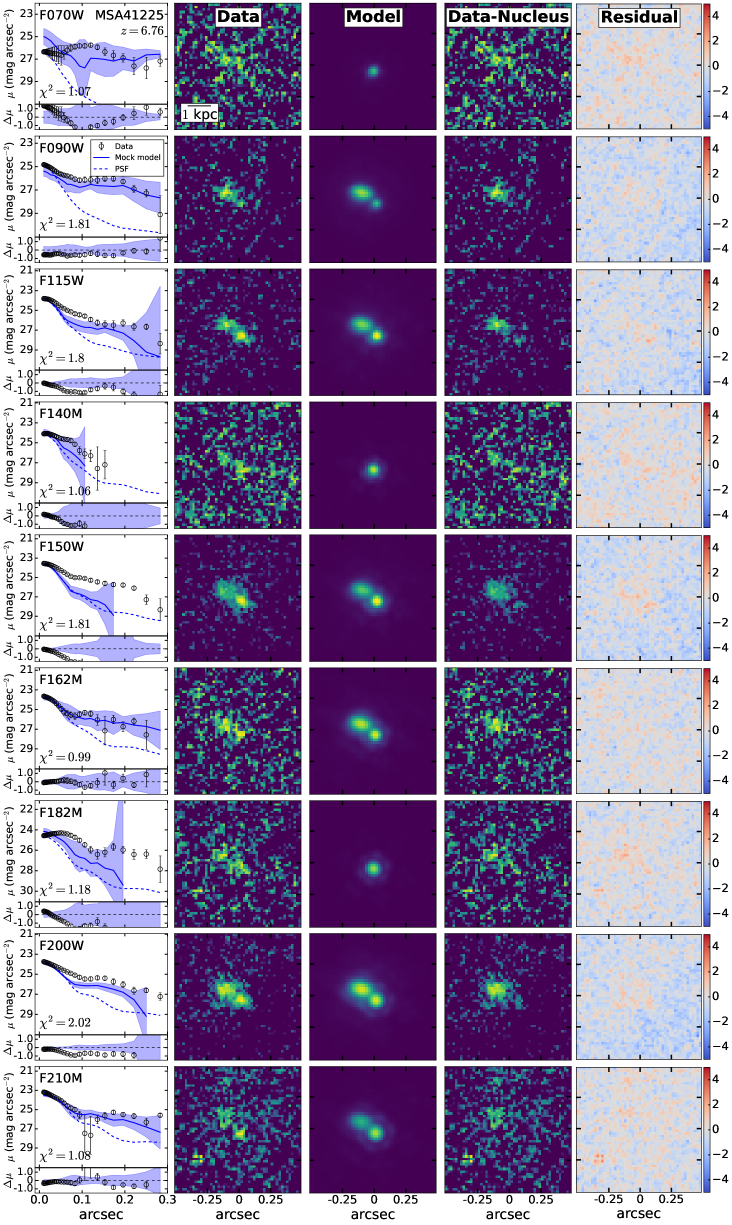
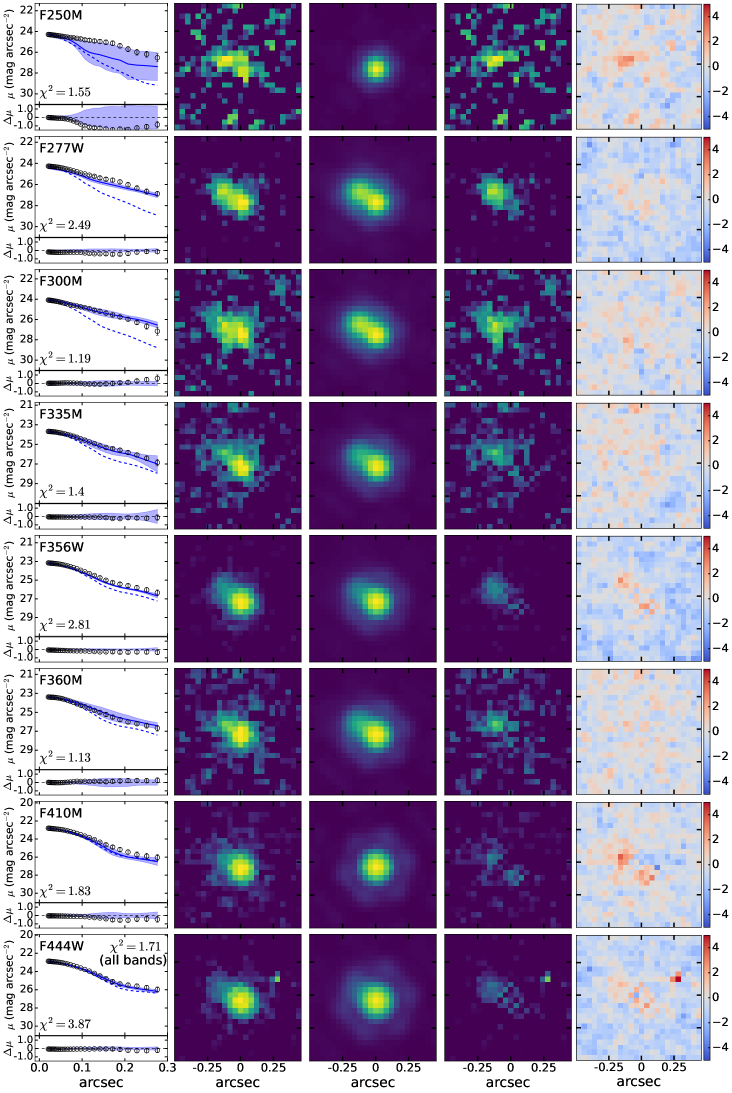
For the final fitting to characterize the off-centered blobs, we adopt the cutout images with background subtracted and nearby sources masked. The cutout size is for all targets except for the much brighter MSA45924, for which we use a cutout to include the prominent PSF diffraction spikes. We model the light profile of the LRD with a point source and adopt the Sérsic profile to represent the off-centered blobs. Initial values of structural parameters are set according to the values provided in Chen et al. (2025); the fit assumes that the parameters are constant in different bands. All the fits use the Adam Optimizer as the optimization algorithm to locate the position of maximum likelihood in parameter space. We run this process 20,000 times. We then perform nested sampling around the position of maximum likelihood to infer parameter uncertainties from the posterior distribution. Figure 1 illustrates the fit for MSA10686. Results for the other three sources are shown in Appendix A.
3.3 Estimation of Flux Upper Limit
To minimize potential bias in the SED modeling of the off-centered blobs, we adopt stricter constraints compare to Chen et al. (2025) in determining their flux upper limits. We first run a set of additional fits using only a point source to model the LRD itself. We then evaluate the goodness-of-fit in each band using the Bayesian information criterion,
| (1) |
with the number of model parameters, the number of data points, and the fitting likelihood. A smaller BIC value indicates better fitting performance. For a given band, if including the off-centered Sérsic model does not reduce the BIC value by more than 10, we treat the off-centered blob as a non-detection and perform realistic mock simulations to place an upper limit on its flux. We begin by visually selecting empty sky regions from the UNCOVER mosaics that have the same on-sky position angle combination as the target, requiring that the surface brightness fluctuation level of the empty sky region differs by less than 0.5 mag compared with the background near the target to ensure that the mock image is truly an analog of the observed data. We then generate a mock model that includes the best-fit point-source component as well as the best-fit off-centered Sérsic component whose total flux has been rescaled between 26 to 30 mag, in steps of 0.5 mag. For each magnitude step, 10 mock images are generated, each by combining the sky background, mock model, and random pixel-to-pixel Poisson noise calculated from all the components. We then fit all the mock images with an off-centered Sérsic point-source model, as well as a single point-source model, and compare the BIC values to calculate the detection fraction of the off-centered component in each magnitude bin. The flux upper limit is defined as the value where the detection probability reaches 68.2%, with the exact number calculated by linearly interpolating between the two adjacent magnitude bins whose detection probabilities are below and above .
For the bands that satisfy the aforementioned BIC selection criterion, we further compare the measured flux of the off-centered blobs with the detection limit of the same band. The best-fit fluxes are only taken as solid detection if they surpass the detection limit by more than the uncertainty of the best-fit flux. We report the final photometric measurements in Tables 1 and 2.
4 SED Analysis
4.1 Photometric Redshift and Overlapping Probability
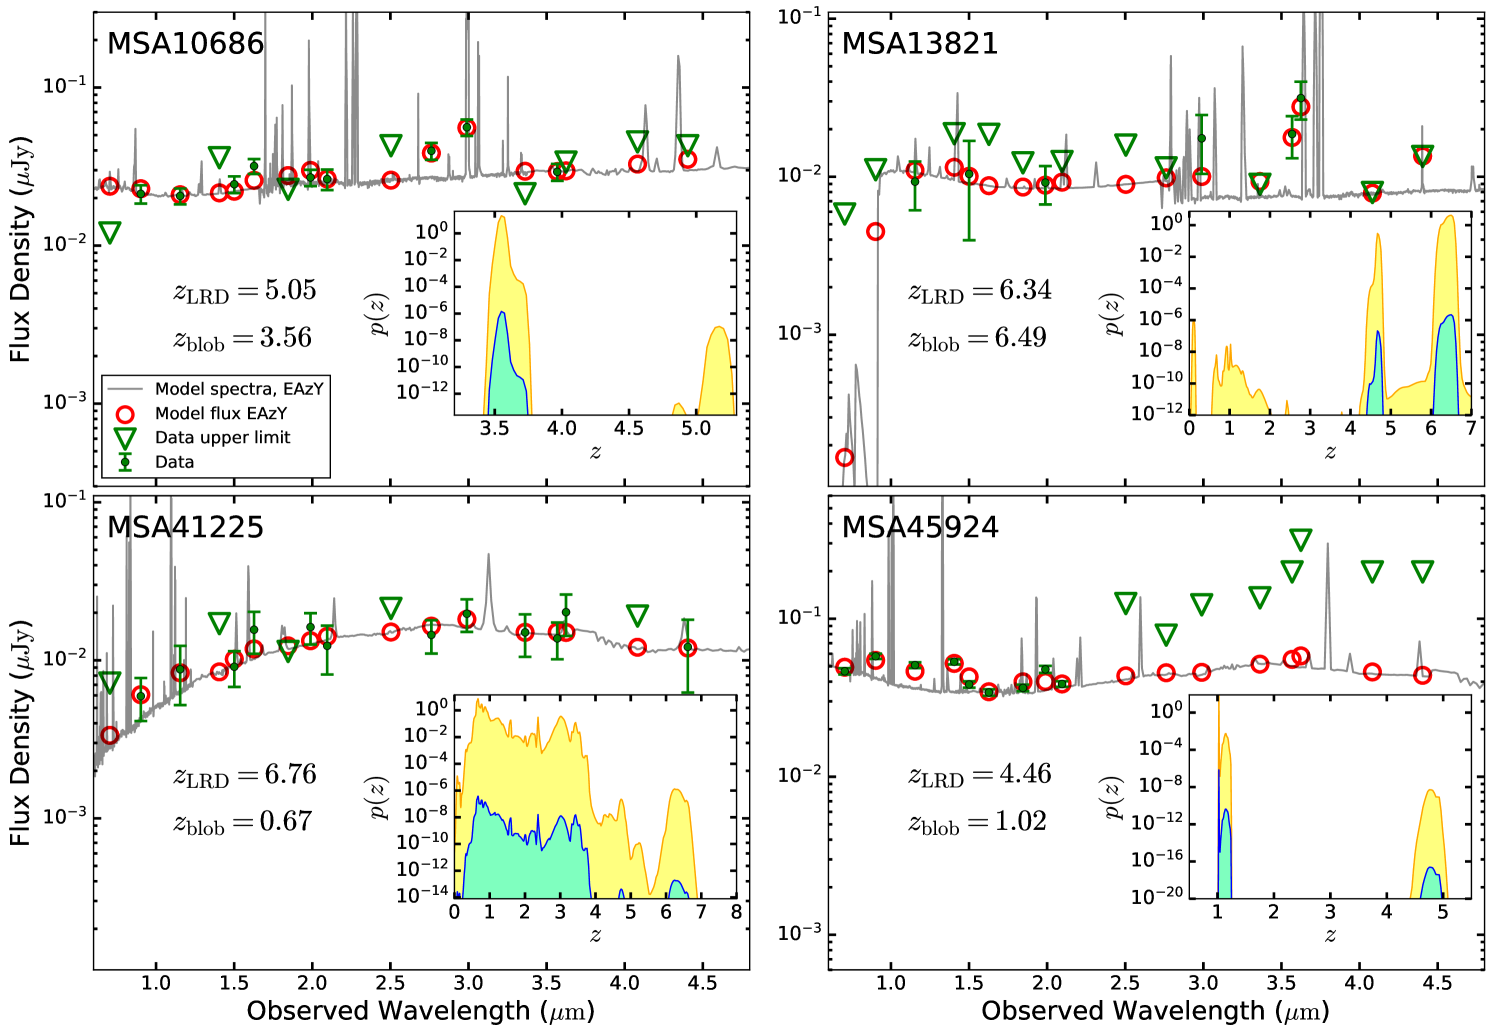
We first estimate photometric redshifts using EAzY (Brammer et al., 2008), aiming to determine whether the off-centered blobs are physically associated with the LRD point sources, or just galaxies at different redshift projected close to the line-of-sight. We use the standard set of 12 templates in EAzY generated from the stellar population synthesis code of Conroy et al. (2010). To account for the possible high-redshift nature of these blobs, we also include templates from Larson et al. (2023) that are optimized for typical galaxies in the range . Upper limits during the fits are treated as data points with both their values and errors equal to 0.5 times the actual upper limits. This configuration allows the model values in these bands to vary between zero and the upper limit with the confidence, with preference given to model fluxes closer to one half of the detection upper limits. The consequences of this treatment of the upper limits will be explored further in Section 4.2. No magnitude priors are adopted. We found that all four sources exhibit bimodal redshift probability distribution functions, with one peak located near the spectroscopic redshift of the LRDs and the other at a lower redshift.
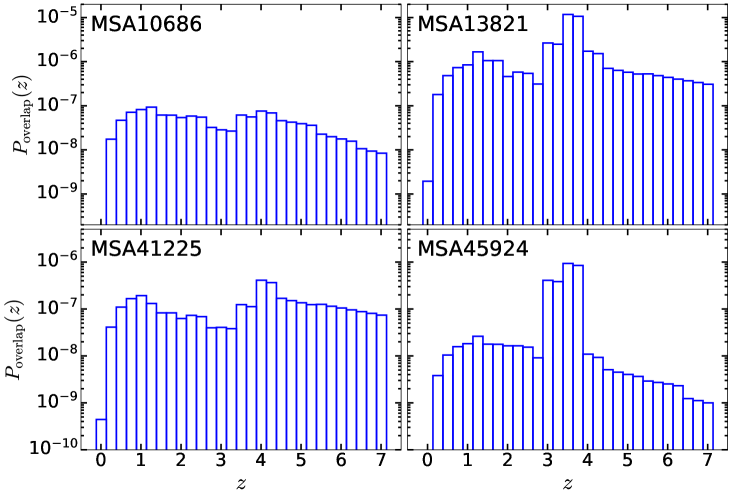
To quantify the probability that the off-centered blobs lie at redshifts discordant with those of the LRDs, we follow the procedures in Bloom et al. (2002), Berger (2010), and Wu et al. (2022), assuming a uniform spatial distribution of galaxies such that the overlapping probability can be described by a Poisson distribution,
| (2) |
in which and are the best-fit value and uncertainty of the distance between the point source and the center of the blob, is the line-of-sight comoving distance within a certain redshift bin, and is the comoving number density of galaxies at redshift , given the apparent magnitude and magnitude uncertainty of the blob. The comoving number density is calculated as
| (3) |
where is the galaxy luminosity function at redshift . Given our wavelength coverage from 0.7 to 4.4 , we adopt the rest-frame -band luminosity function for and the rest-frame 1600 Å UV luminosity function for . Specifically, at we use the -band luminosity function from Loveday et al. (2012), and at we adopt the results from Marchesini et al. (2012), who derived the rest-frame -band luminosity function and its evolution up to using a galaxy sample selected in the near-infrared. For , we use the UV luminosity functions of Bouwens et al. (2015), at each redshift using the best-fit model flux in the band whose pivot wavelength, when transformed back to the rest-frame, is closest to , and in which the off-centered emission has been detected. We exclude F070W and F090W to avoid potential effects from intergalactic medium absorption. Figure 2 shows the overlapping probability for the four targets. The final photometric redshift probability is obtained by multiplying the overlapping probability with the one derived from EAzY, for all except the value at the spectroscopic redshift of the LRD point source, for if the off-centered emission is indeed at this redshift, physical correlation (Section 4.3) can exist between the blob and the LRD, in which case our assumption of a uniform galaxy spatial distribution is no longer applicable. We present the photometric redshift fitting results in Appendix B, and further examine both the high- and low-redshift solutions under a more sophisticated stellar population synthesis framework in the following section.
4.2 Stellar Model
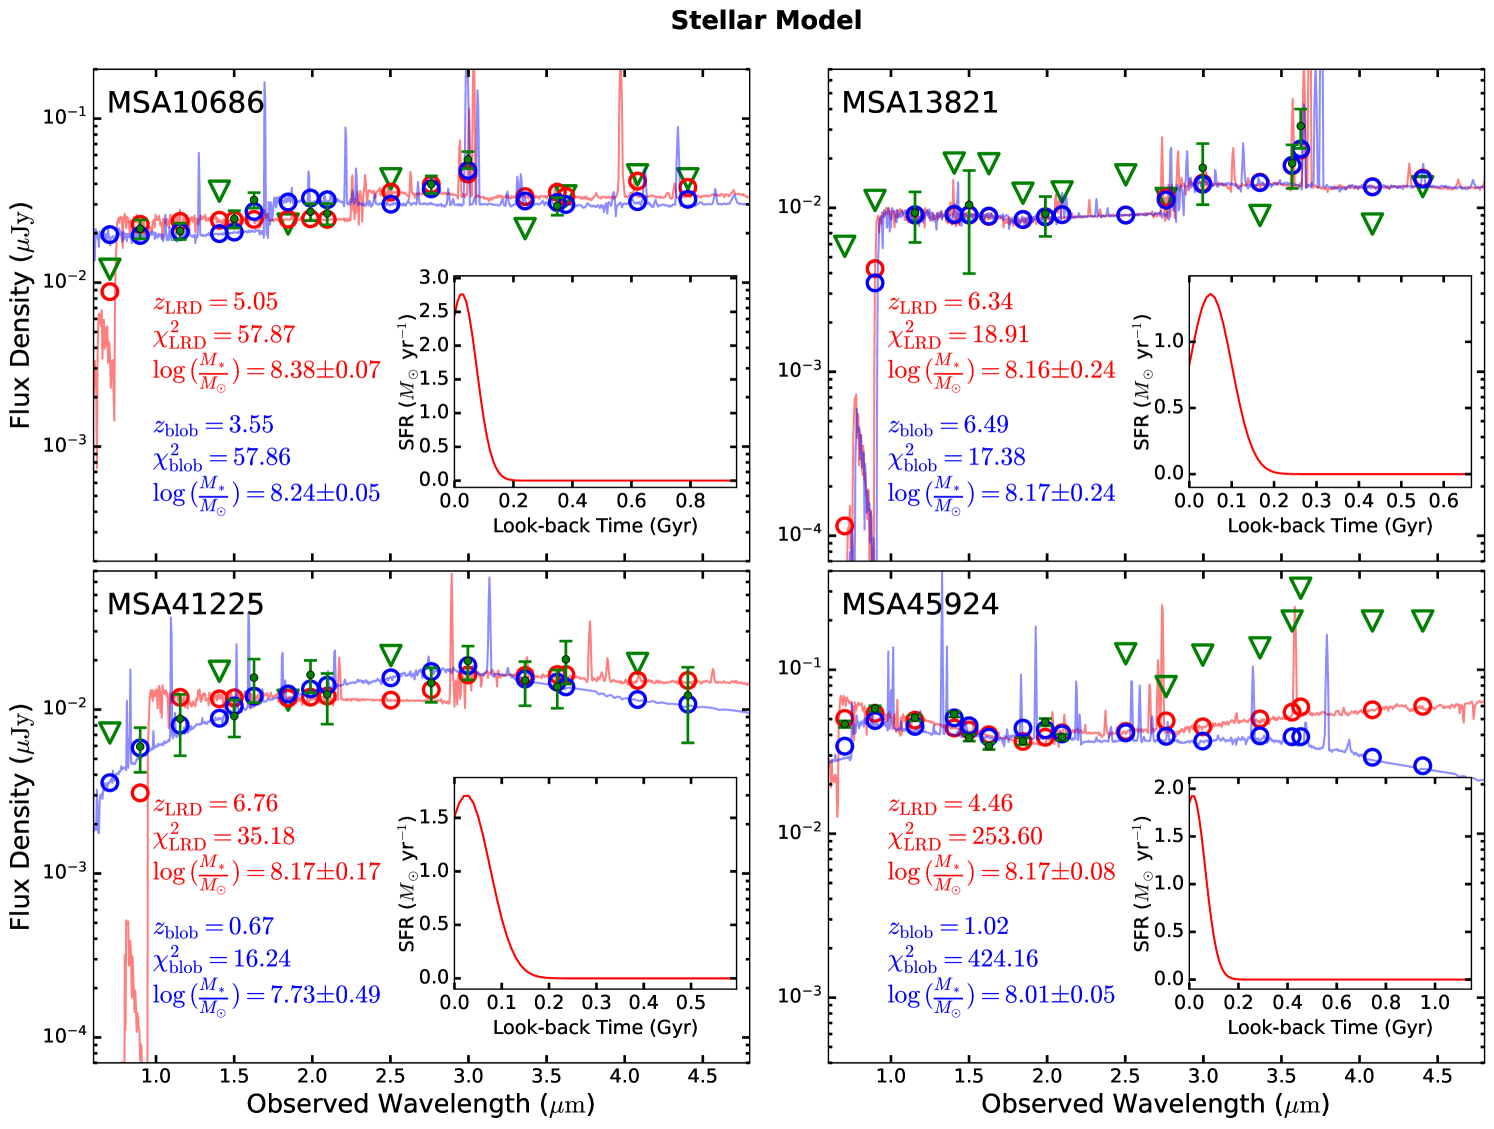
Our photometric redshift analysis suggests that, apart from MSA13821, the physical association of the off-centered blobs and their nearby LRD is ambiguous: there exists two possible solutions, one similar to the spectroscopic redshift of the LRD point source and another at lower redshift. To evaluate further the robustness of these two solutions and to explore the physical properties of these potential companion galaxies, we model the observed multi-band photometry with the SED fitting module in GalfitS. Specifically, model SEDs are calculated with the theoretical stellar templates from the Binary Population and Spectral Synthesis (BPASS V2.3; Byrne et al. 2022) code assuming a stellar initial mass function from Kroupa (2001). We adopt a continuous star formation history, which includes a stellar population undergoing continuous star formation since 200 Myr after the Big Bang, as well as a single stellar population formed in a burst that lasted for 100 Myr. In practice, the age of the single stellar population and the fraction of the total stellar mass formed during the burst () are treated as free parameters. Nebular emission from young stars is computed using the spectral synthesis code CLOUDY (Ferland et al., 1998; Chatzikos et al., 2023), assigning the same gas-phase metallicity as the stellar metallicity. The combined templates are then corrected for dust extinction using the Calzetti et al. (2000) extinction curve and absorption from the intergalactic medium using the formalism of Meiksin (2006) to produce the final galaxy SED model. Parameter ranges during the fitting are set as follows: between to 1, metallicity between 0.05 to 1 , from 0 to 5 mag, and stellar mass . We perform two fits, one at the spectroscopic redshift of the LRD point source and another at the best-fit photometric redshift. In each run, the age of the stellar population varies between and the cosmic age minus 200 Myr at the corresponding redshift.
Figure 3 presents the SED fits for both the high- and low-redshift solutions using stellar models. We slightly modify the manner in which we calculate the total of the fitting results. For the bands with solid detections, we sum up the residual value of as in the conventional method, while for the bands with non-detections we only sum the residual values when the model fluxes exceed the upper limits. For MSA10686 and MSA13821, the low- and high-redshift solutions differ very little in terms of the total (; ). By contrast, the low-redshift solution for MSA41225 has lower by 18.94, which translates to a factor of in terms of probability, while for MSA45924 the high-redshift solution, with , gives a much better description to the data. Therefore, for all sources except MSA41225, considering the low overlapping probability (typically ), our results favor the high-redshift solutions consistent with the spectroscopic redshift of the LRD point sources over the low-redshift solutions given by EAzY, firmly suggesting that the off-axis blobs are physically associated with the LRDs. In terms of MSA41225, we are less certain about its redshift due to the relatively large probability deficit of the high-z solution implied by the . Therefore, in this and the following sections, we proceed under the assumption that the blobs are at same redshift as their LRD point sources, and restrict our analysis to MSA10686, MSA13821, and MSA45924, whose stellar models at the LRD redshift are equally good or show significant improvement compare to their low-redshift photometric redshift solutions. The best-fit parameters assuming the LRD redshift are reported in Table 3.
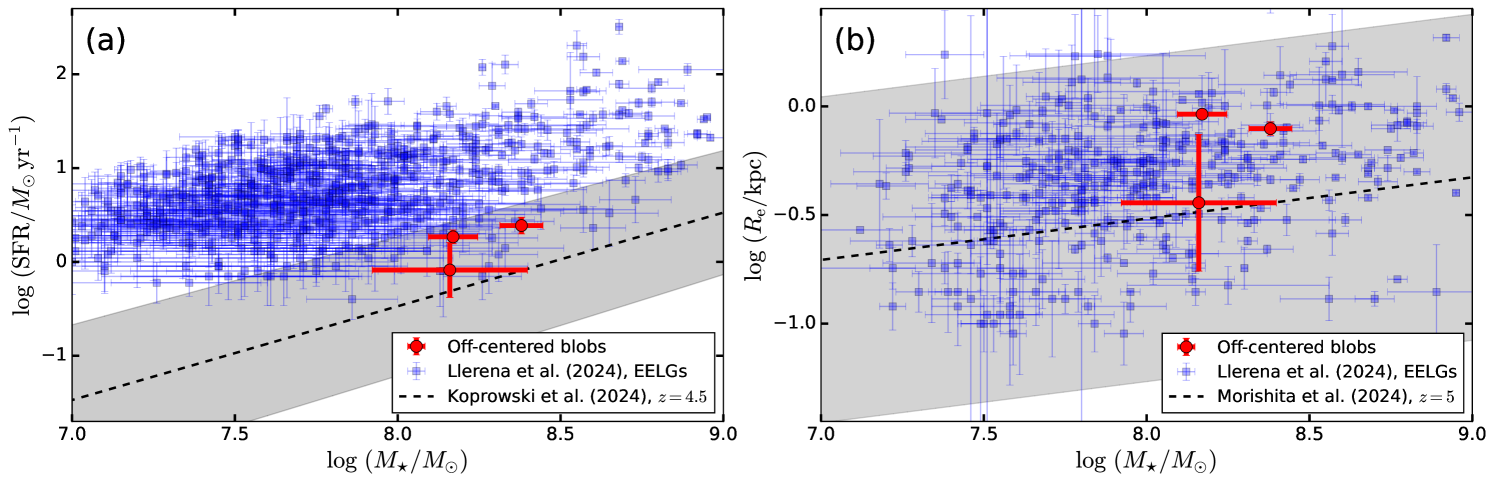
The [O III] and complex falls within the wavelength coverage of the medium-band filter F300M for MSA10686 and F360M for MSA13821. Both bands are detected unambiguously (Figure 3). The best-fit stellar SED model attributes the localized flux excess mostly to the [O III] doublet, with an [O III] equivalent width of 138 Å for MSA10686 and 256 Å for MSA13821. However, the SED models for these two targets underpredict the observed F300M flux by and the F360M flux by . Assuming that all of the flux deficit originates from [O III] and that the two lines have the same width and an intensity ratio of (Storey & Zeippen, 2020), the true equivalent width of [O III] should be 276 Å for MSA10686 and 738 Å for MSA13821, akin to so-called extreme emission-line galaxies (EELGs; e.g., van der Wel et al. 2011). Figure 4 compares the stellar mass, SFR, and effective radius of the off-centered blobs, within the context of the stellar model, with a sample of high-redshift EELGs at selected using empirical color-color criteria derived from templates based on local metal-poor starburst galaxies (Llerena et al., 2024). High-redshift EELGs lie systematically above the star-forming main sequence at (Koprowski et al., 2024), and they generally follow the stellar mass-size relation at (Morishita et al., 2024). The off-centered blobs, if they are indeed galaxies, have properties that are consistent with those of high-redshift EELGs.
| MSA | Stellar Model | Nebular Model | |||||
|---|---|---|---|---|---|---|---|
| () | () | (Myr) | (mag) | () | () | ||
| (1) | (2) | (3) | (4) | (5) | (6) | (7) | (8) |
| 10686 | |||||||
| 13821 | |||||||
| 45924 | |||||||
Note. — Col. (1): Name. Col. (2): Total stellar mass. Col.(3): Star formation rate averaged over the last 10 Myr. Col. (4): Age of the recent starburst. Col. (5): Dust extinction in the band. Col. (6): Nebular electron density. Col. (7): Nebular gas metallicity. Col. (8): Scaling factor of the nebular template.
4.3 Nebular Model
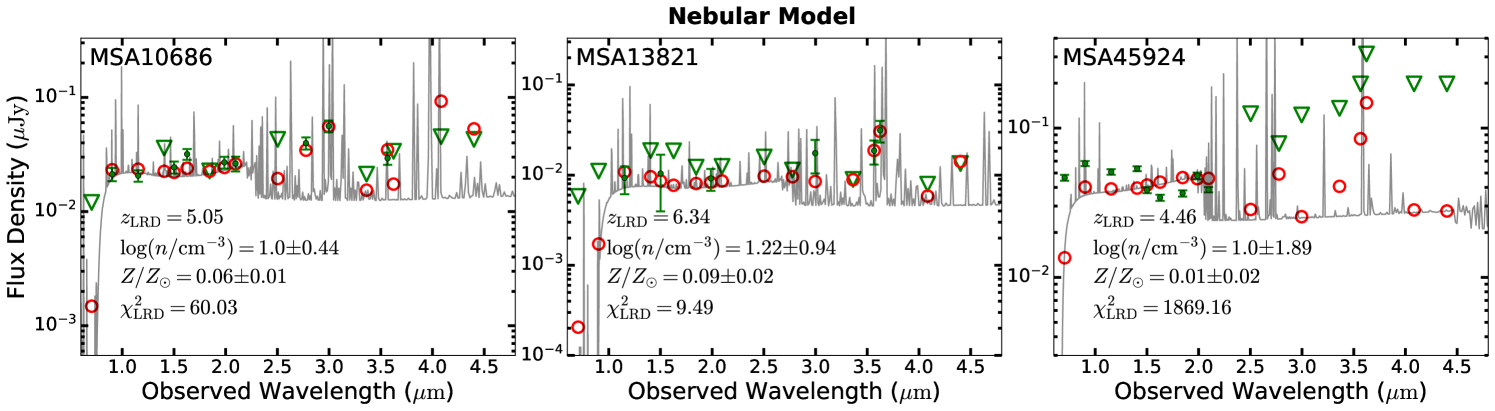
While the stellar model can generally reproduce the observed SED, it underpredicts the fluxes from the [O III] complex, indicating a potentially different, nonstellar source of ionization. We explore the possibility that the off-centered emission originates from gas photoionized by the radiation from the nearby LRD point source. We calculate a grid of spectral templates using CLOUDY, adopting an open geometry with the inner and stop radius set to and , respectively, with the effective radius of the off-centered emission and the distance from the LRD point source. The output spectrum is especially sensitive to the shape of the ionizing spectrum in the extreme-UV, which contributes the majority of the ionizing photon budget. We construct the input ionizing spectrum by interpolating the observed multi-band photometry of the LRD point source. As we cannot directly measure the continuum shorter than the Lyman limit due to intergalactic medium absorption, we assume that it follows the same power law redder than the Lyman limit333We have verified that under this approximation and case B recombination the number of Lyman continuum photons suffices to produce the observed luminosities reported in Greene et al. (2024).. We calculate the spectral slopes by fitting a power-law function to all the detected broad-band photometry of the LRD point sources whose pivot wavelength is shorter than 3500 Å, as the spectral turnover for LRDs generally occurs near the Balmer limit. Only broad-band photometry is used to avoid possible contamination of emission lines to the medium bands, but we exclude F070W and F090W because they are affected by intergalactic medium absorption. Expressing the UV power law continuum as , , , , and for MSA10686, MSA13821, MSA41225, and MSA45924, respectively. The fraction of the ionizing radiation that enters the blobs is calculated using a covering factor estimated from the solid angle of a sphere centered on the LRD whose radius and position equal the effective radius and the center of the off-centered blob. We compute spectra with different combinations of the density and metallicity, with in steps of 1 dex and , 0.02, 0.2, 0.4, and assuming solar elemental abundances. We then correct the output spectra for intergalactic medium absorption following the formalism (Meiksin, 2006) used for our stellar model, before interpolating them as a two-variable function of and using the Python package Scipy.interpolate.RegularGridInterpolator to obtain the final nebular spectral models. Least-squares fitting is performed to search for the nebular parameters that produce a spectrum bearing the closest resemblance to the observed SEDs. The fitting includes a free parameter , which varies between 1 and 10, to scale the total flux of the model spectrum, to account for potential effects from non-spherical geometry as well as inhomogeneity in density and metallicity distribution, which are not considered in our CLOUDY calculations.
The fitting results for the nebular model are shown in Figure 5 and reported in Table 3. Overall, the nebular model describes well the SEDs of MSA10686 and MSA13821, especially in the band with a flux upturn due to strong line emission from [O III] and . For MSA13821, the nebular model achieves a better fit () compared to the stellar model. The result from the nebular model of MSA10686 has similar goodness-of-fit as the stellar model, with slightly higher (). The best-fit models for MSA10686 and MSA13821 suggest the off-center, extended blob arises from low-density (), metal-poor () gas. Note that while the best-fit density of MSA10686 reaches the lower limit of our parameter grid, we are unable to explore results of lower density, as it causes catastrophic failure in CLOUDY due to large negative optical depth in line transition.
By contrast, the nebular model failed to fit the SED of MSA45924. Most of the mismatch between data and model occurs in the bluest end of the SED sampled by F070W and F090W, where the turnover in the nebular spectrum due to two-photon decay underpredicts the observed flux.
5 Discussion
5.1 Nature of the Off-centered Blobs
Off-centered, extended emission is associated with a significant fraction of LRDs. In their systematic study of 99 photometrically selected LRDs at , Rinaldi et al. (2025) find that show a variety of complex, asymmetric UV morphologies beyond the dominant central point source. This is consistent with the results of Chen et al. (2025), based on much meager statistics. What is the physical nature of this asymmetric, resolved component? Assuming that the off-centered emission near LRDs is of stellar origin, we show that their inferred SFRs, stellar masses, and effective radii qualitatively resemble those of high-redshift EELGs. Under this interpretation, the off-centered blobs may be regarded as companion galaxies, which are presumably interacting or merging with a large fraction of the LRDs. While LRDs lack a galaxy component (Chen et al., 2025) massive enough to be commensurate with the local scaling relations between black hole and galaxy mass (Kormendy & Ho, 2013; Greene et al., 2020), gas tidally stripped from these star-forming galaxies could be the fueling channel that maintains these black holes in an active state. Alternatively, if the off-centered blobs comprise stars of the LRD host galaxies themselves, then their global asymmetry can arise from dynamical processes that can dislodge the black hole to kpc-scale distances, such as gravitational recoil (Bekenstein, 1973; Campanelli et al., 2007) or gravitational slingshot effects (Hoffman & Loeb, 2007), indicating that the central black holes in the LRDs are produced by merging from multiple lower mass black holes. The stellar scenario offers the best interpretation for the off-centered emission in MSA45924.
Extended structures observed in broad-band images, especially near luminous AGNs like the LRDs, are not necessarily of stellar origin. We explore an alternative possibility, in which the off-centered blobs constitute nebular gas directly ionized by the radiation field emanating from the adjacent LRD. Our photoionization calculations show that this scenario is viable, for two of the four sources studied here. Using the observed SED of the LRD as the ionizing radiation source and the relative displacement between the off-centered component and the point source, the nebular model can very well explain the observed flux and SED shape of MSA10686 and MSA13821, even better than the stellar model in the case for MSA13821. The nebular model has notable success in accounting for the high equivalent width of the [O III] line detected in the medium-band filter F300M for MSA10686 and F360M for MSA13821. This is reminiscent of the situation in high-redshift galaxies whose hard ionizing radiation field produces sufficient nebular emission to affect the broad-band flux (e.g., Cameron et al., 2024; D’Eugenio et al., 2025; Kataria et al., 2025; Solimano et al., 2025). For these two targets, the best-fit nebular model gives a density of , with radius-averaged electron temperature of . Since the best-fit density already reaches the lowest value of our photoionization calculations, the real density could be lower. The low density and low surface brightness of the nebular emission qualitatively resembles the warm ionized medium ubiquitously detected in local spiral galaxies (e.g., Wang et al. 1998). Interestingly, although under the nebular scenario the extended emission does not require necessarily the presence of any galaxy, the best-fit metallicity for MSA10686 and MSA13821 are both , much higher than that of the intergalactic medium at cosmic noon. According to Simcoe et al. (2004) and McQuinn (2016), only of sight lines with O IV or C IV absorption at have metallicities higher than . At redshifts closer to the sources in our sample, the 95% upper limit of the intergalactic medium [Mg/H] ratio, defined as the logarithmic number ratio of magnesium atoms to hydrogen atoms relative to the solar ratio, is at (Tie et al., 2024), suggesting . The nebular gas could have been chemically enriched by stars in a preexisting, albeit undermassive (Chen et al., 2025), host galaxy. or by star formation connected with the accretion disk (e.g., Artymowics et al., 1993; Zhang et al., 2025).
Future JWST observations with spatially resolved spectra, such as those that can be obtained with the integral-field units of NIRSpec or via slitless spectroscopy with NIRCam or NIRISS, can provide more definitive diagnostics of the physical nature of the extended, off-centered emission associated with LRDs. For example, our nebular model for MSA1068 predicts prominent [S II] emission, similar to the situation seen in the warm ionized medium in the local Universe that shares similar density and temperature as our best-fit model spectrum. Detection of [S II] and measurement of the [S II]/ ratio for the extended emission would provide smoking gun support for their nebular nature.
5.2 Estimation of Gas Mass and Halo Accretion Rate
We estimate the total mass of ionized gas in both models. Under the stellar scenario, in which the continuum is assumed to be produced by stars, photometry in F300M and F360M provides constraints on the total flux of the [O III] complex in MSA10686 and MSA13821, respectively. We convert this value to luminosity using the relation between [O III]/ ratio and specific star formation rate derived in Dickey et al. (2016). The gas mass is then calculated using the dereddened luminosity, assuming , , and an effective recombination coefficient of (Draine, 2011),
| (4) |
If the off-centered blobs near MSA10686 and MSA13821 are galaxies, their estimated ionized gas mass is and , respectively444We bootstrap all parameter uncertainties through each step of the calculation and take the final standard deviation as the error.. Under the nebular scenario, the broad-band emission is attributed to the recombination continuum. In this case, we estimate the total ionized gas mass using the best-fit electron density and total emission volume of our CLOUDY model, multiplied by the best-fit scaling factor . For MSA10686 and MSA13821, their best-fit nebular templates correspond to and , higher than the prediction from the stellar model by more than an order of magnitude.
If the off-centered gas clouds on kpc scales are infalling within the halo of the LRDs, their gas mass provides a rough estimate of the LRD halo mass accretion rate. The infall time of the gas clouds onto the LRD halo can be estimated as
| (5) |
where is the distance between the off-centered blobs and the LRD point source, is the central enclosed halo mass within radius , which is a function of both the virial mass of the entire halo (), the halo concentration and redshift . The baryonic mass accretion rate is therefore
| (6) |
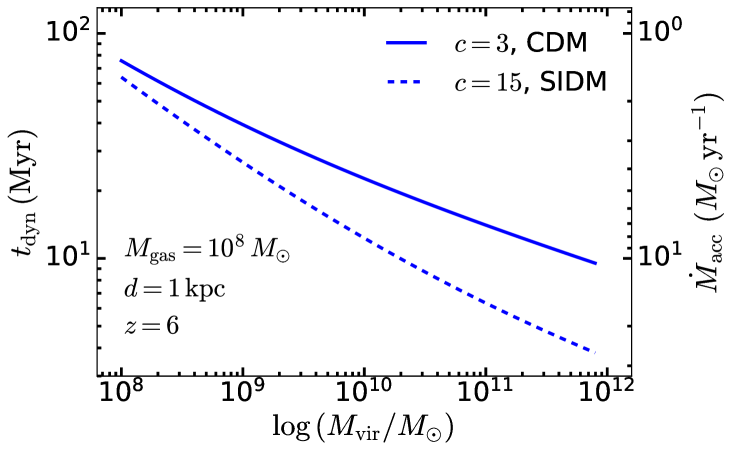
These estimates depends on our highly incomplete knowledge of the halo masses of LRDs. Clustering analysis of 27 low-luminosity broad-line AGNs discovered by JWST at , among them LRDs, constrain their typical halo mass to (Arita et al., 2025). On the other hand, Jiang et al. (2025) recently proposed a model for the formation of seed black holes in LRDs via the gravothermal collapse of the cores of self-interacting dark matter (SIDM) halos. Within this framework, core collapse occurs most efficiently within a relatively narrow range of halos with masses , significantly lower than that suggested by the clustering analysis of Arita et al. (2025). In Figure 6, we present the value of and as functions of for halos with , which is typical for the conventional structure formation framework assuming cold dark matter (CDM), and halos with as proposed by Jiang et al. (2025) in the SIDM scenario.
For typical CDM halos with at , if the halo mass estimated by Arita et al. (2025) can be applied to typical LRDs, the infall time of a gas cloud starting at 1 kpc scale is , and the accretion rate . Alternatively, adopting the lower halo mass () predicted for the SIDM halos with , the infall time increases to , and the accretion rate drops to . For an LRD at , if the halo accretion rate is sustained to , the accreted gas would form a galaxy with a total stellar mass assuming a star formation efficiency of 0.1. The stellar mass would be even higher if stars form more efficiently at high redshift (e.g., Inayoshi et al. 2022; Ceverino et al. 2024). The large stellar mass assembled would gradually render the LRD spatially resolved, which explains the rapid decline in the number density of compact sources with the characteristic “V-shape” SEDs at reported by both observations (Kocevski et al., 2025; Ma et al., 2025) and theoretical predictions (Inayoshi, 2025).
6 Summary
A significant fraction of LRDs exhibits nearby extended emission of unknown origin. If physically associated with the LRD, this component may trace stellar emission from an off-centered host galaxy or neighboring companions, or nebular gas illuminated by the active nucleus. We perform simultaneous 17-band morphological decomposition for four LRDs in the UNCOVER and MegaScience surveys, and for the first time report the continuum shape and properties of the [O III] complex for the off-centered extended emission that are commonly detected in the immediate vicinity of LRDs. We evaluate whether these emission blobs are physically associated with the LRDs by estimating their photometric redshift and probability of foreground galaxy overlapping. These measurement enable us to further understand the physical nature of these blobs by analyzing the observed SEDs with both a stellar model and pure nebular emission model. Our main conclusions are as follows:
-
•
Combining the photometric redshift and overlapping probability, we confirm that three of our targets (MSA10686, MSA13821, MSA45924) are at a similar redshift as the LRDs, while the fourth (MSA41225) is more consistent with a projected galaxy of lower redshift.
-
•
Fitting the SEDs of the extended emission physically associated with the remaining three LRDs, the stellar model yields star formation rates, stellar masses, and effective radii that are consistent with the properties of high-redshift extreme emission-line galaxies. However, only the blob of MSA45924 is best fit by the stellar model. The extended emission associated with MSA13821, and to a lesser extent also that of MSA10686, is consistent with nebular emission from low-density (), low-metallicity () gas photoionized by the ultraviolet radiation from the nearby LRD.
-
•
Using current constraints on the halo masses of the LRDs estimated from clustering analysis and theoretical considerations, we estimate a typical baryonic halo gas mass accretion rate of , which, if unabiated and converted to stars until with an efficiency of 10%, would build sufficient stellar mass to reveal the extended host galaxy of the LRD at lower redshifts.
Acknowledgments
References
- Akins et al. (2025) Akins, H., Casey, C. M., Lambrides, E., et al. 2025, ApJ, submitted (arXiv:2406.10341)
- Arita et al. (2025) Arita, J., Onoue, M., Yoshioka, T., et al. 2025, MNRAS, 536, 3677
- Artymowics et al. (1993) Artymowics, P., Lin, D. N. C., Wampler, E. J. 1993, ApJ, 409, 592
- Baggen et al. (2024) Baggen, J. F. W., van Dokkum, P., Brammer, G., et al. 2024, ApJ, 977, L13
- Bekenstein (1973) Bekenstein, J. D. 1973, ApJ, 183, 657
- Bennert et al. (2006) Bennert, N., Jungwiert, B., Komossa, S., et al. 2006, A&A, 456, 953
- Berger (2010) Berger, E. 2010, ApJ, 722, 1946
- Bertin (2013) Bertin E. 2013, PSFEx: Point Spread Function Extractor, Astrophysics Source Code Library, record ascl:1301.001
- Bertin & Arnouts (1996) Bertin, E., & Arnouts, S. 1996, A&AS, 117, 393
- Bezanson et al. (2024) Bezanson, R., Labbé, I., Whitaker, K. E., et al. 2024, ApJ, 974, 92
- Bloom et al. (2002) Bloom, J. S., Kulkarni, S. R., Djorgovski, S. G. 2002, AJ, 123, 1111
- Bouwens et al. (2015) Bouwens, R. J., Illingworth, G. D., Oesch, P. A., et al. 2015, AJ, 803, 34
- Brammer et al. (2022) Brammer, G., Strait, V., Matharu, J., et al. 2022, grizli, 1.5.0, Zenodo
- Brammer et al. (2008) Brammer, G., van Dokkum, P. G., Coppi, P. 2008, ApJ, 686, 1503
- Byrne et al. (2022) Byrne, C. M., Stanway, E. R., Eldridge, J. J., et al. 2022, MNRAS, 512, 5329
- Calzetti et al. (2000) Calzetti, D., Armus, L., Bohlin, R. C., et al. 2000, ApJ, 533, 682
- Cameron et al. (2024) Cameron, A. J., Katz, H., Witten, C., et al., MNRAS, 534, 523
- Campanelli et al. (2007) Campanelli, M., Lousto, C., Zlochower, Y., et al. 2007, ApJ, 659, L5
- Ceverino et al. (2024) Ceverino, D., Nakazato, Y., Yoshida, N., Klessen, R., & Glover, R. 2024, A&A, 689, A244
- Chatzikos et al. (2023) Chatzikos, M., Bianchi, S., Camilloni, F., et al., 2023, RMxAA, 59, 327
- Chen et al. (2025) Chen, C.-H., Ho, L. C., & Li, R., 2025, ApJ, 983, 60
- Conroy et al. (2010) Conroy, C., & Gunn, J. E. 2010, ApJ, 712, 833
- D’Eugenio et al. (2025) D’Eugenio, F., Helton, J. M., Hainline, K., et al. 2025, MNRAS, submitted (arXiv:2503.15590)
- Dickey et al. (2016) Dickey, C. M., van Dokkum, P. G., Oesch, P. A., et al. 2016, ApJ, 828, L11
- Draine (2011) Draine, B. T. 2011, Physics of the Interstellar and Intergalactic Medium (Princeton, NJ: Princeton Univ. Press)
- Fakhouri et al. (2010) Fakhouri, O., Ma, C. P., & Boylan-Kolchin, M. 2010, MNRAS, 406, 2267
- Ferland et al. (1998) Ferland, G. J., Korista, K. T., Verner, D. A., et al., 1998, PASP, 110, 761
- Furtak et al. (2024) Furtak, L. J., Labbé, I., Zitrin, A., et al. 2024, Nature, 628, 57
- Gaia Collaboration et al. (2023) Gaia Collaboration, Vallenari, A., Brown, A. G. A., et al. 2023, A&A, 674, A1
- Greene & Ho (2005) Greene, J. E., & Ho, L. C. 2005, ApJ, 630, 122
- Greene et al. (2024) Greene, J. E., Labbé, I., Goulding, A. D., et al. 2024, ApJ, 964, 39
- Greene et al. (2020) Greene, J. E., Strader, J., & Ho, L. C. 2020, ARA&A, 58, 257
- Guia et al. (2024) Guia, C. A., Pacucci, F., Kocevski, D. D. 2024, RNAAS, 8, 207
- Hoffman & Loeb (2007) Hoffman, L., & Loeb, A. 2007, MNRAS, 377, 957
- Inayoshi (2025) Inayoshi, K. 2025, ApJ, submitted (arXiv:2503.05537)
- Inayoshi et al. (2022) Inayoshi, K., Harikane, Y., Inoue, A. K., Li, W., & Ho, L. C. 2022, ApJ, 938, L10
- Inayoshi & Ichikawa (2024) Inayoshi, K., & Ichikawa, K. 2024, ApJ, 973, L49
- Inayoshi & Maiolino (2025) Inayoshi, K., & Maiolino, R. 2025, ApJ, 980, L27
- Ji et al. (2025) Ji, X., Maiolino, R., Übler, H., et al. 2025, MNRAS, submitted (arXiv:2501.13082)
- Jiang et al. (2025) Jiang, F., Jia, Z., Zheng, H., et al. 2025, ApJ, submitted (arXiv:2503.23710)
- Kataria et al. (2025) Kataria, M., Saha, K., & Elmegreen, B. 2025, ApJ, in press (arXiv:2504.13664)
- Killi et al. (2024) Killi, M., Watson, D., Brammer, G., et al. 2024, A&A, 619, A52
- Kocevski et al. (2025) Kocevski, D. D., Finkelstein, S. L., Barro, G., et al. 2025, ApJ, in press (arXiv:2404.03576)
- Kocevski et al. (2023) Kocevski, D. D., Onoue, M., Inayoshi, K., et al. 2023, ApJ, 954, L4
- Kokorev et al. (2024) Kokorev, V., Caputi, K. I., Greene, J. E., et al. 2024, ApJ, 968, 38
- Koprowski et al. (2024) Koprowski, M. P., Wijesekera, J. V., Dunlop, J. S., et al. 2024, A&A, 691, A164
- Kormendy & Ho (2013) Kormendy, J., & Ho, L. C. 2013, ARA&A, 51, 511
- Kroupa (2001) Kroupa, P. 2001, MNRAS, 322, 231
- Labbé et al. (2025a) Labbé, I., Greene, J. E., Bezanson, et al. 2025a, ApJ, 978, 92
- Labbé et al. (2025b) Labbé, I., Greene, J. E., Matthee, J., et al. 2025b, ApJ, submitted (arXiv:2412.04557)
- Larson et al. (2023) Larson, R., L., Hutchison, T., A., Bagley, M., et al. 2023, ApJ, 958, 141
- Li et al. (2025) Li, Z., Inayoshi, K., Chen, K., et al. 2025, ApJ, 980, 36
- Llerena et al. (2024) Llerena, M., Amorín, R., Pentericci, L., et al. 2024, A&A, 691, A59
- Loveday et al. (2012) Loveday, J., Norberg, P., Baldry, I. L., et al. 2012, MNRAS, 420, 1239
- Ma et al. (2025) Ma, Y., Greene, J. E., Setton, D. J., et al. 2025, ApJ, submitted (arXiv:2504.08032)
- Madau & Haardt (2024) Madau, P., & Haardt, F. 2024, ApJ, 976, L24
- Maiolino et al. (2024) Maiolino, R., Scholtz, J., Curtis-Lake, E., et al. 2024, A&A, 691, A145
- Marchesini et al. (2012) Marchesini, D., Stefanon, M., Brammer, G. B., et al. 2012, AJ, 748, 126
- Matthee et al. (2024) Matthee, J., Naidu, R. P., Brammer, G., et al. 2024, ApJ, 963, 129
- Matthee et al. (2025) Matthee, J., Naidu, R. P., Kotiwale, G., et al. 2025, ApJ, submitted (arXiv:2412.02846)
- McQuinn (2016) McQuinn, M. 2016, ARA&A, 54, 313
- Meiksin (2006) Meiksin, A. 2006, MNRAS, 365, 807
- Morishita et al. (2024) Morishita, T., Stiavelli, M., Chary, R.-R., et al. 2024, ApJ, 963, 9
- Nagao et al. (2001) Nagao, T., Murayama, T., Taniguchi, Y. 2001, ApJ, 546, 744
- Naidu et al. (2025) Naidu, R. P., Matthee, J., Katz, H., et al. 2025, Nature, submitted (arXiv:2503.16596)
- Pacucci & Narayan (2024) Pacucci, F., & Narayan, R. 2024, ApJ, 976, 96
- Pérez-González et al. (2024) Pérez-González, P. G., Barro, G., Rieke, G. H., et al. 2024, ApJ, 968, 4
- Perrin et al. (2015) Perrin, M., D., Long, J., Sivaramakrishnan, A., et al. 2015, WebbPSF: James Webb Space Telescope PSF Simulation Tool, Astrophysics Source Code Library, record ascl:1504.007
- Planck Collaboration et al. (2020) Planck Collaboration, Aghanim, N., Akrami, Y., et al. 2020, A&A, 641, A6
- Rinaldi et al. (2025) Rinaldi, P., Bonaventura, N., Rieke, G. H., et al. 2025, ApJ, submitted (arXiv:2411.14383)
- Rusakov et al. (2025) Rusakov, V., Watson, D., Nikopoulos, G. P., et al. 2025, Nature, submitted (arXiv:2503.16595)
- Sérsic (1968) Sérsic, J. L. 1968, Atlas de Galaxias Australes (Córdoba: Obs. Astron., Univ. Nac. Córdoba)
- Setton et al. (2025) Setton, D. J., Greene, J. E., Spilker, J. S., et al. 2025, ApJ, submitted (arXiv:2503.02059)
- Simcoe et al. (2004) Simcoe, R. A., Sargent, W. L. W., & Rauch, M. 2004, ApJ, 606, 92
- Solimano et al. (2025) Solimano, M., González-López, J., & Aravena, M., A&A, 693, A70
- Storey & Zeippen (2020) Storey, P. J., & Zeippen, C. J. 2000, MNRAS, 312, 813
- Suess et al. (2024) Suess, K., Weaver, J. R., Price, S. H., et al. 2024, ApJ, 976, 101
- Tanaka et al. (2025) Tanaka, T., Silverman, J. D., Shimasaku, K., et al. 2025, ApJ, submitted (arXiv:2412.14246)
- Taylor et al. (2025) Taylor, A. J., Finkelstein, S. L., Kocevski, D. D., et al. 2025, ApJ, submitted (arXiv:2409.06772)
- Tie et al. (2024) Tie, S. S., Hennawi, J. F., Wang, F., et al. 2024, MNRAS, 535, 223
- van der Wel et al. (2011) van der Wel, A., Straughn, A. N., Rix, H.-W., et al. 2011, ApJ, 742, 111
- Wang et al. (1998) Wang, J., Heckman, T. M., & Lehnert, M. D. 1998, ApJ, 509, 93
- Wang et al. (2025) Wang, B., de Graaff, A., Davies, R. L., et al. 2025, ApJ, in press (arXiv:2403.02304)
- Wang et al. (2024) Wang, B., Leja, J., De Graaff, A., et al. 2024, ApJ, 969, L13
- Williams et al. (2024) Williams, C. C., Alberts, S., Ji, Z., et al. 2024, ApJ, 968, 34
- Wu et al. (2022) Wu, Z., Ho, L. C., Zhuang, M. Y. 2022, ApJ, 941, 95
- Zhang et al. (2025) Zhang, C., Wu, Q., Fan, X., et al. 2025, Nature Astronomy, submitted
Appendix A Image Fitting Results
The fitting results for MSA13821, MSA41225, and MSA45924 are shown in Figures A1, A2, and A3, respectively.
Appendix B Photometric Redshift Fitting Results
We give the results for photometric redshift fitting with EAzY in Figure B1. The best-fit templates, probability distribution of the redshift solutions before and after multiplying the overlapping probability are both given in each panels for all the sources. Detailed procedures are described in Section 4.1.