The role of spatial averaging in the precision of gene expression patterns
Abstract
During embryonic development, differentiating cells respond via gene expression to positional cues from morphogen gradients. While gene expression is often highly erratic, embryonic development is precise. We show by theory and simulations that diffusion of the expressed protein can enhance the precision of its expression domain. While diffusion lessens the sharpness of the expression boundary, it also reduces super-Poissonian noise by washing out bursts of gene expression. Balancing these effects yields an optimal diffusion constant maximizing the precision of the expression domain.
Embryonic development is driven by orderly, spatial patterns of gene expression that assign each cell in the embryo its particular fate. Experiments in recent years have vividly demonstrated that gene expression is often highly stochastic Elowitz et al. (2002). Yet, embryonic development is exceedingly precise. A vivid example is the Bicoid-Hunchback system in the early Drosophila embryo, which has become a paradigm for understanding the formation of spatial gene-expression patterns. Shortly after fertilization, the morphogen protein Bicoid (Bcd) forms an exponential concentration gradient along the anterior-posterior axis of the embryo, which provides positional information to the differentiating nuclei. One of the target genes of Bcd is hunchback (hb), which is expressed in the anterior half of the embryo. The posterior boundary of the hb expression domain is very sharp: by cell cycle 13, the position of the boundary varies only by about one nuclear spacing Houchmandzadeh et al. (2002); Gregor et al. (2007a); He et al. (2008). This precision is higher than the best achievable precision for a time-averaging based read-out mechanism of the Bcd gradient Gregor et al. (2007a). Intriguingly, the study of Gregor et al. revealed that the Hb concentrations in neighboring nuclei exhibit spatial correlations and the authors suggest that this implies a form of spatial averaging enhancing the precision of the posterior Hb boundary Gregor et al. (2007a). However, the mechanism for spatial averaging remained unclear.
In this manuscript, we analytically and numerically study the Bcd-Hb system. Our analysis reveals a simple, yet powerful mechanism for spatial averaging, which is based on the diffusion of Hb itself. We show analytically that Hb diffusion between neighboring nuclei reduces the super-Poissonian part of the noise in its concentration, with a factor which depends on the diffusion length of Hb and the dimensionality of the system. In essence, diffusion reduces the noise by washing out bursts in gene expression. This mechanism is generic, and applies not only to any developmental system, but also to any biochemical network in general. For example, if a signaling protein is activated at one end of the cell and then has to diffuse to another place to activate another system, e.g. the messenger in bacterial chemotaxis, then our results show that the non-Poissonian noise in the activation of the signaling protein is washed out by diffusion; for this reason it may be beneficial to spatially separate the in- and output of a signaling pathway. Our analysis also reveals that while Hb diffusion reduces the noise, it also lessens the steepness of its expression boundary Gregor et al. (2007a). The interplay between these two antagonistic effects leads to an optimal diffusion constant of that maximizes the precision of the hb expression domain.
We consider a minimal model of the Bcd-Hb system, which contains the necessary ingredients for understanding the mechanism of spatial averaging. This model includes the stochastic and cooperative activation of Hb by Bcd in each nucleus, and the diffusion of Hb between neighboring nuclei. To model the cooperative binding of Bcd to the hb promoter, we assume that Bcd proteins can bind sequentially to five binding sites on the hb promoter. When all five sites are occupied, the promoter is active (activity ) and Hb proteins are produced stochastically with rate ; otherwise the promoter is inactive (activity ). Hb proteins are degraded stochastically with rate . To obtain a lower bound on the precision of the hb expression domain, we assume that Bcd binds to the promoter with a diffusion limited on-rate where is the dimension of a binding site, the diameter of a nucleus and the Bcd diffusion constant Gregor et al. (2007b). Since the on-rate is assumed to be diffusion-limited, cooperativity of Hb activation is tuned via the Bcd off-rate which decreases with increasing number of promoter-bound Bcd. Using and the average promoter activity as function of the number of Bcd molecules in the nucleus approximately follows the Hill-function
| (1) |
with and . The Hill-coefficient was inferred from the relation between Hb and Bcd concentration, and the activation threshold , where , is the average number of Bcd molecules, , in a nucleus at the Hb domain boundary Gregor et al. (2007a).
To describe the formation of the spatial Hb pattern, we place nuclei on a square lattice with spacing Gregor et al. (2007a). Hb diffuses over the lattice with diffusion constant . With reflecting boundary conditions in one and periodic in the other direction, our model is a cylinder which is symmetric around the anterior-posterior -axis. Differential activation of Hb is induced by the Bcd profile
| (2) |
which decreases exponentially with the distance from the anterior pole at . The decay length is Gregor et al. (2007a) and the threshold position for Hb activation is set to ; is the length of the embryo. Diffusion of Bcd between nuclei induces fluctuations in the Bcd copy number on the time-scale . Because is much smaller than the time-scale for promoter binding, , Bcd copy number fluctuations are efficiently averaged out by slow binding of Bcd to the promoter. We therefore assume that the total number of Bcd in a nucleus is constant and given by Eq. (2). The state of the system is described by the number of promoter bound Bcd and the number of Hb in every nucleus. The state changes by reactions inside a nucleus and diffusion of Hb between nuclei. The dynamics is described by a reaction-diffusion master equation which we solve numerically Elf and Ehrenberg (2004).
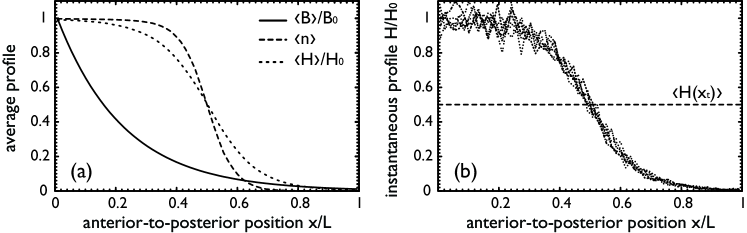
Fig. 1a shows simulation results for the average number of free Bcd molecules, , the average promoter activity, , and the average number of Hb molecules, , as function of the position . Without Hb diffusion is proportional to . For a finite Hb diffusion constant, however, the shape of the Hb profile is determined not only by , but also by the diffusion length of Hb, —with increasing the profile becomes less steep. Fig. 1b shows instantaneous Hb profiles at different times. Fluctuations of promoter activity induce large fluctuations of . These in turn lead to an uncertainty in the position at which crosses the threshold .
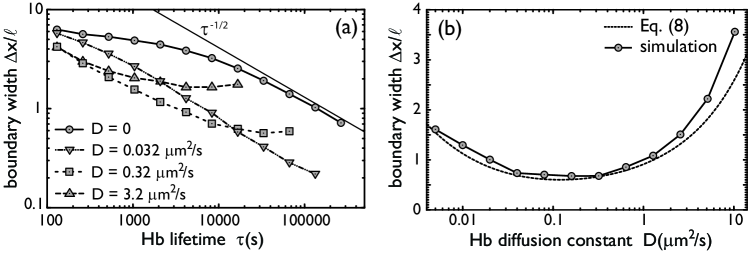
We now consider the Hb boundary width when the Hb diffusion constant is zero. Fig. 2a shows that this decreases with increasing lifetime of the Hb protein. To understand this behavior, we note that the boundary width is, to a good approximation, given by
| (3) |
where is the standard deviation of the Hb copy number and is the magnitude of the Hb gradient at the boundary position Tostevin et al. (2007); Gregor et al. (2007a). When the Hb lifetime is much longer than the time-scale of the promoter state fluctuations, then the noise in Hb copy number becomes Poissonian and the variance is given by the mean: . On the other hand, the steepness of the boundary, , increases linearly with when and the synthesis rate is kept constant. Eq. (3) thus predicts that the boundary width decreases as for large , which is indeed observed in the simulations (see Fig. 2a). Hence, the hb expression boundary could be made arbitrarily precise if the lifetime of the Hb protein could be increased indefinitely.
In practice the averaging time cannot be made arbitrarily long Gregor et al. (2007a). Ultimately, it is limited by the nuclear division time , which at cell cycle 13 is roughly 30 minutes. Fig. 2a shows that for and vanishing Hb diffusion constant , the boundary width would be nuclei, which is larger than the precision measured experimentally Gregor et al. (2007a). The limited averaging time thus puts strong constraints on the precision that can be achieved via the mechanism of time-averaging alone.
Fig. 2a reveals, however, that the precision of the hb expression domain can be enhanced significantly by increasing the Hb diffusion constant to a finite value. This may seem surprising, since the steepness of the boundary, , decreases with increasing Hb diffusion constant (Fig. 1) and this—as Eq. (3) shows—tends to increase the boundary width. However, increasing the Hb diffusion constant also reduces the noise in the Hb copy number. This is the mechanism of spatial averaging, which we now study analytically.
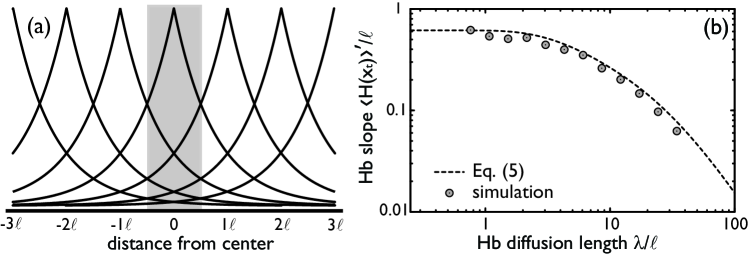
To elucidate the mechanism of spatial averaging, we first analyze how the steepness of the Hb boundary, , depends on the Hb diffusion length , and then how the noise in the Hb copy number at the boundary, , depends on (see Eq. (3)). To calculate the Hb profile, we note that a nucleus at a position produces Hb with an average rate (Fig. 3a). In one dimension, the steady state number of Hb molecules in a nucleus of size at is approximately
| (4) |
The total Hb profile is the sum of over all point sources . To do the sum, we approximate the activity from Eqs. (1) and (2) by a piecewise linear function which behaves as around the boundary for and which is unity below and zero above the boundary. The slope is the derivative of at . At the boundary the slope of is
| (5) |
It increases linearly with the number of Hb molecules and decreases as the Hb diffusion length increases. Due to the rotational symmetry, the slope in the full, two-dimensional system is also given by Eq. (5). Fig. 3b plots Eq. (5) as function of and compares the approximation with two-dimensional simulation results. It is seen that the agreement is very good.
Next, we study the effect of Hb diffusion on the variance in the Hb copy number, (see Eq. (3)). For clarity, we first do the calculations for one-dimensional diffusion and extend our approximation to general dimensions afterwards. To compute , we exploit the observation made above that each nucleus acts as a point source of Hb (Fig. 3a), and that the expression of Hb in each nucleus is an independent stochastic process. We denote the variance of the Hb copy number in a nucleus of size at a distance from the point source as . In a uniform space, the total Hb variance in a nucleus is the sum over point sources at all . To calculate , we assume that the Hb dynamics is fast on the time-scale of promoter switching, such that the Hb concentration switches between zero and , with given by Eq. (4). In this limit,
| (6) |
where the second term is due to promoter switching with variance , and the first term describes the Poisson noise coming from the production, diffusion and decay of Hb when the promoter is active.
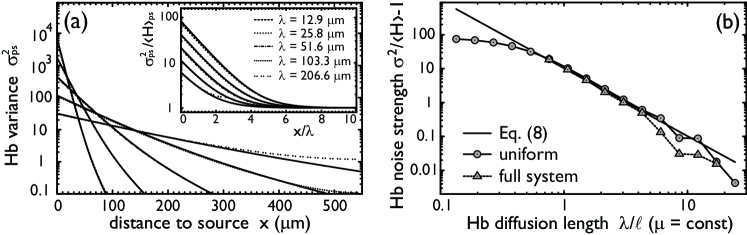
Fig. 4a shows for different values of the diffusion length . For small , is large for small , but reduces quickly with increasing . Hence, the variance at a given nucleus is determined by few nuclei in the immediate neighborhood but each individual contribution is large. For increasing the number of nuclei contributing to the variance increases, but the individual contributions of nearby nuclei are smaller; this is because diffusion washes out the bursts of Hb production at the source. To see which of the two opposing effects dominates, we sum Eq. (6) over to obtain the total variance:
| (7) |
Compared to the variance in an isolated nucleus, the overall effect of diffusion in a one-dimensional, uniform space is a reduction of the non-Poissonian noise by . The Poissonian part cannot be reduced because diffusion itself is Poissonian. Indeed, spatial averaging can reduce the effect of noise in gene expression, but only if this is super-Poissonian. Simulations also allow us to compute for slower Hb dynamics. In this case, the non-Poissonian part of the variance is smaller. However, the qualitative dependence of remains the same: the non-Poissonian part is washed out by diffusion over a distance proportional to (inset Fig. 4a).
The finite range of non-Poissonian fluctuations implies the following simple model. nuclei contribute equally to a well-stirred reservoir containing Hb molecules, with average and variance , where is the noise of in a nucleus if there was no Hb diffusion. Each nucleus then samples Hb molecules in a binomial fashion from this reservoir. The noise in each nucleus is formally given by , where denotes the expectation and the variance of . The first term describes the noise in the sampling process, and is given by . The second term describes the variance in due to fluctuations in the reservoir, and is given by . Hence,
| (8) |
This simple expression elucidates that it is the super-Poissonian part of the noise, , which is reduced by spatial averaging. Since scales with the dimensionality as , this reduction becomes more efficient in higher dimensions. Interestingly, this expression also reveals that if hb expression would be sub-Poissonian Pedraza and Paulsson (2008), diffusion would increase the noise.
Fig. 4b shows the non-Poissonian part of the variance in a uniform, two-dimensional system as function of the diffusion length; the exact, numerical result is compared to the prediction of Eq. (8) with chosen to be the number of nuclei within a distance of a given nucleus along the edges of a square lattice, . For sufficiently large for which , the approximation is excellent. Fig. 4b also compares the results for the uniform system to those of the full, non-uniform system in which a Bcd gradient activates Hb. Clearly, the well-stirred approximation describes the variance at the Hb boundary very well; only for is the variance at the boundary significantly influenced by nuclei far away from the boundary with smaller variance.
Finally, we can combine Eqs. (5) and (8) with Eq. (3) to predict the boundary width . Fig. 2b shows that the prediction agrees very well with the simulations. This figure also shows that the two antagonistic effects of Hb diffusion—reducing the slope but also the variance of the Hb concentration—lead to a diffusion constant that optimizes the boundary width for a fixed Hb lifetime. Interestingly, this minimal width is less than one nuclear spacing, as found experimentally Gregor et al. (2007a). This suggests that for achieving the necessary precision, mechanisms based on multiple gradients or interactions between multiple Bcd targets are not required, although these may provide robustness against embryo-to-embryo variations Howard and ten Wolde (2005); Manu et al. (2009a, b). Since the exact mechanism for Hb transport is unknown, it is tempting to speculate that the precision achieved via spatial averaging could be increased further by separating the two effects of Hb diffusion using an anisotropic transport of Hb: slow transport along the anterior-posterior axis would allow for steep spatial profiles, while fast diffusion along the perpendicular direction would allow for effective spatial averaging. The benefit of anisotropic transport could imply the existence of active mechanisms for Hb transport.
Spatial averaging can only be beneficial when the noise in Hb production has a super-Poissonian component. The observation of spatial correlations in Hb by Gregor et al. indicates that this is the case Gregor et al. (2007a). The question arises whether bursts in gene expression are inevitable and spatial averaging a prerequisite for achieving a precise hb expression domain. The Hb lifetime is limited by the nuclear division time, while the time-scale for promoter state fluctuations is limited by the diffusion of Bcd. The magnitude of the bursts could be reduced by reducing the promoter strength, but this would lower the Hb copy number and hence the steepness of the Hb boundary; the net result would, in fact, be a decrease of its precision. In a model with explicit hb mRNA, the effect of promoter state fluctuations could be alleviated by reducing the transcription rate. However, to achieve a sufficiently steep and precise Hb boundary with a low number of hb mRNA, the translation rate had to be increased such that Hb production becomes super-Poissonian again. It thus appears that spatial averaging is a fundamental mechanism for generating precise patterns of gene expression. Clearly, it will be of interest to study how other modes of transport, e.g. sub-diffusion or active transport, affect the mechanism of spatial averaging.
We thank Filipe Tostevin for a critical reading of the manuscript. This work is supported by FOM/NWO (TE, PRtW) and The Royal Society (MH).
References
- Elowitz et al. (2002) M. B. Elowitz, A. J. Levine, E. D. Siggia, and P. S. Swain, Science 297, 1183 (2002).
- Houchmandzadeh et al. (2002) B. Houchmandzadeh, E. Wieschaus, and S. Leibler, Nature 415, 798 (2002).
- Gregor et al. (2007a) T. Gregor, D. W. Tank, E. F. Wieschaus, and W. Bialek, Cell 130, 153 (2007a).
- He et al. (2008) F. He, Y. Wen, J. Deng, X. Lin, L. J. Lu, R. Jiao, and J. Ma, Developmental Cell 15, 558 (2008).
- Gregor et al. (2007b) T. Gregor, E. F. Wieschaus, A. P. McGregor, W. Bialek, and D. W. Tank, Cell 130, 141 (2007b).
- Elf and Ehrenberg (2004) J. Elf and M. Ehrenberg, Systems Biology 1, 230 (2004).
- Tostevin et al. (2007) F. Tostevin, P. R. ten Wolde, and M. Howard, PLoS Computational Biology 3, 763 (2007).
- Pedraza and Paulsson (2008) J. M. Pedraza and J. Paulsson, Science 319, 339 (2008).
- Howard and ten Wolde (2005) M. Howard and P. R. ten Wolde, Physical Review Letters 95, 208103 (2005).
- Manu et al. (2009a) Manu, S. Surkova, A. V. Spirov, V. V. Gursky, H. Janssens, A.-R. Kim, O. Radulescu, C. E. Vanario-Alonso, D. H. Sharp, M. Samsonova, et al., PLoS Biology 7, e1000049 (2009a).
- Manu et al. (2009b) Manu, S. Surkova, A. V. Spirov, V. V. Gursky, H. Janssens, A.-R. Kim, O. Radulescu, C. E. Vanario-Alonso, D. H. Sharp, M. Samsonova, et al., PLoS Computational Biology 5, e1000303 (2009b).