The SAMI Galaxy Survey:
Towards a unified dynamical scaling relation for galaxies of all types
Abstract
We take advantage of the first data from the Sydney-AAO Multi-object Integral field (SAMI) Galaxy Survey to investigate the relation between the kinematics of gas and stars, and stellar mass in a comprehensive sample of nearby galaxies. We find that all 235 objects in our sample, regardless of their morphology, lie on a tight relation linking stellar mass () to internal velocity quantified by the parameter, which combines the contribution of both dispersion () and rotational velocity () to the dynamical support of a galaxy (). Our results are independent of the baryonic component from which and are estimated, as the of stars and gas agree remarkably well. This represents a significant improvement compared to the canonical vs. and vs. relations. Not only is no sample pruning necessary, but also stellar and gas kinematics can be used simultaneously, as the effect of asymmetric drift is taken into account once and are combined. Our findings illustrate how the combination of dispersion and rotational velocities for both gas and stars can provide us with a single dynamical scaling relation valid for galaxies of all morphologies across at least the stellar mass range 8.511. Such relation appears to be more general and at least as tight as any other dynamical scaling relation, representing a unique tool for investigating the link between galaxy kinematics and baryonic content, and a less biased comparison with theoretical models.
Subject headings:
galaxies: evolution — galaxies: fundamental parameters — galaxies: kinematics and dynamics1. Introduction
It is well established that the internal velocity of disk (Tully & Fisher 1977) and spheroidal galaxies (Faber & Jackson 1976) scales with their luminosity, stellar and baryonic mass (McGaugh et al. 2000). In addition to being important secondary distance indicators, the Tully-Fisher and Faber-Jackson relations provide strong constraints on galaxy formation and evolution (e.g., Baugh 2006).
Unfortunately, both relations hold only for accurately pre-selected classes of objects (e.g., inclined disks and bulge-dominated systems, respectively), and their scatters and slopes vary when wider ranges of morphologies are considered (e.g., Neistein et al. 1999; Iodice et al. 2003; Williams et al. 2010; Catinella et al. 2012; Tonini et al. 2014). This limitation has hampered the comparison with theoretical models, as it is challenging to apply the same selection criteria used for observations to simulated data.
Thus, recent works have started investigating the possibility of bringing galaxies of all morphologies onto the same dynamical scaling relation. Kassin et al. (2007) showed that, once the contributions of rotation () and dispersion () of the H-emitting gas are combined into the parameter (, Weiner et al. 2006), all star-forming galaxies (including merging systems) lie on a tight (0.1 dex scatter) stellar mass () vs. relation. Although it is still debated whether the combination of and is necessary to reduce the scatter in the Tully-Fisher relation of late-type galaxies (including disturbed systems, Miller et al. 2011), it is intriguing that the slope and intercept of the vs. relation found by Kassin et al. (2007) is close to that of the Faber-Jackson relation, suggesting that a similar approach might hold also for quiescent systems.
Zaritsky et al. (2008) addressed this issue by using the parameter to show that ellipticals and disk galaxies lie on the same scaling relation. However, contrary to Kassin et al. (2007) who directly combined and , they simply used rotational velocities for disks and integrated dispersion velocities for bulges. As in massive systems both rotation and dispersion contribute significantly to the dynamical support (Courteau et al. 2007; Emsellem et al. 2011), these assumptions cannot be generalised to the entire population of galaxies.
Catinella et al. (2012) were recently able to bring all massive ( M⊙) galaxies on a tight relation by using the galaxy’s concentration index to correct the stellar velocity dispersion of disk-dominated systems. This empirical approach is motivated by the observed dependence of the ratio on morphology (Courteau et al. 2007), suggesting that the parameter may indeed be applied to all types of galaxies.
In this Letter, we combine gas and stellar kinematics for 235 galaxies observed as part of the Sydney-AAO Multi-object Integral field (SAMI, Croom et al. 2012) Galaxy Survey (Bryant et al. 2014b) to show that all galaxies lie on the same vs. relation. The major advantage of our approach lies in the measurement of dispersion and rotational velocities, from both stellar and gas components, from spatially resolved maps.
2. The SAMI Galaxy Survey
The SAMI Galaxy Survey is targeting 3400 galaxies in the redshift range 0.0040.095 with the SAMI integral field unit, installed at the Anglo-Australian Telescope. Details on the target selection can be found in Bryant et al. (2014b).
SAMI takes advantage of photonic imaging bundles (‘hexabundles’, Bland-Hawthorn et al. 2011; Bryant et al. 2014a) to simultaneously observe 12 galaxies across a 1 degree field of view. Each hexabundle is composed of 61 optical fibers, each with a diameter of 1.6″, covering a total circular field of view of 14.7″ in diameter. SAMI fibers are fed into the AAOmega dual-beam spectrograph, providing a coverage of the 3700-5700 Å and 6250-7350 Å wavelength ranges at resolutions R1750 and R4500, respectively. These correspond to a full-width at half-maximum (FWHM) of 170 km s-1 in the blue, and 65 km s-1 in the red.
2.1. Observations and data reduction
We focus on the first 304 galaxies observed by SAMI in the footprint of the Galaxy And Mass Assembly Survey (GAMA, Driver et al. 2011) for the wealth of multiwavelength data available (see § 2.3).
Observations were carried out on March 5-17 and April 12-16, 2013. The typical observing strategy consists of seven dithered observations totalling 3.5 hours to achieve near-uniform spatial coverage across each hexabundle. The AAOmega data reduction pipeline 2dfdr was used to perform all the standard data reduction steps. Flux calibration was done taking advantage of a spectro-photometric standard star observed during the same night, while correction for telluric absorption was made using simultaneous observations of a secondary standard star (included in the same SAMI plate of the target). The row-stacked spectra of each exposure generated by 2dfdr were then combined, reconstructed into an image and resampled on a Cartesian grid of 0.5″0.5″spaxel size (see Sharp et al. 2014 and Allen et al. 2014 for more details).
2.2. Stellar and gas kinematics
To obtain homogenous global rotation and dispersion velocities for both gas and stars within one effective radius (), we select the 250 galaxies in our sample with an -band effective diameter (see § 2.3) smaller than the size of a SAMI hexabundle (14.7″), and greater than the typical spatial resolution of our observations (2.5″, i.e., 2.1 kpc at the average redshift of our sample, see also Allen et al. 2014). The average diameter of our sample is 8″.
Stellar line-of-sight velocity and intrinsic dispersion maps were then obtained using the penalised pixel-fitting routine ppxf, developed by Cappellari & Emsellem (2004), following the same pixel-by-pixel technique described in Fogarty et al. (2014).
Gas velocity maps were created from the reduced data cubes using the new lzifu IDL fitting routine (Ho et al. in prep.; see also Ho et al. 2014). After subtracting the stellar continuum with ppxf, lzifu models the emission lines in each spaxel as Gaussians and performs a non-linear least-square fit using the Levenberg-Marquardt method. We fit up to 11 strong optical emission lines ([Oii]3726,29, H, [Oiii]4959,5007, [Oi]6300, [Nii]6548,83, H, and [Sii]6716,31) simultaneously, constraining all the lines to share the same rotation velocity and dispersion. Each line is modelled as a single-component Gaussian (including the effect of instrumental resolution; e.g., Weiner et al. 2006), and we use the reconstructed kinematic maps to measure gas rotation and intrinsic velocity dispersion.
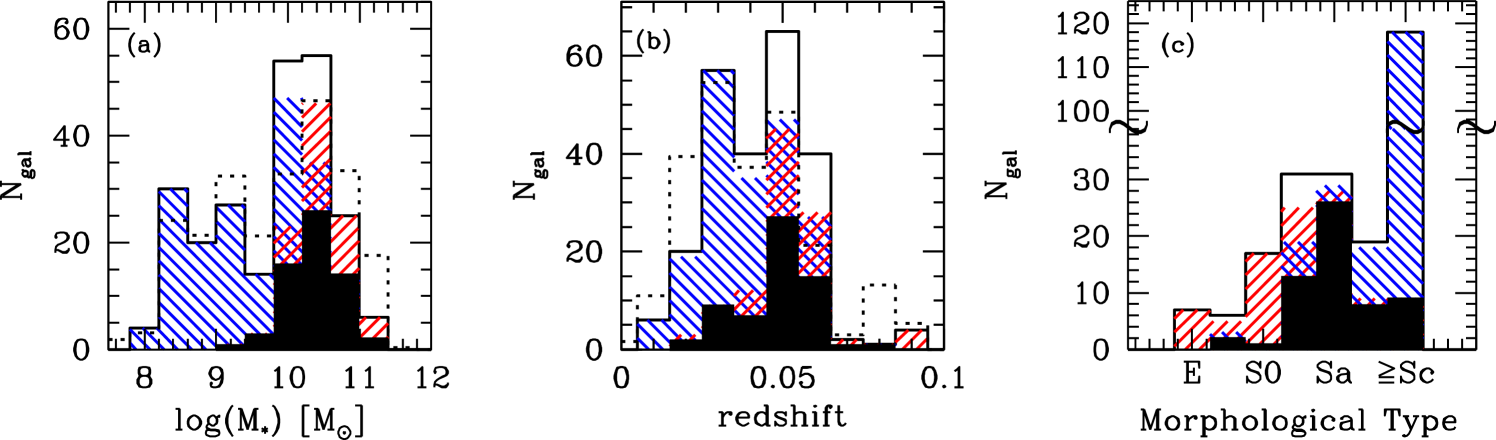
We then select our final sample as follows. First, spaxels are discarded if the fit failed or if the error on the velocities is greater than 20 km s-1 and 50 km s-1 for gas and stars, respectively. This conservative cut roughly corresponds to one third of spectral FWHM in SAMI cubes. Second, we estimate the fraction of ‘good’ spaxels () left within an ellipse of semi-major axis and ellipticity and position angle determined from optical -band Sloan Digital Sky Survey (SDSS, York et al. 2000) images (see § 2.3), and reject those galaxies with 80%. This selection guarantees that we are properly tracing the galaxy kinematics up to , and it leaves us with 235 individual galaxies: 193 with gas kinematics, 105 with stellar kinematics and 62 with both (see Fig. 1). Although our analysis takes advantage of less than 10% of the final SAMI Galaxy Survey, the sample size is already comparable to the largest IFU surveys of nearby galaxies to date (Cappellari et al. 2011; Sánchez et al. 2012). The properties of our final sample are summarised in Fig. 1.
Stellar and gas velocity widths () are obtained from the velocity histogram created by combining all the ‘good’ spaxels within . Following the standard technique used for H rotation curves, we define as the difference between the 90th and 10th percentile points of the velocity histogram (, Catinella et al. 2005). We adopt the velocity histogram technique because this is the simplest method to determine velocity widths, making our results easily comparable to other studies, including long-slit spectroscopy. Rotational velocities are then computed as
| (1) |
where is the galaxy inclination and is the redshift. Inclinations are determined from the -band minor-to-major axis ratio () as:
| (2) |
where is the intrinsic axial ratio of an edge-on galaxy. Following Catinella et al. (2012), we adopt =0.2 for all galaxies and set to inclination of 90 degrees if 0.2. Our conclusions are unchanged if we vary with morphology. The average of our sample is 0.5.
Stellar and gas velocity dispersions are defined as the linear average of the velocity dispersion measured in each ‘good’ spaxel (without any correction for inclination). We preferred linear to luminosity-weighted averages to be consistent with our velocity width measurements (which are not luminosity-weighted) and because these are less affected by beam smearing (Davies et al. 2011). Our conclusions, however, are unchanged if we use luminosity-weighted quantities. Excluding the effect of inclination, we assume an uncertainty of 0.1 dex in the estimate of both and .
We combine dispersion and rotation through the parameter:
| (3) |
As discussed in Weiner et al. (2006) and Kassin et al. (2007), this quantity includes the dynamical support from both ordered and disordered motions and, thus, should be a better proxy for the global velocity of the galactic halo. Moreover, it is almost unaffected by beam smearing, as the artificial increase of and decrease of compensate each other once they are combined into (Covington et al. 2010).
2.3. Ancillary data
The SAMI data are combined with multiwavelength observations obtained as part of the GAMA survey. Briefly, -band effective radii, position angles and ellipticities are taken from the one-component Sersic fits presented in Kelvin et al. (2012)111We re-computed the ellipticity and position angle for seven galaxies with bright bars or other issues (GAMA 250277, 279818, 296685, 383259, 419632, 536625, 618152) as the published values do not match the orientation of the velocity field.. Stellar masses () are estimated from colours and -band magnitudes following Taylor et al. (2011, see also ).
Visual morphological classification has been performed on the SDSS colour images, following the scheme used by Kelvin et al. (2014). Galaxies are first divided into late- and early-types according to their shape, presence of spiral arms and/or signs of star formation. Then, early-types with just a bulge are classified as ellipticals (E), whereas those with disks as S0s. Similarly, late-type galaxies with a bulge component are Sa-Sb, whereas bulge-less late-type galaxies are Sc or later.
3. Dynamical scaling relations
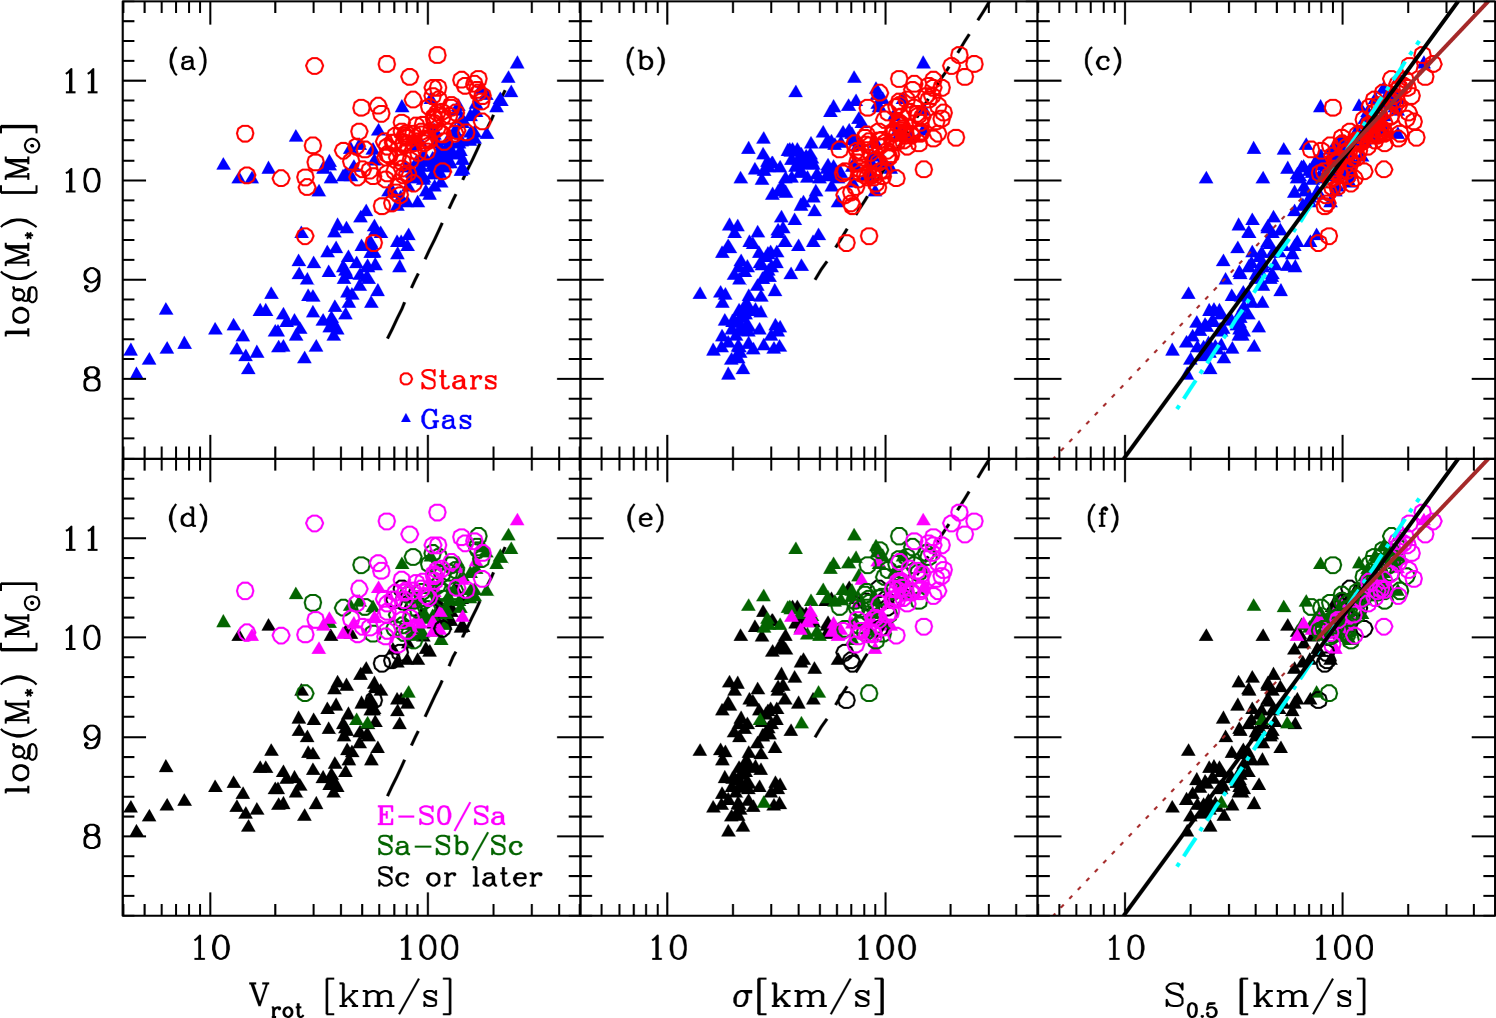
Fig. 2 shows vs. (left panel), (middle) and (right) for all 235 galaxies in our sample. Circles and triangles indicate galaxies with kinematical parameters from stellar and gas components, respectively. Thus, the 62 galaxies for which both gas and stellar kinematics are available appear twice in each plot. In the bottom row, galaxies are colour-coded according to their morphology.
3.1. The stellar mass Tully-Fisher relation
Our vs. relation has a larger scatter (0.26 dex in from the inverse fit)222All scatters in this paper are estimated from the inverse linear fit along the x-axis: i.e., we consider as independent variable. than classical Tully-Fisher relation (0.08 dex). This is not surprising as our sample includes early-types and face-on systems that would normally be excluded from Tully-Fisher studies (e.g., Catinella et al. 2012). Indeed, a significant fraction of the scatter is due to spirals with bulges, and early types (see Fig. 2d).
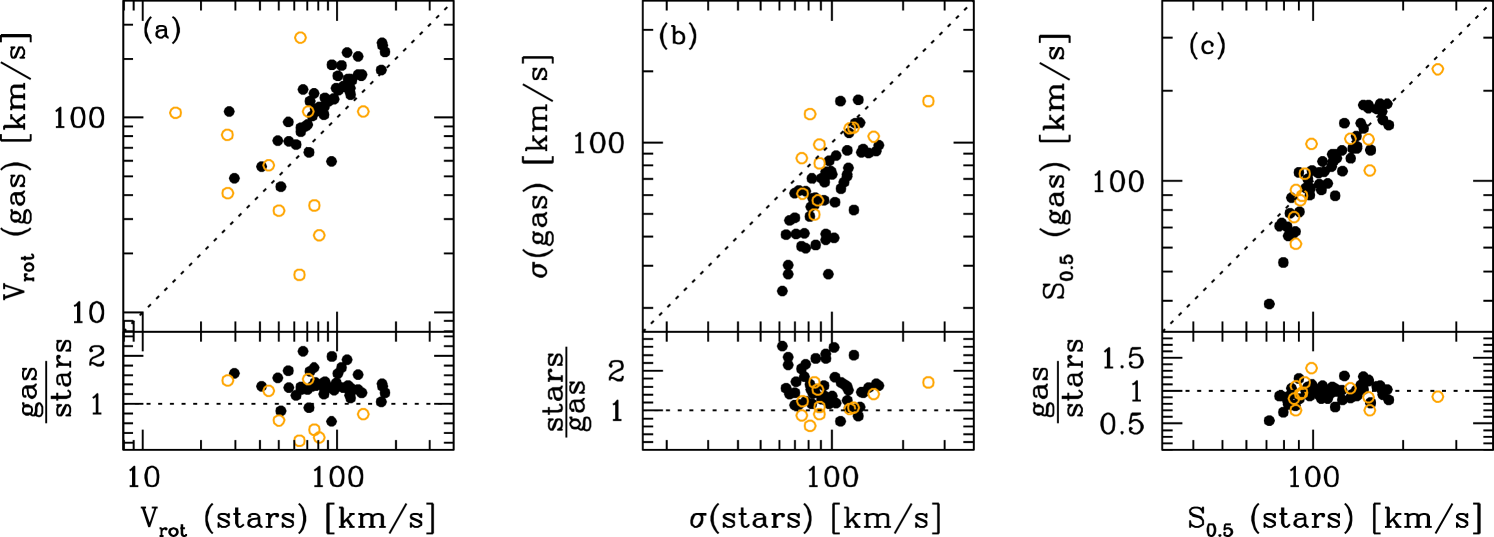
The vs. relation for the stars (circles) is significantly offset from the one of the gas (triangles): i.e., at fixed , stars rotate slower than gas. This is clearer in Fig. 3a, where we compare of gas and stars for the 62 galaxies with both measurements available. Once galaxies with clear misalignments between gas and stellar rotation axis are excluded (empty circles), we find that (gas) is, on average, 0.14 dex (with standard deviation 0.11 dex) higher than (stars). This is a consequence of asymmetric drift: while gas and stars experience the same galactic potential, a larger part of the stellar dynamical support comes from dispersion. The average ratio (stars)/(gas) is 0.75 (0.20), roughly 20% lower than the value obtained by Martinsson et al. (2013) by comparing the maximum rotational velocities of pure disk galaxies ((stars)/(gas)0.89). This is likely due to the fact that our sample is mainly composed by early-type spirals (see Fig. 1c) and that we probe only the central parts of galaxies, where asymmetric drift is more prominent.
For comparison, in Fig. 2a,d, we show the local stellar mass Tully-Fisher relation
(Bell & de Jong 2001)333Stellar masses have been converted to a Chabrier Initial Mass Function following Gallazzi et al. (2008)..
Our relation is flatter, showing a good match only at high .
This is because our rotational velocities are measured within .
As the rotation curves of giant galaxies rise more quickly than in dwarfs (Catinella et al. 2006),
our are close to the maximum rotational velocity only in massive systems (see
also Fig. 2 in Yegorova & Salucci 2007).
3.2. The stellar mass Faber-Jackson relation
As for the vs. relation, the scatter of our vs. relation is larger (0.16 dex) than the one typically obtained for early-type galaxies only (0.07 dex, Gallazzi et al. 2006). As Catinella et al. (2012), we find that the offset from the vs. (stars) relation for early-type galaxies (Gallazzi et al. 2006; dashed line) correlates with the concentration index. This confirms that, at fixed , disks are more rotationally supported than bulge-dominated systems.
The scaling relations of stars and gas are offset, with (gas) on average 0.19 dex (0.13 dex) lower than (stars) (Fig. 3b; see also Ho 2009). In addition, the vs. relation for the gas is not linear, as galaxies with M1010 M⊙ have roughly the same velocity dispersion (30 km s-1), i.e., the typical value observed in pure disk galaxies (Epinat et al. 2008).
3.3. The vs. relation
The large scatter and the difference between stars and gas observed for the vs. and vs. relations disappear when and are combined in the parameter (see Fig. 2c,f). All morphological types follow the same scaling relation with just a few outliers. An inverse linear fit (assuming as dependent variable) gives a scatter of 0.1 dex (solid line in Fig. 2c,f)444Note that galaxies with both (gas) and (stars) do not contribute twice to the fit, as for these we use the average between the two values.. The slope and intercept of the linear relation (0.330.01, 1.410.08) are similar to what is found by Kassin et al. (2007) for star-forming galaxies at 0.1 (dotted-dashed line). This is interesting, as they used maximum rotational velocities, instead of velocities within .
The remarkable agreement between the for gas and stars is shown in Fig. 3c: the average logarithmic difference (gas-stars) is just 0.02 dex ( 0.07dex), even including disturbed galaxies. This is expected if both quantities trace the potential of the galaxy, and justifies their combination on the same scaling relation. The agreement between gas and stars is little affected by the value of used to combine and . Indeed, the average logarithmic difference varies between 0.06 and +0.03 dex for 0.31, and stays roughly the same. Fig. 3 confirms that the reduced scatter in the vs. relation is simply due to the fact that the combination of and provides a better proxy for the kinetic energy of a galaxy, which correlates with its mass.
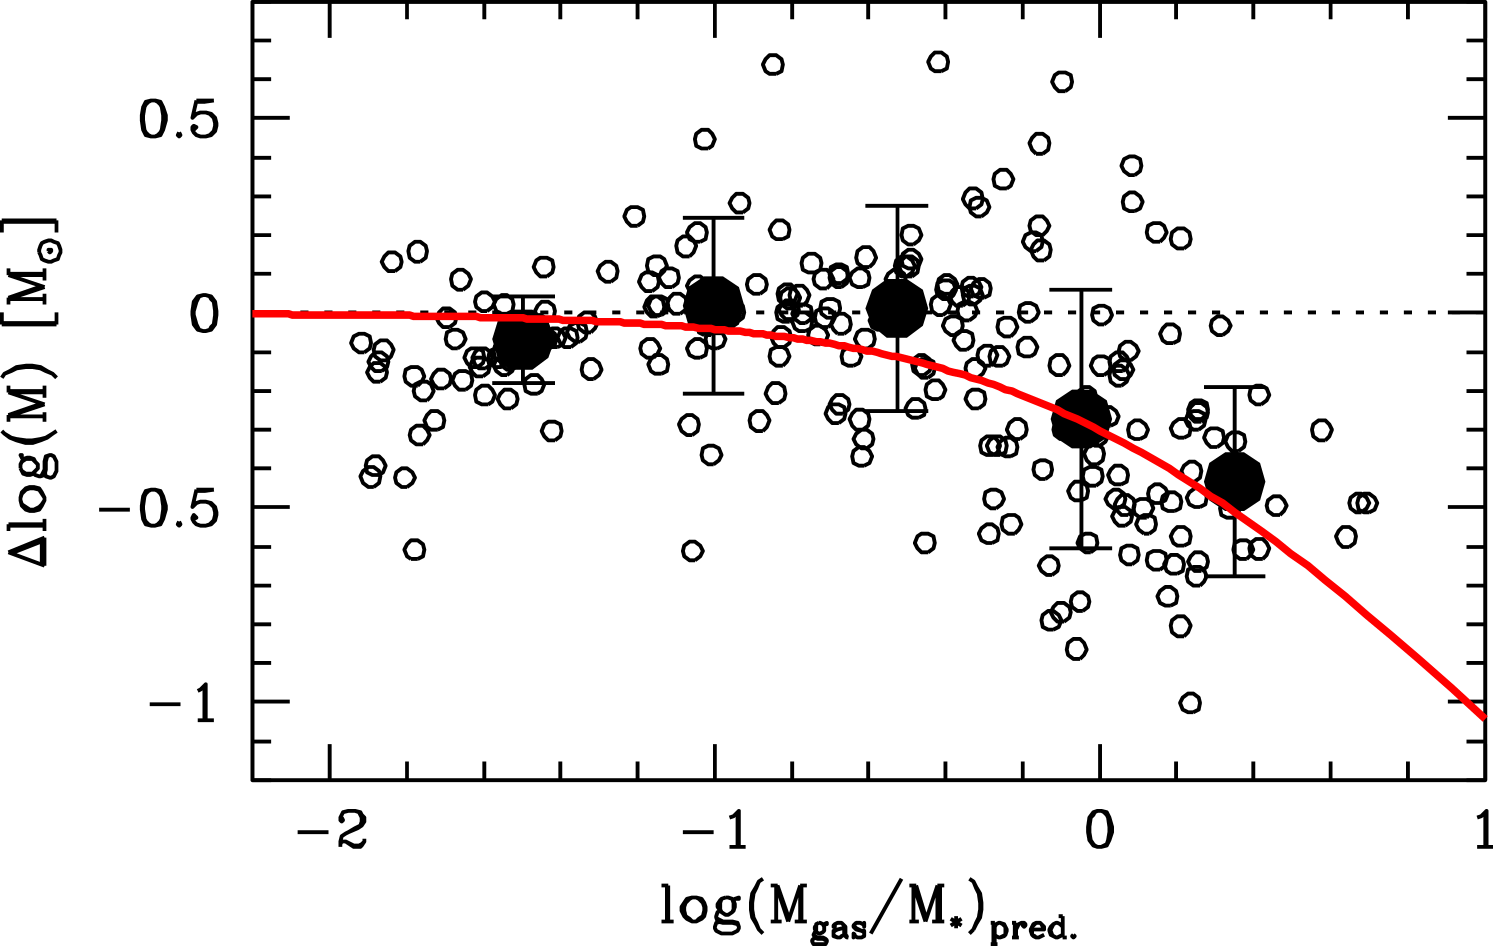
Finally, we note that the vs. relation may become steeper for M1010 M⊙. If we only fit massive galaxies (solid brown line in Fig. 2c,f, with its extrapolation indicated as dotted line), low-mass systems appear systematically below the relation. This non linearity likely reflects the one observed in the vs. relation, but it is tempting to speculate whether this is also somehow related to the similar feature observed in the stellar mass Tully-Fisher relation (McGaugh et al. 2000), which disappears in its baryonic version, once the mass of cold gas is taken into account. Unfortunately, the absence of cold gas measurements makes it impossible to compute a baryonic relation. Thus, we conclude by simply noting that, if we use the ultraviolet and optical properties of our systems to predict their total gas content555Atomic hydrogen masses are estimated following Cortese et al. (2011). Total gas fractions are then obtained assuming a molecular-to-atomic gas ratio of 0.3 (Boselli et al. 2014) and a helium contribution of 30%., the residuals from the linear fit vary with gas fraction (Fig. 4) roughly as expected if the correlates linearly with total baryonic mass (red line in Fig. 4). However, given all the assumptions and uncertainties, the idea that a linear baryonic relation might be the physical relation linking galaxies of all types remains for now a speculation.
4. Conclusions
We take advantage of the first large statistical sample observed by the SAMI Galaxy Survey to show that all galaxies, regardless of their morphology, follow a tight (0.1 dex) dynamical scaling relation once their dynamical support is expressed by combining the contributions of both rotational and dispersion velocities. We highlight that, while the stellar and gas components show systematic differences in their rotational and dispersion velocities, their agree remarkably well. This justifies the simultaneous use of both gas and stellar kinematical indicators, allowing us to bring both star-forming and quiescent systems on the same physical relation.
Our analysis improves on Kassin et al. (2007) by showing that quiescent objects follow the same vs. relation as star-forming systems. To our knowledge, this is the first time that gas and stellar and for galaxies of all morphologies are combined on one dynamical scaling relation. This is a significant step forward compared to Zaritsky et al. (2008), confirming that the parameter can be applied to all types of galaxies.
The parameter works remarkably well not only because it combines the contributions of both and to the dynamical support of galaxies, but also because it is influenced only weakly by instrumental effects (Covington et al. 2010).
It is important to remember that, as already known for the Tully-Fisher and Faber-Jackson relations, the slope and scatter of the vs. relation likely depend on the technique used to estimate and , as well as on the radius at which both quantities are measured. We plan to investigate this further with the full SAMI sample, as determining the best combination of and should reveal important information on the kinematical structure of galaxies.
In the meantime, the absence of any pre-selection in the sample not only makes the parameter extremely promising for characterising the dynamical properties of galaxies, but also might allow a more rigorous comparison with theoretical models.
References
- Allen et al. (2014) Allen, J. T., Croom, S. M., Baldry, I. K., et al. 2014, MNRAS, in press (arXiv:1407.6068)
- Baugh (2006) Baugh, C. M. 2006, Reports on Progress in Physics, 69, 3101
- Bell & de Jong (2001) Bell, E. F. & de Jong, R. S. 2001, ApJ, 550, 212
- Bland-Hawthorn et al. (2011) Bland-Hawthorn, J., Bryant, J., Robertson, G., et al. 2011, Optics Express, 19, 2649
- Boselli et al. (2014) Boselli, A., Cortese, L., Boquien, M., et al. 2014, A&A, 564, A66
- Bryant et al. (2014a) Bryant, J. J., Bland-Hawthorn, J., Fogarty, L. M. R., Lawrence, J. S., & Croom, S. M. 2014a, MNRAS, 438, 869
- Bryant et al. (2014b) Bryant, J. J., Owers, M., Robotham, A., et al. 2014b, MNRAS, submitted (arXiv:1407.7335)
- Cappellari & Emsellem (2004) Cappellari, M. & Emsellem, E. 2004, PASP, 116, 138
- Cappellari et al. (2011) Cappellari, M., Emsellem, E., Krajnović, D., et al. 2011, MNRAS, 413, 813
- Catinella et al. (2006) Catinella, B., Giovanelli, R., & Haynes, M. P. 2006, ApJ, 640, 751
- Catinella et al. (2005) Catinella, B., Haynes, M. P., & Giovanelli, R. 2005, AJ, 130, 1037
- Catinella et al. (2012) Catinella, B., Kauffmann, G., Schiminovich, D., et al. 2012, MNRAS, 420, 1959
- Cortese et al. (2011) Cortese, L., Catinella, B., Boissier, S., Boselli, A., & Heinis, S. 2011, MNRAS, 415, 1797
- Courteau et al. (2007) Courteau, S., McDonald, M., Widrow, L. M., & Holtzman, J. 2007, ApJ, 655, L21
- Covington et al. (2010) Covington, M. D., Kassin, S. A., Dutton, A. A., et al. 2010, ApJ, 710, 279
- Croom et al. (2012) Croom, S. M., Lawrence, J. S., Bland-Hawthorn, J., et al. 2012, MNRAS, 421, 872
- Davies et al. (2011) Davies, R., Förster Schreiber, N. M., Cresci, G., et al. 2011, ApJ, 741, 69
- Driver et al. (2011) Driver, S. P., Hill, D. T., Kelvin, L. S., et al. 2011, MNRAS, 413, 971
- Emsellem et al. (2011) Emsellem, E., Cappellari, M., Krajnović, D., et al. 2011, MNRAS, 414, 888
- Epinat et al. (2008) Epinat, B., Amram, P., Marcelin, M., et al. 2008, MNRAS, 388, 500
- Faber & Jackson (1976) Faber, S. M. & Jackson, R. E. 1976, ApJ, 204, 668
- Fogarty et al. (2014) Fogarty, L. M. R., Scott, N., Owers, M. S., et al. 2014, MNRAS, 443, 485
- Gallazzi et al. (2008) Gallazzi, A., Brinchmann, J., Charlot, S., & White, S. D. M. 2008, MNRAS, 383, 1439
- Gallazzi et al. (2006) Gallazzi, A., Charlot, S., Brinchmann, J., & White, S. D. M. 2006, MNRAS, 370, 1106
- Ho et al. (2014) Ho, I., Kewley, L. J., Dopita, M. A., et al. 2014, MNRAS, 444, 3894
- Ho (2009) Ho, L. C. 2009, ApJ, 699, 638
- Iodice et al. (2003) Iodice, E., Arnaboldi, M., Bournaud, F., et al. 2003, ApJ, 585, 730
- Kassin et al. (2007) Kassin, S. A., Weiner, B. J., Faber, S. M., et al. 2007, ApJ, 660, L35
- Kelvin et al. (2014) Kelvin, L. S., Driver, S. P., Robotham, A. S. G., et al. 2014, MNRAS, 439, 1245
- Kelvin et al. (2012) Kelvin, L. S., Driver, S. P., Robotham, A. S. G., et al. 2012, MNRAS, 421, 1007
- Martinsson et al. (2013) Martinsson, T. P. K., Verheijen, M. A. W., Westfall, K. B., et al. 2013, A&A, 557, A130
- McGaugh et al. (2000) McGaugh, S. S., Schombert, J. M., Bothun, G. D., & de Blok, W. J. G. 2000, ApJ, 533, L99
- Miller et al. (2011) Miller, S. H., Bundy, K., Sullivan, M., Ellis, R. S., & Treu, T. 2011, ApJ, 741, 115
- Neistein et al. (1999) Neistein, E., Maoz, D., Rix, H.-W., & Tonry, J. L. 1999, AJ, 117, 2666
- Sánchez et al. (2012) Sánchez, S. F., Kennicutt, R. C., Gil de Paz, A., et al. 2012, A&A, 538, A8
- Sharp et al. (2014) Sharp, R., Allen, J. T., Fogarty, L. M. R., et al. 2014, MNRAS, in press (arXiv:1407.5237)
- Taylor et al. (2011) Taylor, E. N., Hopkins, A. M., Baldry, I. K., et al. 2011, MNRAS, 418, 1587
- Tonini et al. (2014) Tonini, C., Jones, D. H., Mould, J., et al. 2014, MNRAS, 438, 3332
- Tully & Fisher (1977) Tully, R. B. & Fisher, J. R. 1977, A&A, 54, 661
- Weiner et al. (2006) Weiner, B. J., Willmer, C. N. A., Faber, S. M., et al. 2006, ApJ, 653, 1027
- Williams et al. (2010) Williams, M. J., Bureau, M., & Cappellari, M. 2010, MNRAS, 409, 1330
- Yegorova & Salucci (2007) Yegorova, I. A. & Salucci, P. 2007, MNRAS, 377, 507
- York et al. (2000) York, D. G., Adelman, J., Anderson, Jr., J. E., et al. 2000, AJ, 120, 1579
- Zaritsky et al. (2008) Zaritsky, D., Zabludoff, A. I., & Gonzalez, A. H. 2008, ApJ, 682, 68