The small region in Drell-Yan production at next-to-leading order with the Parton Branching Method
Abstract
The Parton Branching (PB) method describes the evolution of transverse momentum dependent (TMD) parton distributions, covering all kinematic regions from small to large transverse momenta . The small -region is very sensitive both to the contribution of the intrinsic motion of partons (intrinsic ) and to the resummation of soft gluons taken into account by the PB TMD evolution equations. We study the role of soft-gluon emissions in TMD as well as integrated parton distributions.
We perform a detailed investigation of the PB TMD methodology at next-to-leading order (NLO) in Drell-Yan (DY) production for low transverse momenta. We present the extraction of the nonperturbative “intrinsic- ” distribution from recent measurements of DY transverse momentum distributions at the LHC across a wide range in DY masses, including a detailed treatment of statistical, correlated and uncorrelated uncertainties. We comment on the (in)dependence of intrinsic transverse momentum on DY mass and center-of-mass energy, and on the comparison with other approaches.
DESY-23-209
August 2, 2025
1 Introduction
The measurement of the vector boson transverse momentum, , in Drell-Yan (DY) production [1] allows one to investigate in detail many different aspects of the strong interaction sector of the Standard Model, and their impact on precision electroweak measurements. The very low region of the DY cross section is sensitive to the contribution from the nonperturbative transverse motion of partons inside the hadrons; additionally at low transverse momentum multiple soft gluon emissions have to be resummed; at larger transverse momenta perturbative higher-order contributions become dominant. The precise description of the boson transverse momentum distribution has been investigated since the 1980’s, and approaches like CSS [2] analytic resummation and parton-shower [3, 4, 5, 6] numerical algorithms have been applied with different success.
In this work we explore the approach [7, 8] to DY spectra based on the parton branching (PB) TMD methodology in momentum space proposed in [9, 10], and we perform a detailed analysis of the small- region for wide ranges in center of mass energies and in DY masses. Though fitted only on deep-inelastic scattering (DIS) data from HERA experiments, the PB-TMD methodology has been shown to be capable of describing DY spectra at LHC energies [7] and at low energies [8] without any need for adjustment of parameters. This approach takes into account simultaneously soft gluon radiations and the transverse momentum recoils in the parton branchings along the QCD cascade. It provides a successful natural treatment of the multiple-scale problem of the DY transverse momentum for transverse momenta much smaller than DY masses but also of the DY with hard jet production [11]. It also confirms the universality of the TMDs being able to describe both DIS and DY cross sections at all available center of mass energies [12]. Alternative approaches based on parton showers in standard Monte Carlo event generators like Pythia8 [3] can also describe multi-differential DY cross section but it has been observed that they require intrinsic transverse momentum distributions strongly dependent on [13, 14]. In order to describe the measurements at LHC energies, a Gaussian width exceeding the Fermi motion kinematics is needed. Approaches based on CSS [15] provide very precise analytic predictions for inclusive enough observables like the Drell-Yan cross section transverse momentum. In this paper we study in detail the low behavior of the PB-TMD parton distributions where both very soft gluon emission and intrinsic- contribute significantly and interplay. The results presented here provide a multi-scale economical and coherent approach demonstrating the sensitivity to nonperturbative TMD contributions and first steps in disentangling the intrinsic- contribution from the nonperturbative Sudakov one [16]. We compare DY theoretical predictions with experimental measurements in wide ranges in center-of-mass energies, and in DY masses, , to extract the intrinsic- parameter from the transverse momentum distributions. We are carefully taking into account systematic and statistical uncertainties using the breakdown of experimental uncertainties provided by the full set of covariance matrices available in the recent Drell-Yan differential cross section measurement at 13 TeV [17] and we treat for the first time the scale uncertainties in the theoretical predictions as correlated uncertainties within a given mass bin.
The results for TMD parameters such as intrinsic- obtained from the DY analysis in this paper can be compared with analogous results obtained from TMD fits in the CSS coordinate-space framework, see e.g. the recent studies [18, 19]. A significant difference between these approaches and the approach of this paper concerns the treatment of collinear parton distribution functions (PDFs). As shown in Refs. [7, 8], in the approach of this paper the inclusive DGLAP limit is recovered and fits of collinear distributions are made, e.g. from inclusive DIS structure functions, along with TMD distributions [20, 21, 22]. In contrast, CSS approaches do not recover inclusive DGLAP and rather use an ansatz based on the operator product expansion of TMD distributions in terms of collinear PDFs, assuming collinear PDFs to be given by standard PDF sets. The PDF bias effect [19] which results from this has been shown to influence significantly the central values of the extracted distributions and dominate the systematic uncertainties in all the existing TMD determinations based on CSS approaches. The possibility to treat collinear and TMD distributions on the same footing and determine them without having to rely on existing PDF fits is a distinctive feature of the PB TMD approach. We believe that in the long run this could bring significant advantages in pursuing TMD phenomenology.
On the other hand, the results of this paper for intrinsic- can also be compared with the case of parton shower Monte Carlo event generators, such as Pythia [3] and Herwig [4]. Monte Carlo tuning to experimental data shows that parton shower approaches require intrinsic- distributions dependent on the center-of-mass energy [14, 13], and a Gaussian width exceeding the Fermi motion kinematics. In contrast, in the approach of this paper we find that the width of the intrinsic- distribution has a much milder center-of-mass energy dependence. We obtain more natural Gaussian width , , with close to 1 GeV resulting from fits to DY measurements from fixed-target to LHC energies. We propose in this paper that the different behavior, concerning intrinsic- distributions, between PB TMD and parton-shower approaches can be ascribed to the different treatment of the contributions to parton evolution from the nonperturbative Sudakov region, near the soft-gluon resolution boundary. See also [23] for a discussion of this and comparison of PB TMD and parton-shower results.
The paper is organized as follows. In Sec. 2 we briefly recall the basic elements of the calculational framework [9, 10, 7, 23, 21, 22]: we start with the PB TMD approach; next we give a few comments on the treatment of the small transverse momentum region in this approach; then we discuss the Monte Carlo computation of DY differential distributions. Sec. 3 is the central section of the paper, in which we perform fits to DY data and present results for the intrinsic- TMD parameter. We give conclusions in Sec. 4.
2 PB TMDs and DY production
To study the different contributions to the low- spectrum, at different and different , we calculate DY production cross section in the PB TMD method, which proceeds as described in Refs. [23, 7]. NLO hard-scattering matrix elements are obtained from the MadGraph5_aMC@NLO [24] at next-to-leading (NLO) event generator and matched with TMD parton distributions and showers obtained from PB evolution [20, 9, 10], using the subtractive matching procedure proposed in [7] and further analyzed in [25].
We will show that the application of PB TMD distributions leads to a non negligible contribution of pure intrinsic-, even if most of the small- contribution comes from the PB-evolution. We also show that the proper treatment of photon radiation from the DY decay leptons is rather important, especially in the DY mass region below the boson peak. The contribution of intrinsic- of heavy flavor partons is found to be negligible over the whole range since heavy quarks are not present in the initial configuration of the proton.
2.1 TMD distributions from the PB method
The PB evolution equations for TMD parton distributions of flavor are given by [9]
| (1) | |||||
where and are 2-dimensional momentum vectors, is the soft resolution scale [10], is the longitudinal momentum transferred at the branching, are the resolvable splitting functions***Using transverse momentum dependent splitting functions as described in Ref.[26] would require using off-shell matrix elements and a completely new fit to inclusive structure functions. (whose explicit expressions for all flavor channels are given in [9]), and are the Sudakov form factors
| (2) |
The branching evolution (1) fulfills soft-gluon angular ordering [27, 28, 29], with the branching variable being related to the transverse momentum of the parton emitted at the branching by
| (3) |
It is shown in [10] that angular ordering is essential for the TMD distribution arising from the solution of Eq. (1) to be well-defined and independent of the choice of the soft-gluon resolution scale for . In contrast, ordering leads, for instance, to ambiguities in the definition of the TMD from the region.
Analogously to the case of ordinary (collinear) parton distribution functions, the distribution at the starting scale of the evolution, in the first term on the right hand side of Eq. (1), is a nonperturbative boundary condition to the evolution equation, and is to be determined from experimental data. For simplicity we parameterize in the form
| (4) |
with the width of the Gaussian distribution given by , independent of parton flavor and , where is the intrinsic- parameter.
The scale at which the strong coupling is to be evaluated in Eqs. (1) and (2) is a function of the branching variables. Two scenarios are studied in Refs. [20, 9]:
| (5) |
In scenario i), it is shown in [9] that Eq. (1), in the collinear case, i.e. once it is integrated over all transverse momenta, reproduces exactly the DGLAP evolution [30, 31, 32, 33] of parton densities. In scenario ii), it is discussed in [34] how, upon integration over transverse momenta and suitable treatment of the resolution scale, Eq. (1) returns the CMW coherent branching evolution [29].
In Ref. [20],
fits to precision DIS HERA measurements [35]
based on Eqs. (1) and (4), combined with NLO DIS matrix elements, are
performed for both scenarios i) and ii),
using the fitting platform xFitter [36, 37].
It is found that fits to DIS measurements with good
values can be achieved in either case. Correspondingly, PB-NLO-HERAI+II-2018 set 1 (abbreviated as PB-NLO-2018 Set1)
(with the DGLAP-type )
and PB-NLO-HERAI+II-2018 set2 (abbreviated as PB-NLO-2018 Set2) (with the angular-ordered CMW-type
) are obtained, both
having intrinsic- parameter in Eq. (4) set to 0.5 GeV [20]. All PB TMD parton distributions (and many others) are accessible in TMDlib and via the graphical
interface TMDplotter [38, 39].
On the other hand, it is found that PB-NLO-2018 Set2 provides a much better description, compared to PB-NLO-2018 Set1, of measured transverse momentum spectra at the LHC [7], in low-energy experiments [23], and of di-jet azimuthal correlations near the back-to-back region at the LHC [40]. This underlines the relevance of the angular-ordered coupling in regions dominated by soft-gluon emissions.
Based on this observation, in the following we will focus on the PB-NLO-2018 Set2 approach and perform fits to DY transverse momentum measurements to investigate the sensitivity of these measurements to the nonperturbative TMD intrinsic- parameter , and perform determinations of its value.
As discussed in [20, 7], in order to complete the definition of the PB-NLO-2018 Set2 scenario the treatment of the coupling needs to be specified in the region of small transverse momenta , where is a semi-hard scale on the order of a GeV. As in [20, 7], we take
| (6) |
setting 1 GeV, which may be regarded as similar in spirit to the “pre-confinement” proposal in the context of infrared-sensitive QCD processes [41, 42] †††Different forms of the extension to small could be considered. However, this will entail new fits both to precision DIS data and to DY data.. In the present study, we will perform a determination of the nonperturbative TMD parameter from DY transverse spectra by assuming the above behavior for .
To better illustrate the underlying physical picture, we give next a few further comments on nonperturbative contributions and the treatment of the small transverse momentum region in the PB TMD approach.
As implied by Eqs. (1) and (2), the PB TMD method incorporates Sudakov evolution via phase space integrations of appropriate kernels over the resolvable region, i.e. over momentum transfers up to the soft-gluon resolution scale . For each branching evolution scale , it is instructive to examine separately parton emissions with transverse momenta above the semi-hard scale , , and below , . Using the angular ordering relation (3), these emissions are mapped respectively on the regions
| (7) |
where is the dynamical resolution scale associated with the angular ordering [27, 28, 29, 34]. In region , the strong coupling (6) is evaluated at the scale of the emitted transverse momentum, ; the contribution from region to the evolution in Eqs. (1), (2) corresponds to the perturbative Sudakov resummation (see e.g. [43, 44]). In region , the strong coupling (6) freezes around the semi-hard scale ; the contribution from region to the evolution is the nonperturbative Sudakov form factor in the PB TMD approach.
It is worth noting that the PB-NLO-2018 Set 2 framework provides a very natural and economical description of nonperturbative Sudakov effects, based on perturbative modeling of the Sudakov form factor (2) combined with the infrared behavior (6): it does not contain any additional nonperturbative functions and parameters, besides the scale .
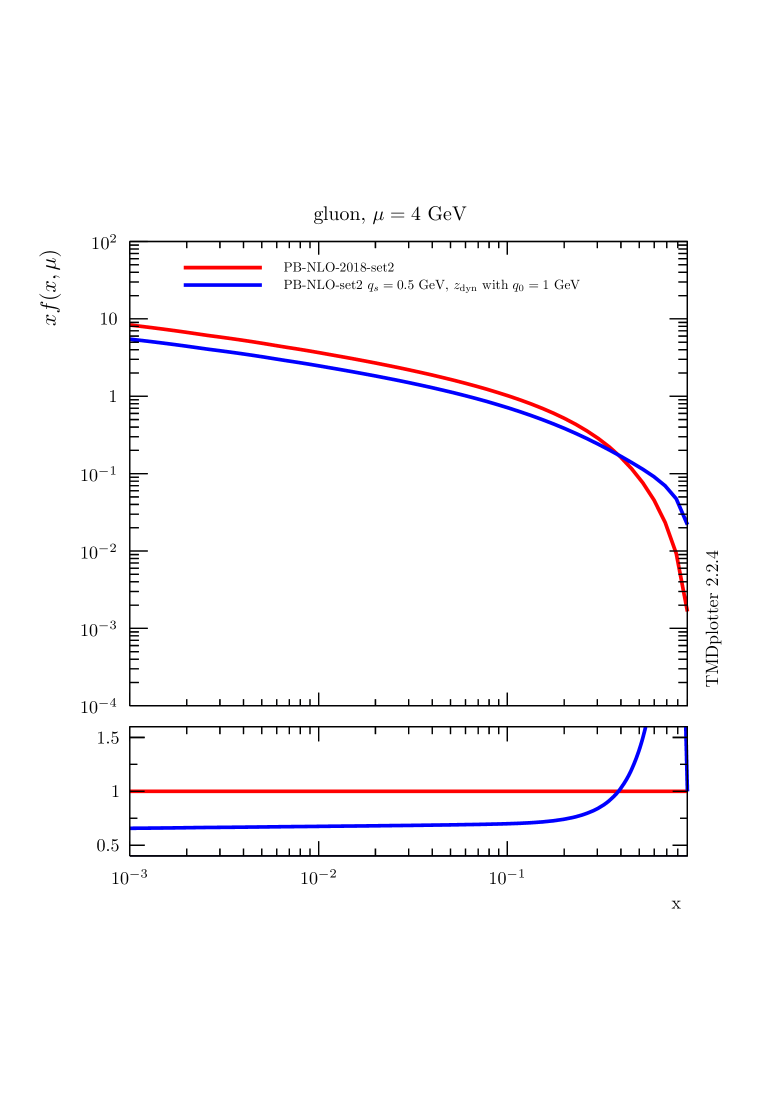
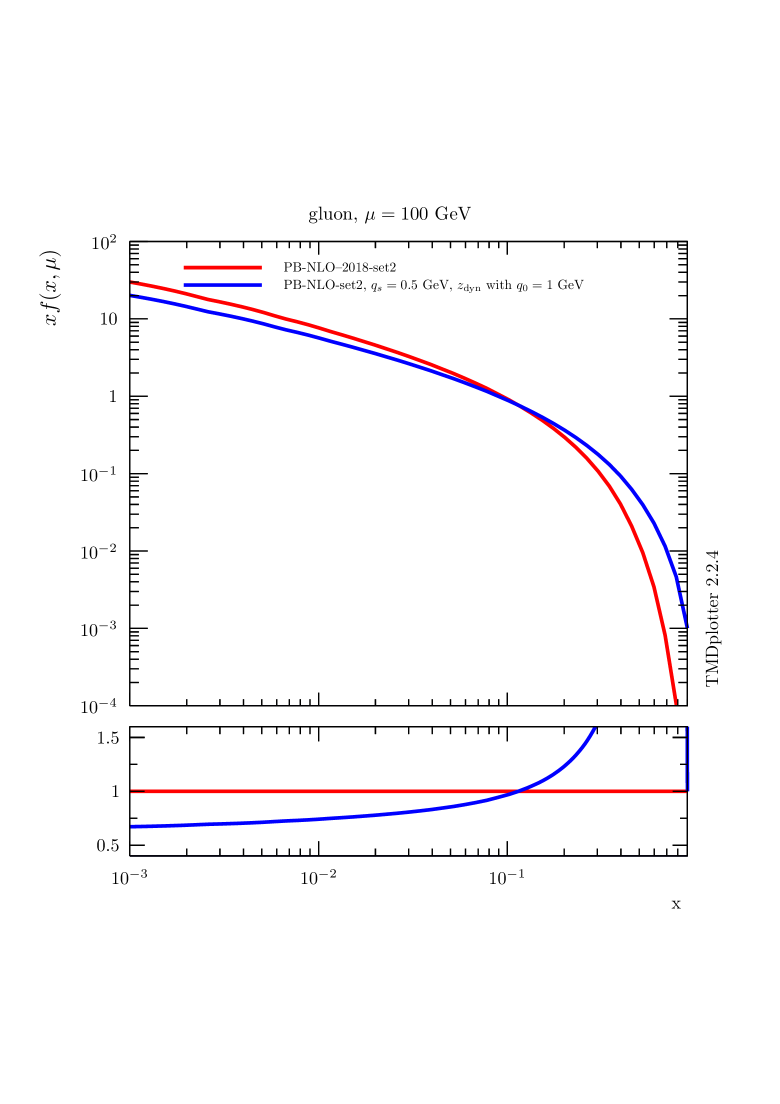
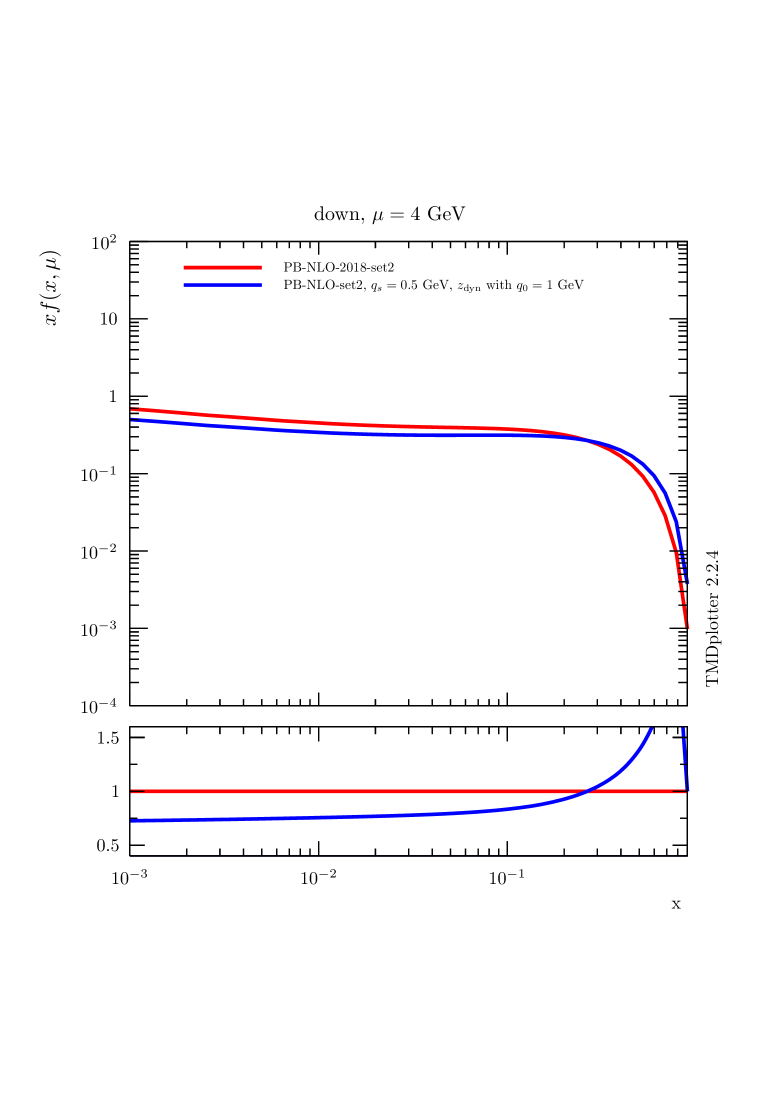
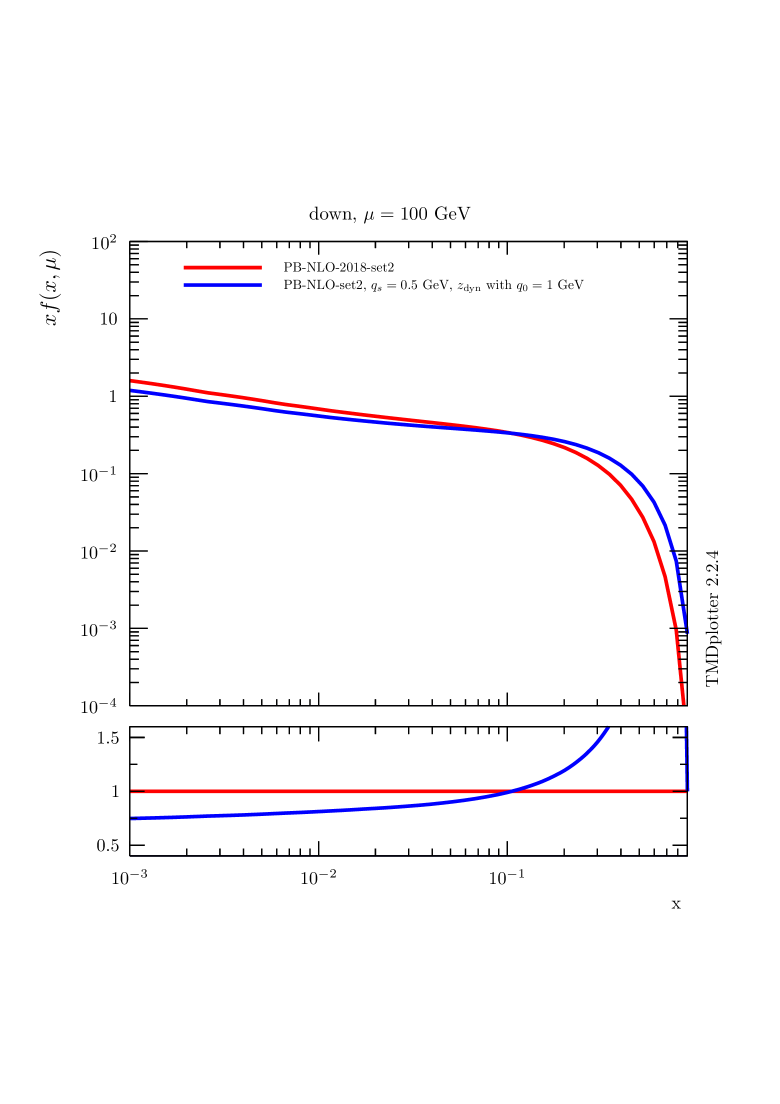
In Fig. 1 we show parton distributions obtained with the PB approach using the starting distributions from PB-NLO-2018 Set2. We show distributions for the gluon and down quark parton densities for different values of : (default - regions - red curve [20]) and (region only - blue curve obtained with the same parameters as PB-NLO-2018 Set2 except using updfevolv [45]). The distributions obtained from PB-NLO-2018 set2 with are significantly different from those applying , illustrating the importance of soft contributions even for collinear distributions. In Ref. [46] it was found that limiting the -integration leads to inconsistencies. In Ref. [47] a procedure to correct the limitation is discussed. A detailed discussion on the role of soft gluons and the nonperturbative Sudakov form factor is given in Ref. [48]. Please note that the intrinsic- distribution, since not part of the collinear calculation, does not affect the collinear parton densities.
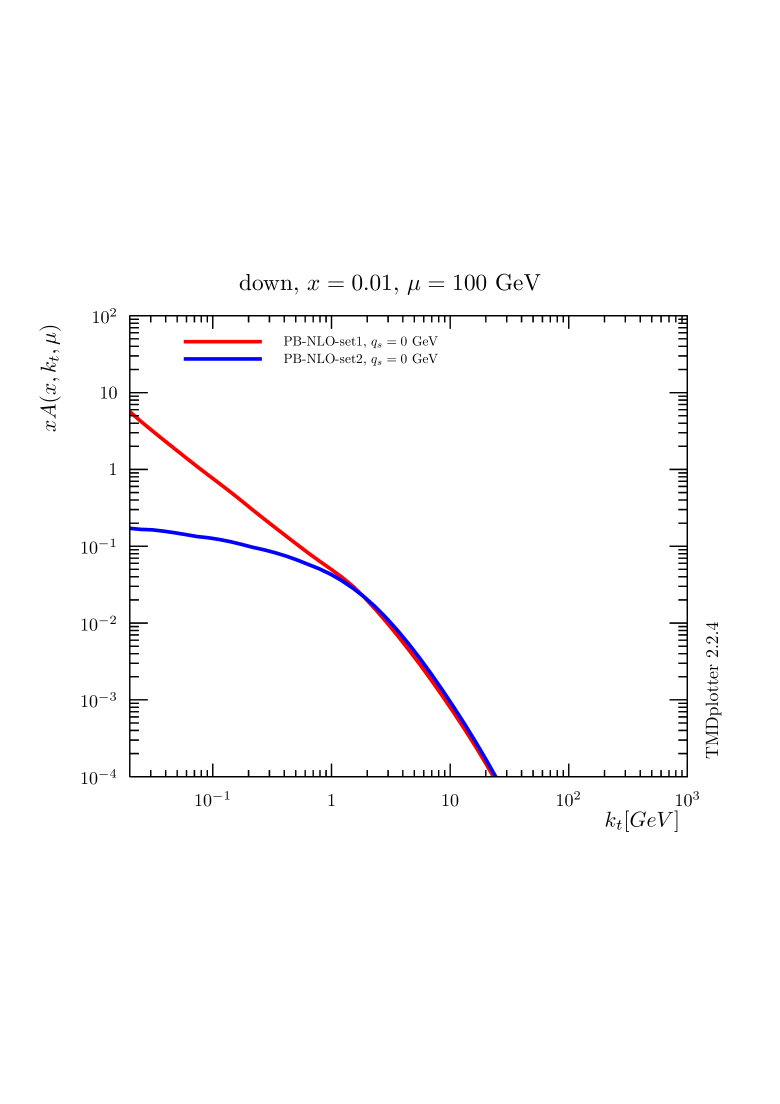
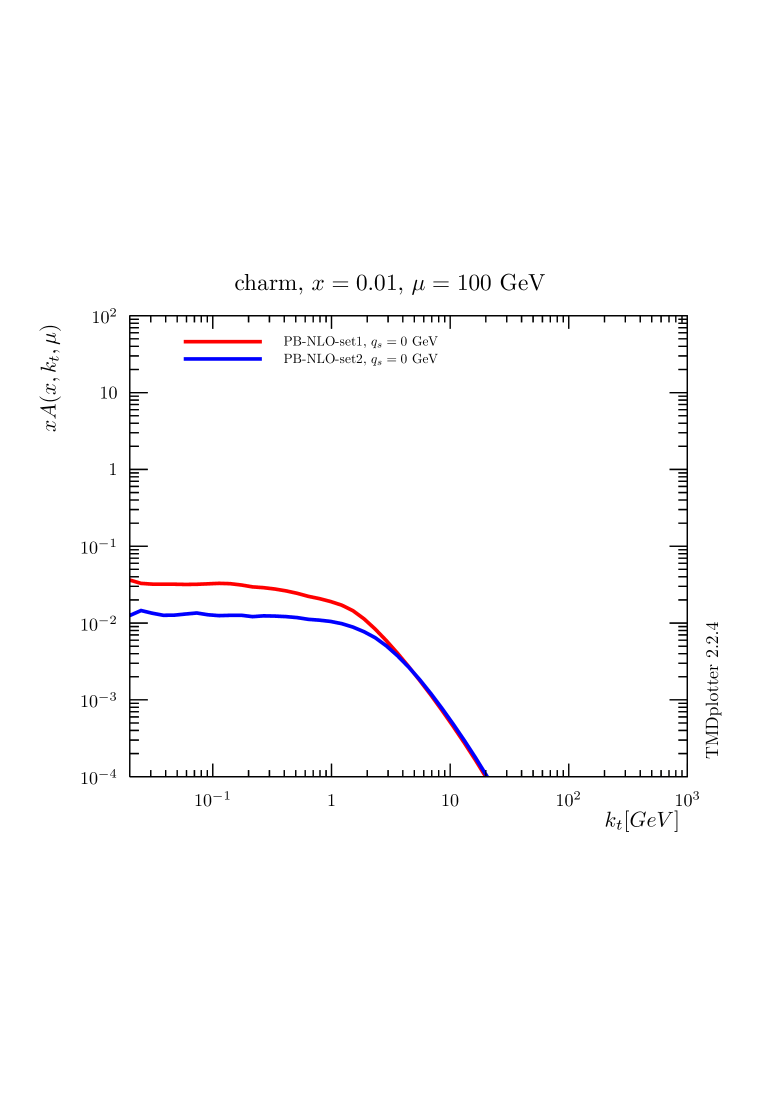
In the transverse momentum distributions obtained with the PB-approach, the effect of the cut-off is even more visible. In Fig. 2 the transverse momentum distributions obtained for down and charm quarks are shown for PB-NLO-2018 Set2, with , i.e. regions , with (red curve) and without intrinsic- distribution applied (blue curve - a Gauss distribution with GeV). We also show the transverse momentum distribution contribution from region alone, i.e. for , without intrinsic- (corresponding to the magenta curve of Fig. 1). The importance of the large -region on the transverse momentum distributions is seen in the comparison with the predictions without intrinsic- distribution (blue and magenta curves).
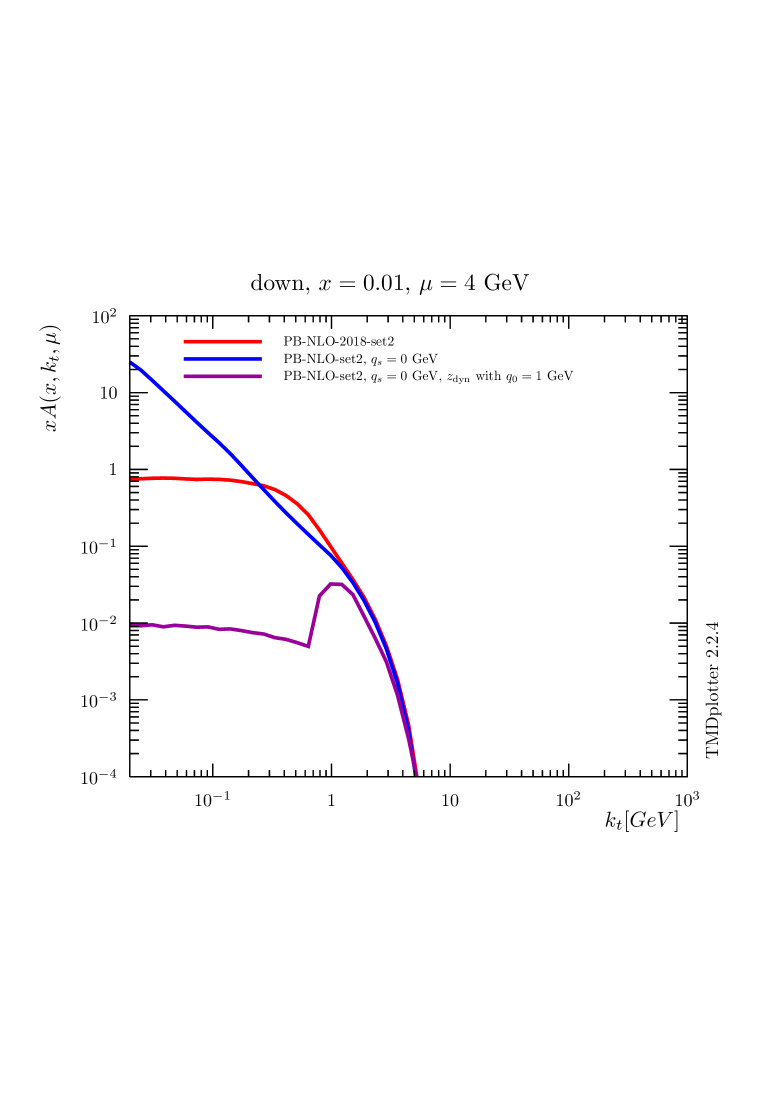
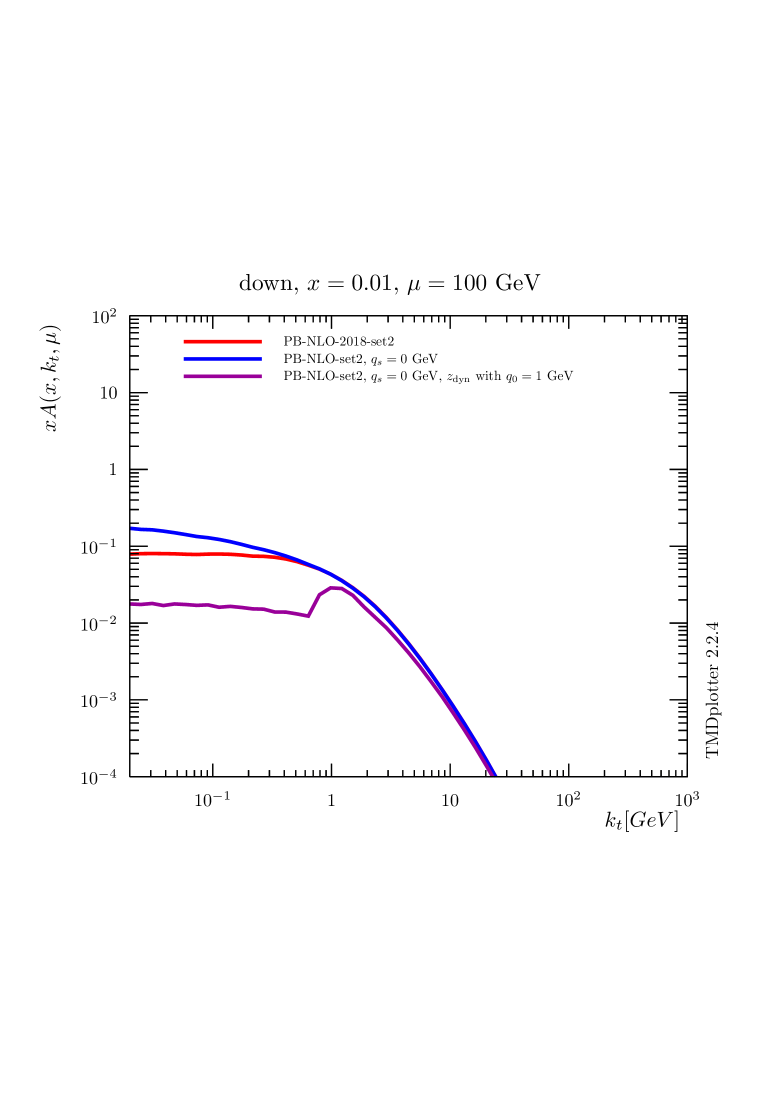
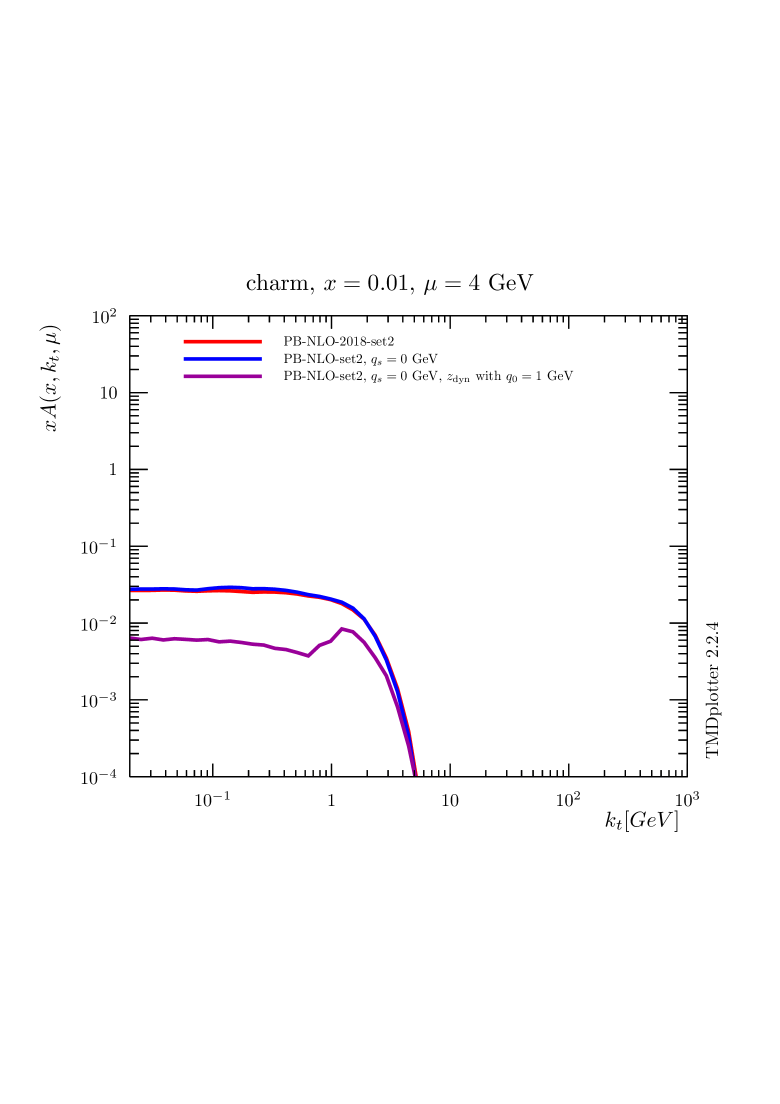
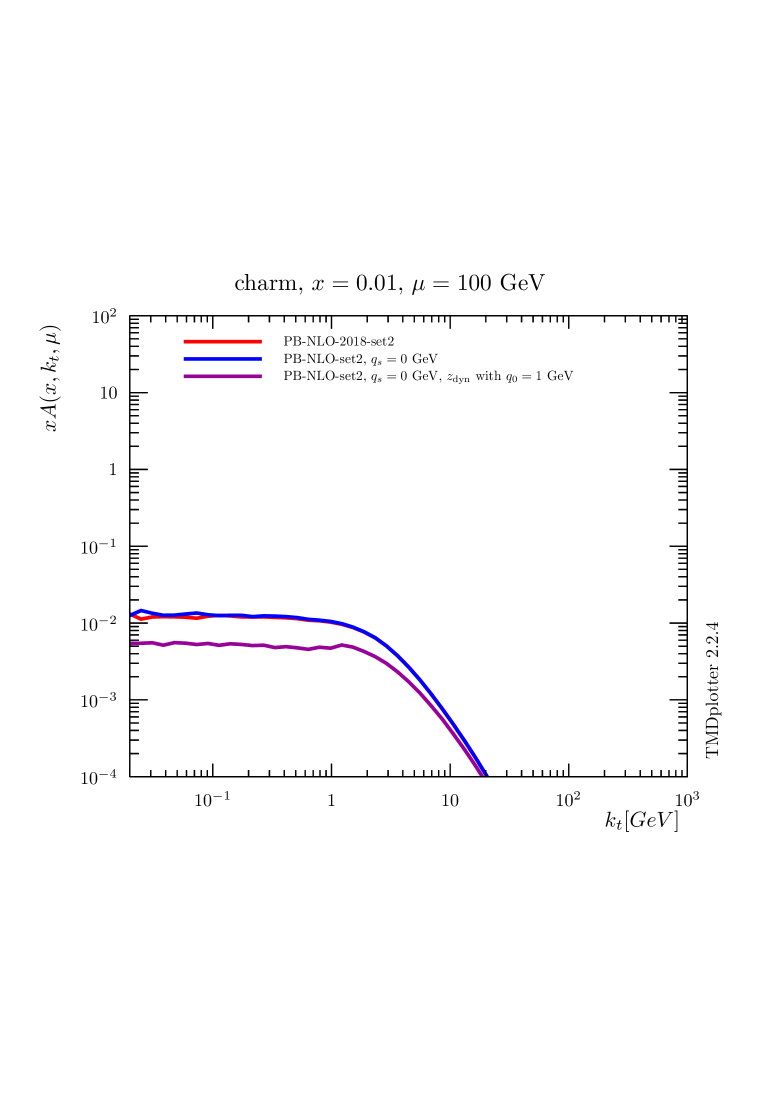
The transverse momentum distributions show very clearly the large effect of the choice of for the soft region, while in the perturbative region the effect becomes smaller with increasing . Applying such a scale, , removes emissions with (there are still low- contributions, which come from adding vectorially all intermediate emissions). However, very soft emissions are automatically included with .
As shown in Fig. 2, the effect of the intrinsic- distribution is much reduced at large scales, but the contribution of the region stays important for small .
It is interesting to observe that the charm density shows essentially no effect of an intrinsic- distribution: this is because charm is generated dynamically from gluons only, and there is no intrinsic charm density.
2.2 Transverse momentum distributions of PB-NLO-2018
After having discussed the importance of the soft nonperturbative region to the transverse momentum distribution, we turn now to a discussion of the transverse component of the PB parton distributions of Ref. [20], which are used for comparison with measurements.
In previous investigations on -boson production at the LHC [7], as well as for low DY mass, , and at low [8], it was found that PB-NLO-2018 Set2 describes the measurements much better, while PB-NLO-2018 Set 1 gives too large a cross section at small DY lepton pair transverse momenta, .
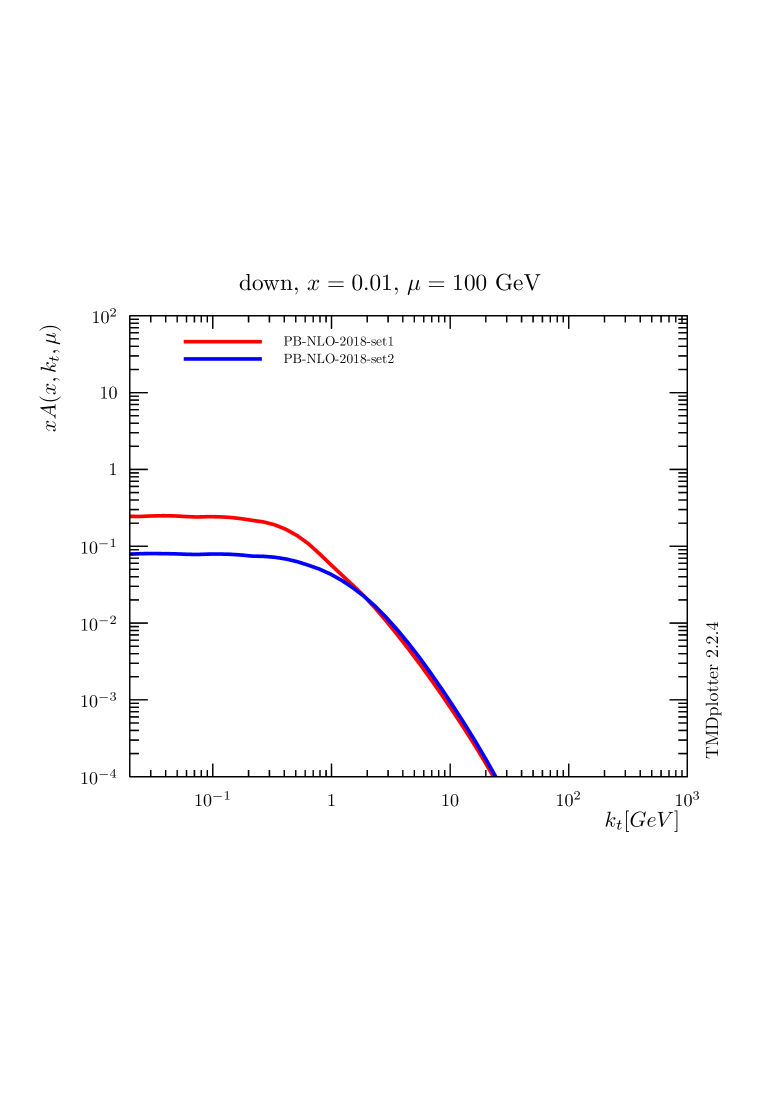

The difference between PB-NLO-2018 Set1 and Set2, which comes from the choice of renormalization scale (argument in ), is seen essentially in the low- region, where the nonperturbative Sudakov form factor (region ), with the integral , plays an important role. In Fig. 3 (upper row) the distributions for up and charm quarks are shown when no intrinsic- distribution is included, the lower row shows distributions including the default intrinsic Gauss distributions of widths GeV. It is very interesting to observe that the differences between the sets setting or not are very much reduced for heavy flavors since they are only generated dynamically (since heavy flavors are not present at the starting scale in the VFNS which is applied here). In principle an intrinsic charm contribution can be included in PB densities, however, this is not required from inclusive DIS data[35] used in the fit of PB-NLO-2018 Set2.
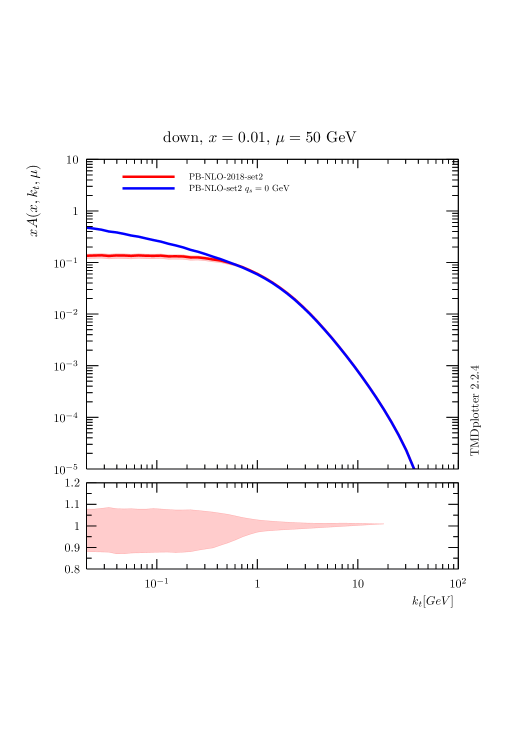
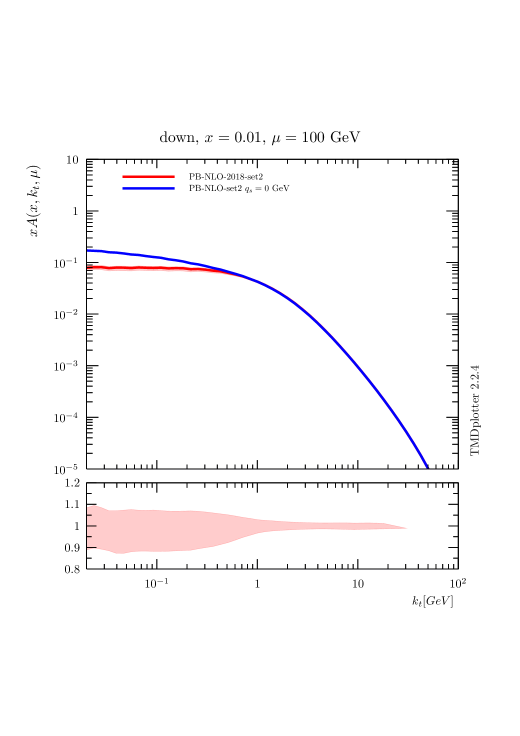
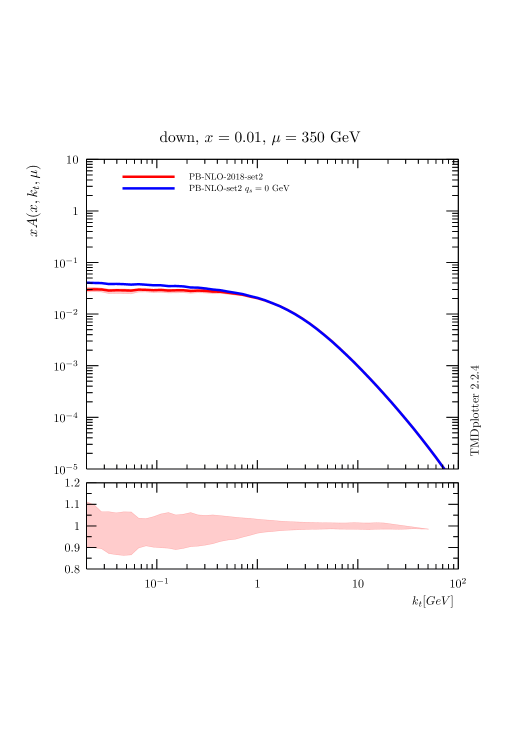
In Fig. 4 the transverse momentum distribution for down quarks, with and without an intrinsic- distribution, is shown at different scales . While at low scales GeV a significant effect of the intrinsic- distribution is observed for very small , at large scales GeV this effect is much reduced. This scale dependence will result in a much smaller sensitivity to the intrinsic- distribution at high .
2.3 Calculation of the DY cross section
The cross section of DY production is calculated at NLO with MadGraph5_aMC@NLO [24]. In the MCatNLO method, the collinear and soft contributions of the NLO cross section are subtracted, as they will be later included when parton shower, or as in our case, TMD parton densities are applied. As in earlier studies, we use Cascade3 [49] to include TMD parton distributions and parton shower to the MCatNLO calculation (a detailed investigation of the effect of TMD parton distributions and parton showers applied in the Cascade3 Monte Carlo generator is given in Ref. [25]). We use the Herwig6 subtraction terms in MCatNLO, since they are based on the same angular ordering conditions as the PBTMD parton distribution sets, PB-NLO-2018 Set1 and PB-NLO-2018 Set2, described in the previous section. The validity and consistency using Herwig6 subtraction terms in MCatNLO together with PB TMD distributions has been studied in detail in the appendix of Ref.[25]. The predicted cross sections (labeled as MCatNLO+CAS3 in the following) are calculated using the integrated versions of the NLO parton densities PB-NLO-2018 Set1 and PB-NLO-2018 Set2 together with at NLO.
The factorization scale , used in the calculation of the hard process is set to , with the sum running over all final state particles, in
case of DY production over all decay leptons and the final jet. For the generation of transverse
momentum according to the PB-TMD distributions, the factorisation scale in the hard process is set to , in the case of a real emission it is set to . The generated transverse momentum is limited by the matching scale SCALUP
[49].
Since there are no PB-fragmentation functions available yet,
the final state parton shower in Cascade3 is generated from Pythia [50], including photon radiation of
the lepton pair.
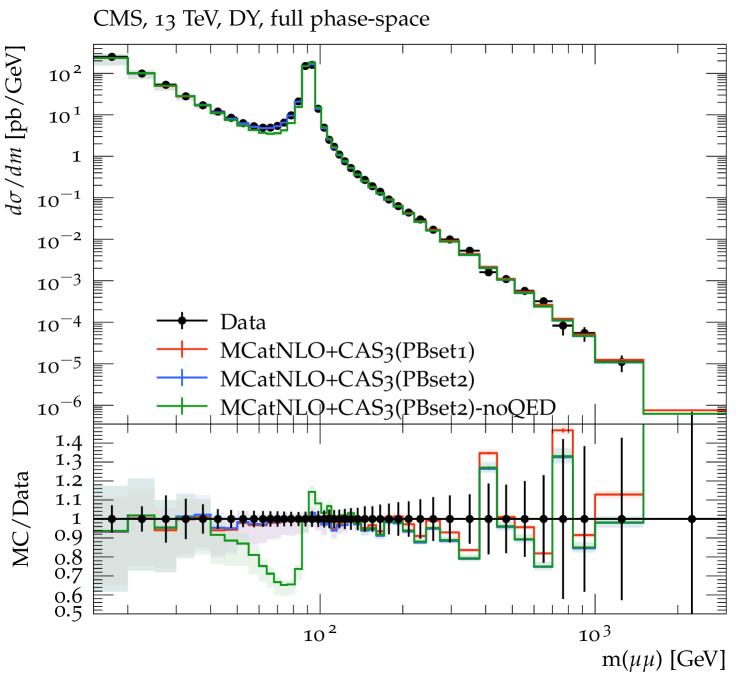
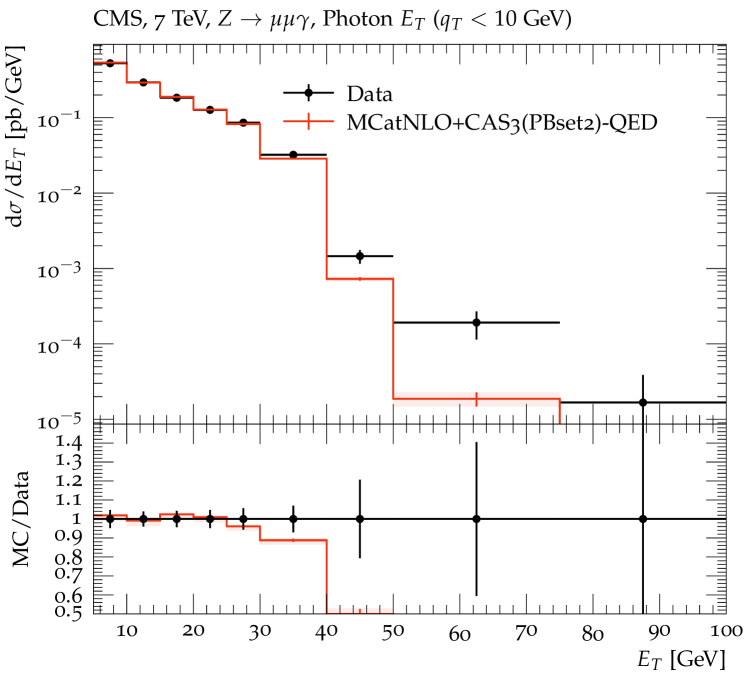
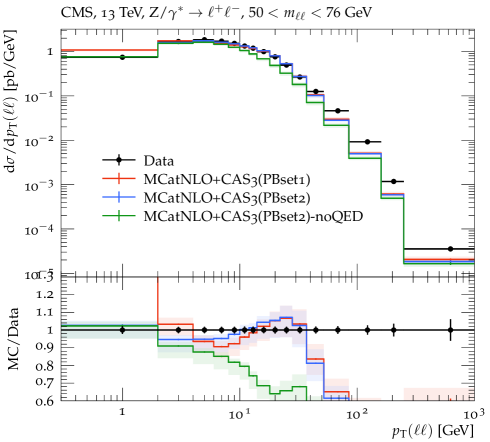
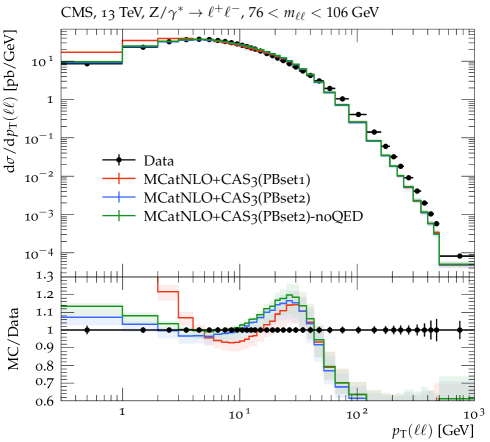
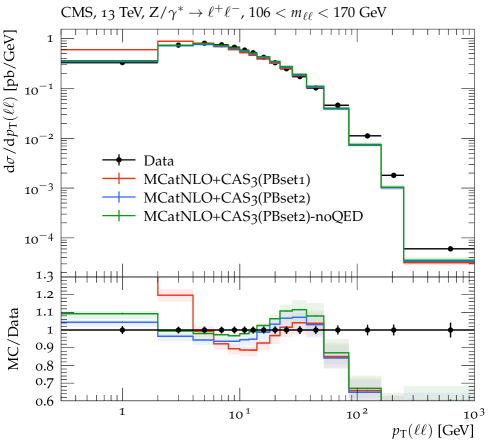
A good description of the final state QED corrections, and in particular the kinematic effect of the real photon radiations, is essential in order to achieve a precise description of the DY transverse momentum. Fig. 5 (left) shows the DY mass distribution as measured by CMS [51] at 13 TeV together with predictions of MCatNLO+CAS3 ‡‡‡We use the Rivet package [52] for the calculation of the final distributions.. The bands show the scale uncertainty coming from a variation of the renormalization and factorization scale by a factor of two up and down, avoiding the extreme values (7-point variation). The DY mass is calculated from the so-called dressed-leptons (see for example [53, 54]), where photons radiated within a cone of radius of are merged to the lepton before the momenta are calculated. We show predictions based on PB-NLO-2018 Set1 and Set2, and also, for illustration, when photon radiation is turned off in the final-state shower (labeled as "noQED"). A rather good description of the DY mass spectrum over a large range on is obtained both with PB-NLO-2018 Set1 and Set2. Only at greater than a few hundred GeV the predictions tend to become smaller than the measurement (while still within the uncertainties). However, this is the region where the partonic becomes large and not well constrained by the fit to HERA data [35] used for the PB-NLO-2018 TMD extraction [20]. In the region of below the -pole, one can observe the importance of QED corrections. In Fig. 5 (right) we show the photon transverse momentum spectrum in -production as measured by CMS [55] at 7 TeV in comparison with MCatNLO+CAS3 including QED radiation. The photon spectrum is well described at low GeV, while the high spectrum predicted by the parton shower falls below the measurement, since the precision of parton showers are limited for the high region.
3 The transverse momentum spectrum of DY lepton pairs
The transverse momentum spectrum of DY pairs at TeV has been measured for a wide range by CMS [17]. We use this measurement for comparison with predictions of MCatNLO+CAS3 based on PB-NLO-2018 Set1 and PB-NLO-2018 Set2, as shown in Fig. 6. As already observed in previous investigations [25, 40, 23, 7], the PB-NLO-2018 Set1 gives too high a contribution at small transverse momenta , while PB-NLO-2018 Set2 describes the measurements rather well, without any further adjustment of parameters§§§The predictions shown here are slightly different compared to the predictions in [17] because we use here a lower minimum cut and because of a bug in the treatment of QED radiation in Rivet, corrected in version 3.1.8, underlining the role of evaluating the strong coupling at the transverse momentum scale. In order to illustrate the importance of QED corrections, we show in addition a prediction based on PB-NLO-2018 Set2 without including QED final state radiation (labeled noQED). Especially in the low region, the inclusion of QED radiation is essential, not only changing the total cross section but rather strongly modifying the shape of the transverse momentum distribution . All calculations predict too low a cross section at large transverse momentum due to missing higher-order contributions in the matrix element. In Refs. [56, 11, 57] it is shown explicitly that including higher orders in the matrix element through the TMD multi-jet merging technique gives an excellent description even for largest . For all further distributions, we restrict the investigations to below the peak region (i.e. GeV).
3.1 Influence of the intrinsic- distribution on DY transverse momentum distributions
Given the rather successful description of the DY -spectrum with MCatNLO+CAS3 using PB-NLO-2018 Set 2 in the low -region, we investigate below the importance of the intrinsic- distribution. In PB-NLO-2018 the intrinsic- distribution is parameterized as a Gauss distribution with zero mean and a width [20] (see Eq. (4)), where was fixed by default at GeV.
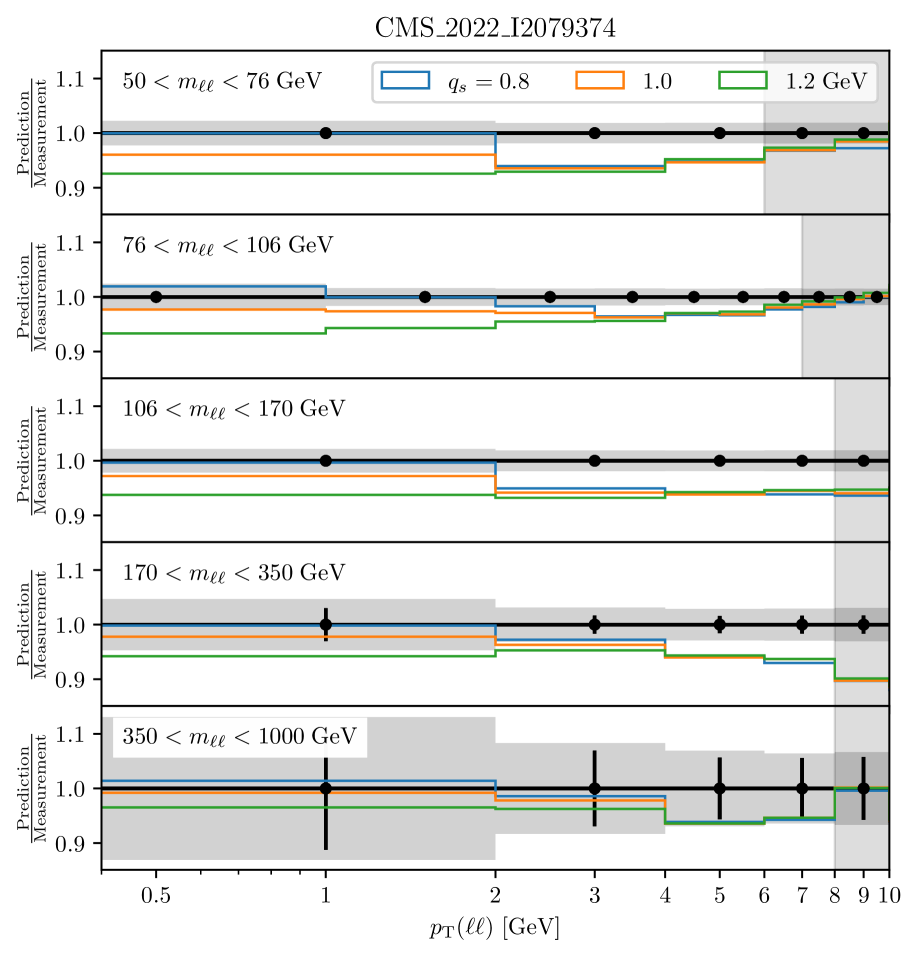
In order to illustrate the sensitivity range of the intrinsic- distribution, we show in Fig. 7 the MCatNLO+CAS3 predictions for the low -spectrum of DY production at different DY masses for different intrinsic- distribution (with different parameter values) compared to the CMS measurement [17]. We observe that sensitivity to intrinsic- is more pronounced at small values. This sensitivity decreases with increasing mass, as expected from Fig. 4
In the following we describe a determination of the Gaussian width for different DY masses, , at different . The prediction is obtained from a calculation of MCatNLO+CAS3 using TMD distributions obtained with the PB-NLO-2018 Set2 parameters for the collinear distribution, but with different values. We scan for each -bin in steps of to GeV in the range GeV. At higher DY transverse momenta, higher order contributions have to be taken into account (a study using multijet merging is given in Refs. [56, 11, 57]).
3.2 Fit of the Gauss width in pp at TeV
The transverse momentum distribution of DY leptons has been measured by the CMS collaboration [17]. This is the basic measurement for the determination of the intrinsic- parameter , since it covers a wide -range with high precision and that a detailed uncertainty breakdown, discussed in subsection 3.2.1, is provided. The measurements of -production obtained from LHCb [58] are discussed in subsection 3.2.2, while measurements at lower center-of-mass energies are shown in subsection 3.3.
3.2.1 DY production over a wide DY mass range
The CMS collaboration has measured Drell-Yan production at 13 TeV [17] covering a range of DY mass GeV. The measurement is provided with a detailed uncertainty breakdown, corresponding to a complete treatment of experimental uncertainties including correlations between bins of the measurement for each uncertainty source separately. Note that we use the fully detailed breakdown of the experimental uncertainties provided on the CMS public website ¶¶¶The corresponding HEPdata records only contain summarised information.
In order to determine the intrinsic- we vary the parameter and calculate a to quantify the model agreement with the measurement. We evaluate the following expression∥∥∥The code used with the full covariance matrix is available in Ref. [59], an earlier version to be used directly with Rivet is in Ref. [60].,
| (8) |
with being the measurement and being the prediction for data point . The covariance matrix is decomposed into a component describing the uncertainty in the measurement, , and the statistical and scale uncertainties in the prediction,
| (9) |
The covariance matrix of the measurement is taken directly from the supplementary material provided by CMS. The statistical uncertainty in the prediction, arising from the use of a Monte Carlo simulation, is accounted for as a small diagonal contribution without correlations between bins,
| (10) |
where is the bin-by-bin statistical uncertainty. We also treat, for the first time, the scale uncertainties of the theoretical prediction as a correlated uncertainty, for a given range, allowing for a global shift of all bins together within the band defined by the symmetrized envelope of the scale uncertainties. This contribution to the covariance matrix is constructed as follows,
| (11) |
where encodes the scale variation for each bin.
We first extract independent values of for each invariant mass region considered in the measurement, considering only the region most sensitive to , . We reduce this range further in the first two regions to for and for to stay in the region of sensitivity and not be biased by missing higher orders in the predictions affecting high shape. The obtained (reduced ) values are shown in Fig. 8 as a function of .
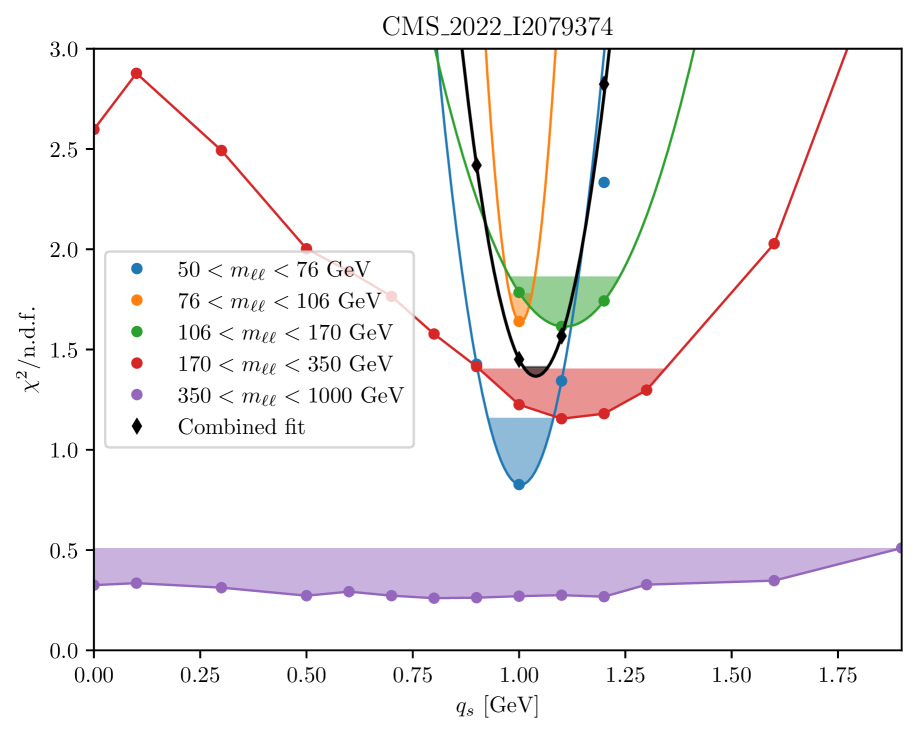
Within each region, we consider the value of for which the smallest is obtained as our “best fit” value. We construct a one-sigma confidence region as the set of all values for which . When possible, this region is determined graphically using a linear interpolation between scan points. When the minimum is too narrow for a reliable determination of the uncertainty using this method, we use instead a quadratic interpolation between the lowest three points and add an uncertainty equal to one half-bin-width (0.05 GeV) in quadrature. In addition, we include an uncertainty derived by repeating the procedure with modified fit boundaries. The values obtained using this method are listed in Table 1 and a comparison is shown in Fig. 9.
| region | Best | n.d.f | Best fit [GeV] |
|---|---|---|---|
| 50–76 GeV | 2.45 | 3 | |
| 76–106 GeV | 11.4 | 7 | |
| 106–170 GeV | 6.46 | 4 | |
| 170–350 GeV | 4.62 | 4 | |
| 350–1000 GeV | 1.04 | 4 |
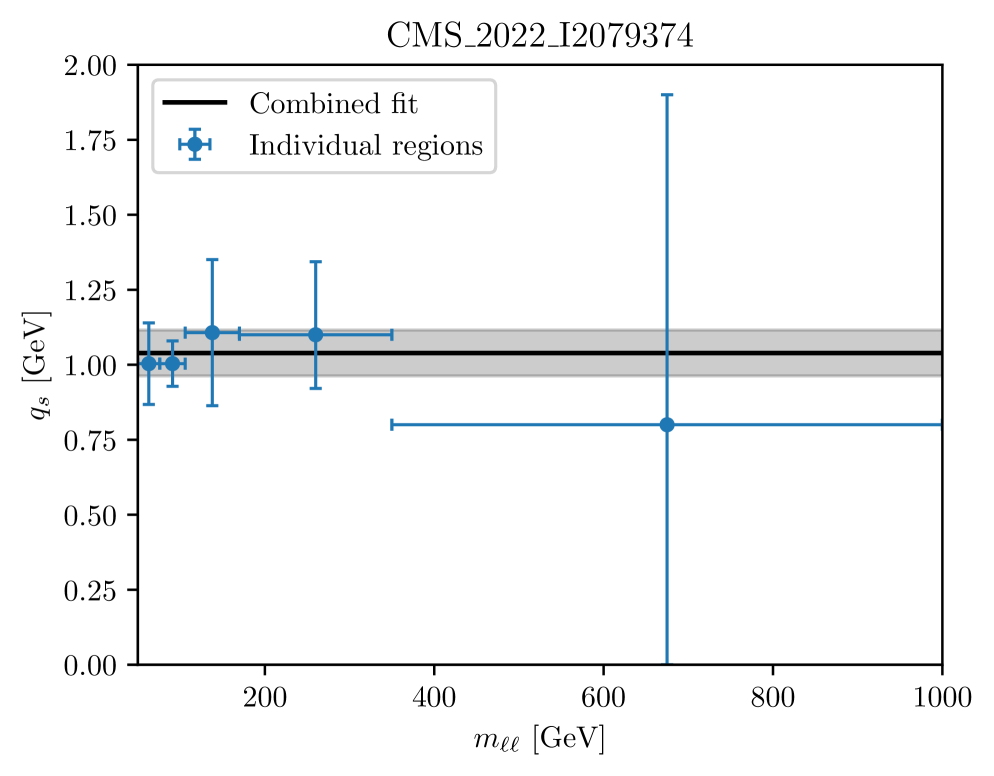
The values derived from each interval are compatible with each other. The most precise determination is obtained from the peak region, , followed by the regions around it. The sensitivity at high mass suffers from larger statistical uncertainties in the measurement. This independence of the intrinsic- with the DY mass contrasts with the need to tune the Parton Shower parameters for different masses in standard Monte Carlo events generators (see [17] - Fig. 6 for a data comparison with MadGraph5_aMC@NLO interfaced with Pythia Parton Shower).
Having obtained compatible results, we proceed to deriving a combined fit by calculating a joint including the considered bins in all mass ranges. For this, we construct a new covariance matrix as a sum over the 650 uncertainty sources included in the detailed breakdown. We consider that each systematic uncertainty is fully correlated between regions and construct their covariance matrices in the same way as in Eq. (11). The statistical uncertainties (data and Monte Carlo) in the measurement feature nontrivial correlations due to the use of unfolding but are independent in each region, and therefore we construct a block-diagonal matrix from the covariance matrices in each region. The statistical uncertainty in the prediction is diagonal. We consider that the uncertainties in the QCD scales are not correlated between regions and use a block-diagonal matrix.
The values obtained using the combined covariance matrix are shown in Fig. 8. The best fit value, extracted in the same way as for separate regions, is,
This value and its uncertainty are shown as a black line and shaded area on Fig. 9 for comparison with the individual bins. A cross-check has been performed by interpolating the prediction for each bin between values and searching for the minimum of the distribution using a finer grid. It returned values within the uncertainties quoted above. The TMD distributions including the new value are available in TMDlib and TMDplotter [38, 39].
To make consistency checks of the obtained value of and to examine possible trends of its dependence on DY mass and centre-of mass energy, the DY measurements at high rapidity and lower collision energies have been analysed. Since for these measurements no full error breakdown are available, we treat all uncertainties as being uncorrelated and do not include systematic uncertainty coming from the scale variation in the theoretical calculation.
3.2.2 Z production at high rapidities at 13 TeV
The LHCb collaboration [58] has measured -production at TeV in the forward region, covering a rapdity range of .
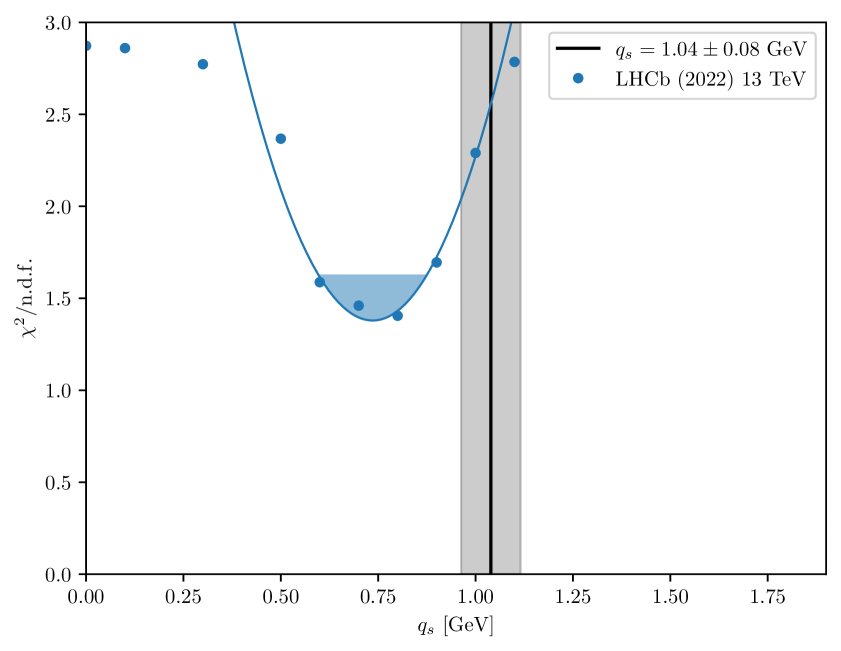
The distribution is shown in Fig. 10 summed over the rapidity range of the DY lepton pair as a function of . A minimum is obtained for GeV, where the uncertainty comes from a variation of by one unit and from the step size of the scan.
3.3 The Gauss widths from lower center of mass energies
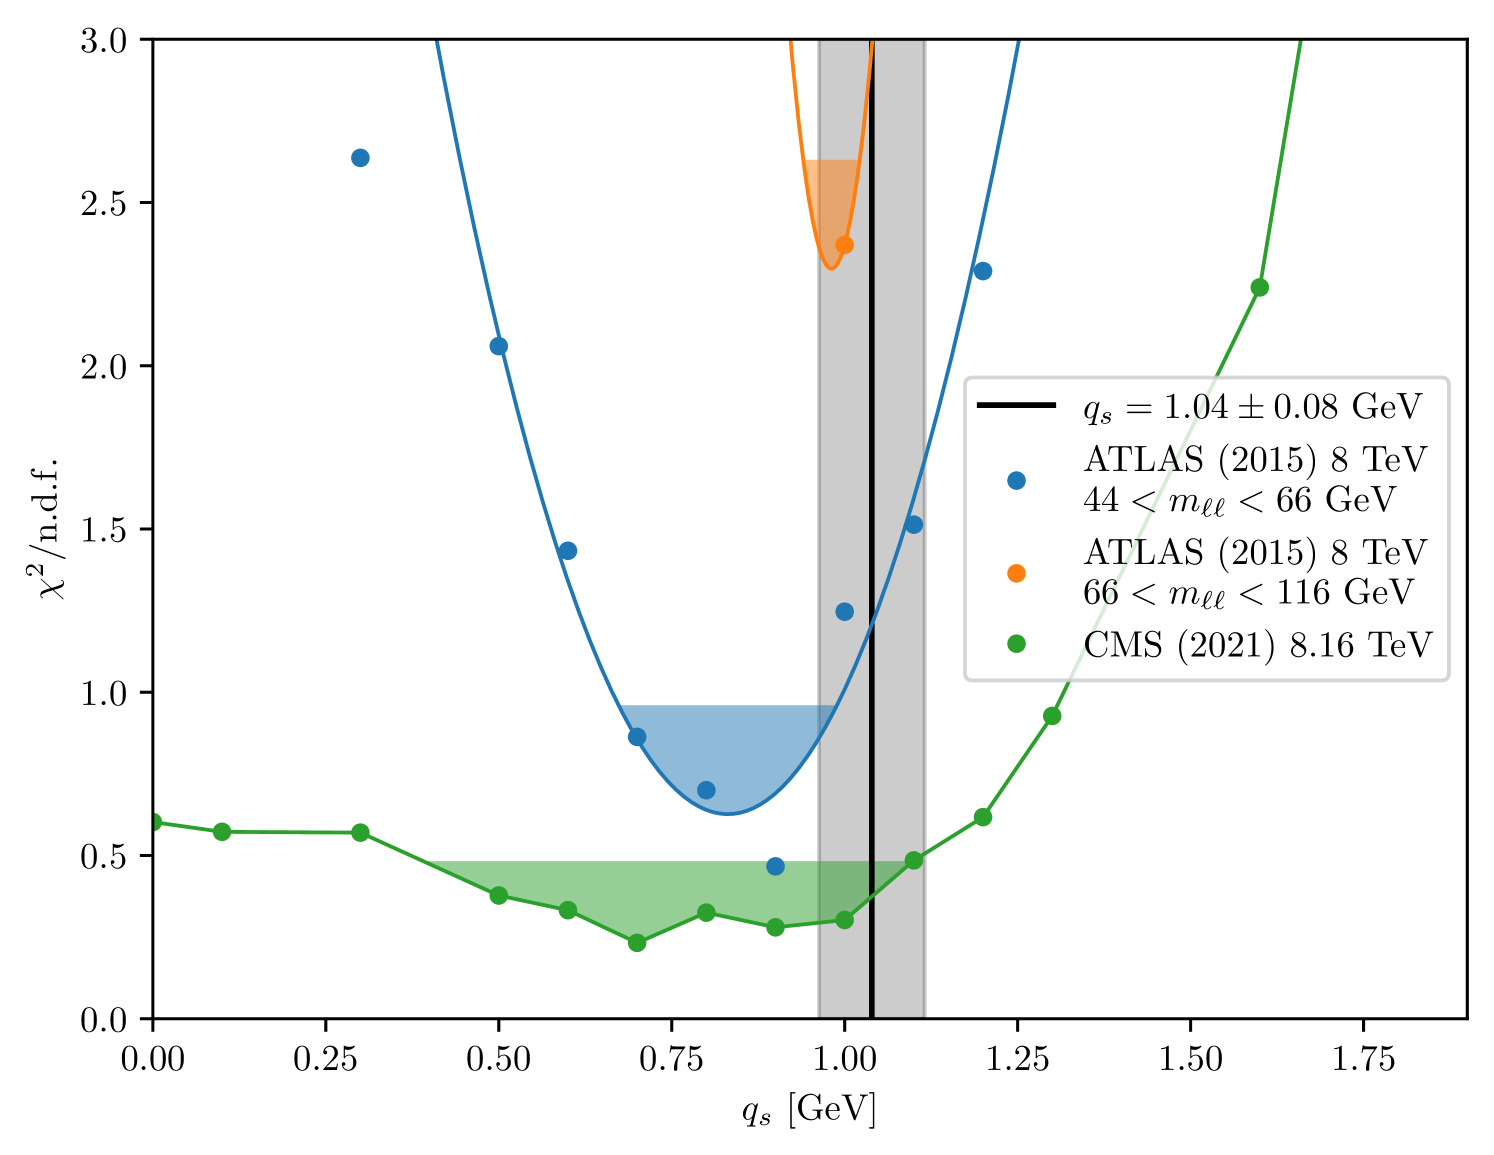
The ATLAS collaboration has measured the production of DY from collisions at TeV in several DY mass bins, out of which only the two with GeV and GeV are relevant for GeV [61]. In Fig. 11 we show the as a function of obtained from these two mass bins ().
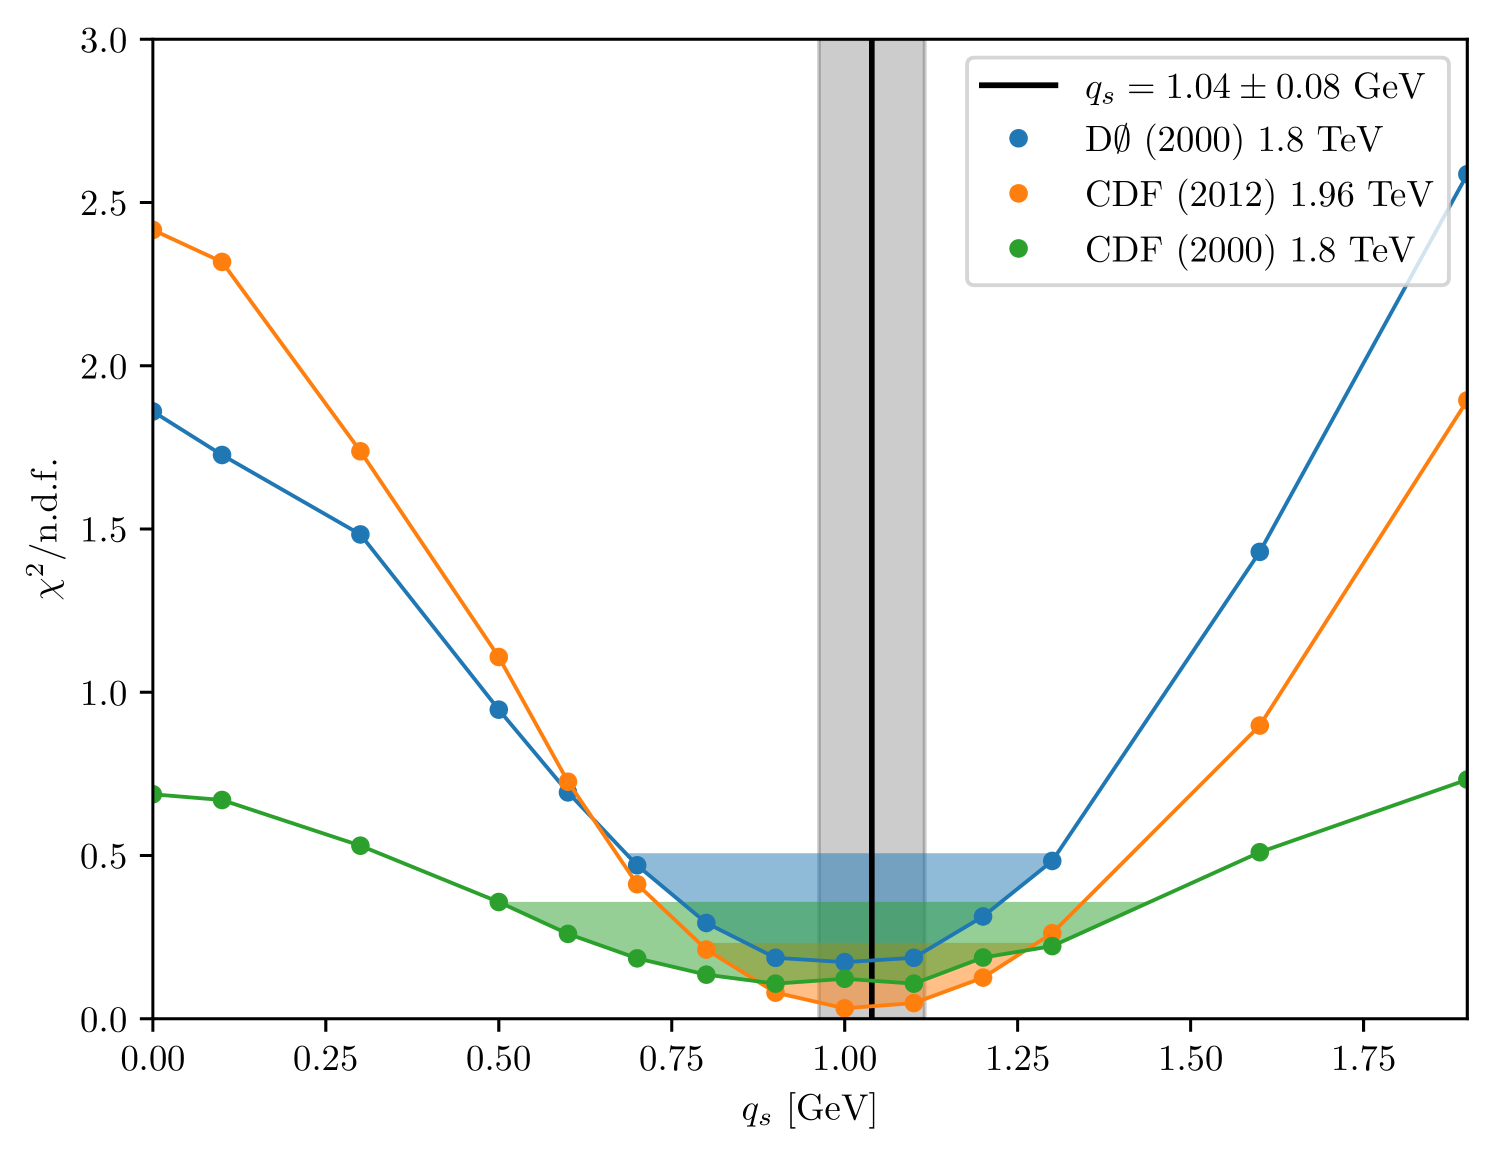
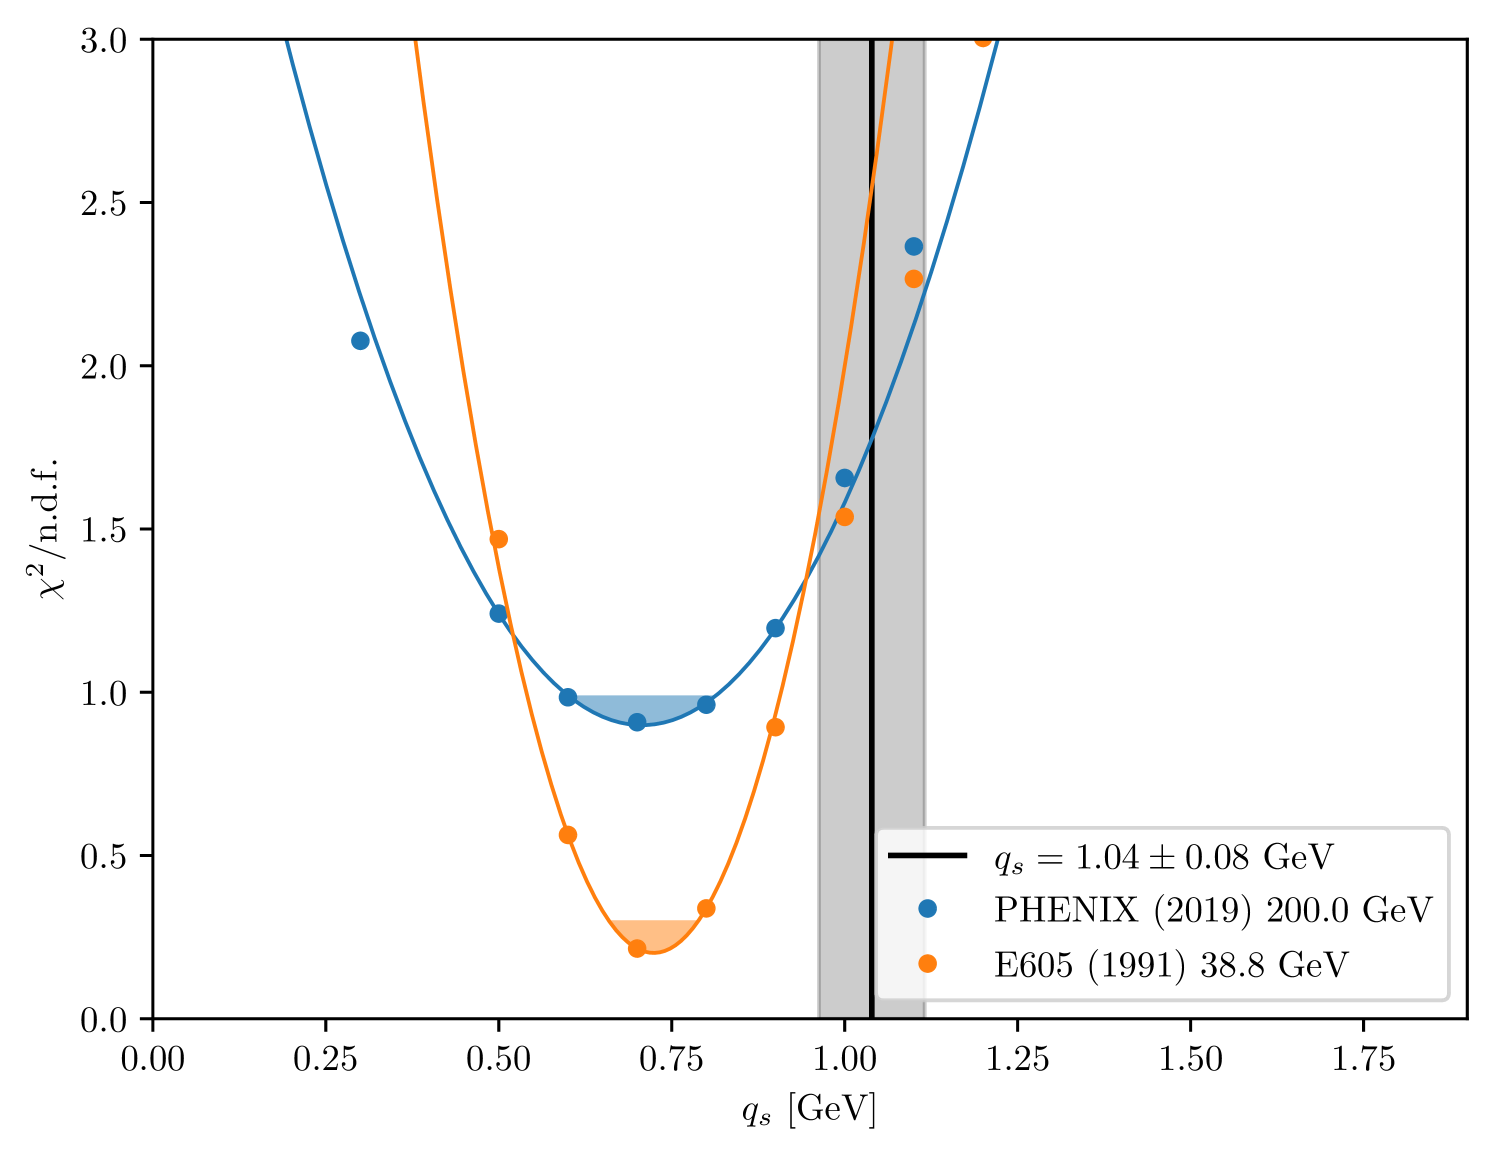
The Tevatron experiments D0 [62] and CDF have measured transverse momenta of DY lepton pairs created in collisions at lower center-of-mass energies (1.8 TeV [63] and 1.96 TeV [64]). The PHENIX collaboration measured DY production at GeV [65], and E605 [66] at GeV. The Drell-Yan differential cross section in has also been measured in pPb data at TeV by CMS [67]. Figure 11 shows the impact that the choice has on for these different measurements.
.
3.4 Consistency between determinations of intrinsic width
A global fit of is obtained by calculating for different measurements, as shown in Table 2, including the corresponding center-of-mass energies, collision types and the number of fitted data points, resulting in a total of data points.
The impact of intrinsic- distribution at lower collision energies has been analyzed using the entire range of , while at higher center-of-mass energies we investigate up to the peak region in the transverse momentum distribution.
| Analysis | Collision types | n.d.f | |
|---|---|---|---|
| CMS_2022_I2079374 [17] | 13 TeV | pp | 25 |
| LHCb_2022_I1990313 [58] | 13 TeV | pp | 5 |
| CMS_2021_I1849180 [67] | 8.1 TeV | pPb | 5 |
| ATLAS_2015_I1408516 [61] | 8 TeV | pp | 8 |
| CDF_2012_I1124333 [64] | 1.96 TeV | 6 | |
| CDF_2000_S4155203 [63] | 1.8 TeV | 5 | |
| D0_2000_I503361 [62] | 1.8 TeV | 4 | |
| PHENIX_2019_I1672015 [65] | 200 GeV | 12 | |
| E605_1991_I302822 [66] | 38.8 GeV | pp | 11 |
| Total | 81 |
The distribution as a function of , for all the data together, is shown in Fig. 12. The distribution exhibits a minimum at around GeV, which is consistent with the value obtained as described above.
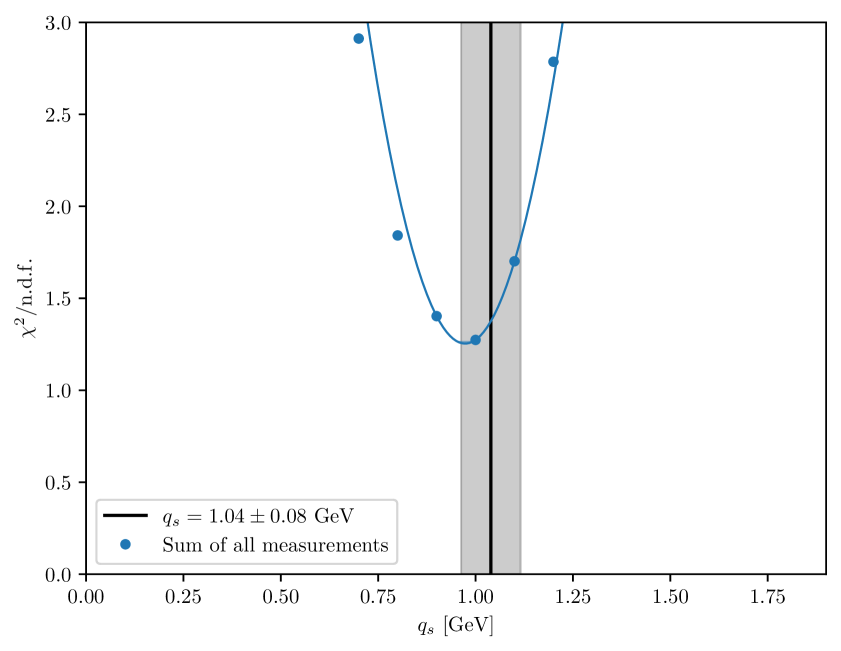
Figure 13 displays the value of as a function of and obtained from the different measurements in Refs. [17, 58, 67, 61, 63, 62, 64, 65, 66]. For the data which do not provide detailed uncertainty breakdown and are mainly used for the cross checks and comparison purpose, the uncertainty bars of shown in the figures are obtained from the variation of one unit and step size of the scan only. The value of GeV , as derived from the measurements in Ref.[17], is compatible for all ranges of , and also holds true for various values of . The obtained value is also found to be compatible for pPb data.
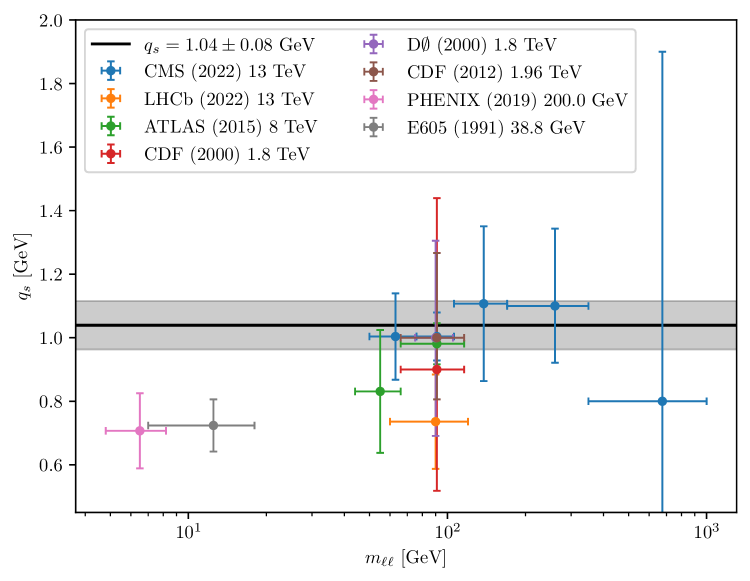
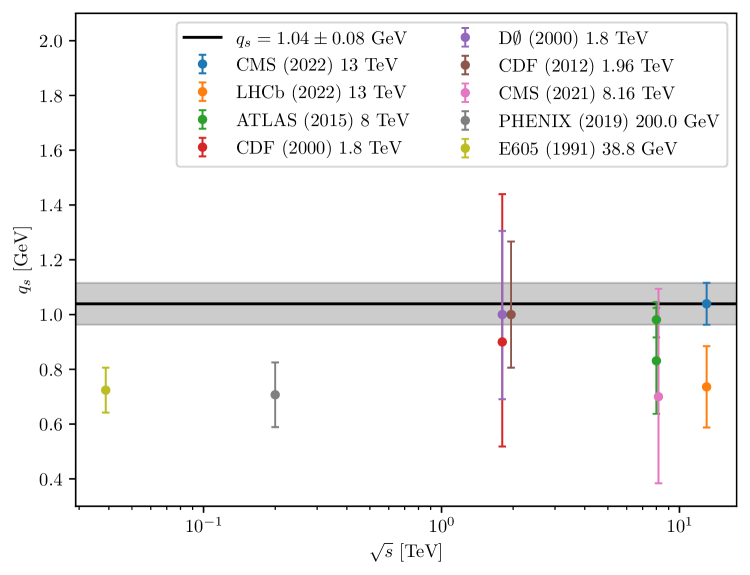
To summarize, we have obtained a value for the width of the Gauss distribution for modeling the intrinsic- distribution inside protons of GeV. This value, in contrast to standard Monte Carlo event generators, has no strong dependence on the center-of-mass energy as well as on the mass of the produced Drell-Yan lepton pair . The results of this section indicate that the treatment of soft emissions in the region with the strong coupling of Eq. (6) applied in PB-NLO-2018 Set2 leads to intrinsic- distributions with width parameter consistent with Fermi motion kinematics, and mildly varying with energy.
4 Conclusion
In this paper we have carried out a detailed application of the PB-TMD methodology, which is reviewed in the first part of the paper, and used it to describe the DY low transverse momentum distributions across a wide range of DY masses. Within this methodology, we have presented the extraction of the intrinsic- nonperturbative TMD parameter from fits to the measurements of DY differential cross sections performed recently at the LHC at TeV, for DY masses between 50 GeV and 1 TeV. We have compared this with extractions from other DY measurements at different center-of-mass energies and masses.
As shown previously, the measured DY cross section at low favours a choice of the strong coupling scale to be taken as the transverse momentum of each parton emission, as in angular-ordered CMW parton cascades. This corresponds to the TMD parton distribution set PB-NLO-2018 Set2. In this paper we use PB-NLO-2018 Set2 with “pre-confinement” scale of 1 GeV. The strong coupling is evaluated at the emitted transverse momentum for emissions with , populating the phase space region (where , with being the scale of the branching), while it is evaluated at the semi-hard scale for emissions with . The contribution to the Sudakov evolution from the parton branching in the phase space region gives the perturbative resummation of Sudakov logarithms, while the contribution from the parton branching in the phase space region gives the nonperturbative Sudakov form factor. Therefore the PB-NLO-2018 Set2 contains two sources of nonperturbative effects: i) the nonperturbative TMD distribution at low evolution scale , and ii) the nonperturbative Sudakov form factor, specified by the “pre-confinement” scale prescription to continue the branching evolution to the infrared region . The former includes the intrinsic- width parameter , corresponding to Fermi motion in the hadron beam, while the latter is characterized by the semi-hard scale parameter . At low , the contribution of nonperturbative Sudakov form factor interplays with the contribution of the intrinsic transverse momentum.
The main result of the present work is the extraction, within the PB-NLO-2018 Set2 framework, of the intrinsic- Gauss distribution with zero mean and width parameter from the measured dependence of the DY cross sections obtained recently at the LHC at TeV [17], for different DY masses , between 50 GeV and 1 TeV. These measurements provide a complete decomposition of the different systematic uncertainties and their covariance matrices. To compare to the data, we have used DY production at NLO obtained with the MadGraph5_aMC@NLO event generator matched with the PB TMD distributions PB-NLO-2018 Set2, with a given parameter value. We performed a scan over a large range of values on the transverse momentum spectrum below the peak, i.e. the sensitive part to intrinsic-, and considering separately each experimental source of uncertainty and their correlations. The theory scale uncertainties have been considered to be fully correlated inside each bin and uncorrelated between bins. We found the value GeV, consistent for the different . The obtained value is in agreement to the expected value from Fermi-motion in protons. It has been cross checked that this value is compatible with values obtained from other DY measurements at different center-of-mass energies and for a variety of DY masses. The global picture shows no strong dependence of the intrinsic- on the center-of-mass energy or on the DY mass, which contrasts with tuned standard Monte Carlo event generators that need a strongly increasing intrinsic Gauss width with and with .
We suggest that the remarkably stable value of that we obtain in our study can be attributed to the contribution of the nonperturbative Sudakov form factor and the treatment of the region near the soft-gluon resolution boundary.
Acknowledgments. We are grateful to M. Abdullah Al-Mashad, L.I. Estevez Banos, L. Keersmaekers, A.M. van Kampen, K. Wichmann, Q. Wang, H. Yang from the CASCADE developer group for interesting and productive discussions. We are grateful to Louie Corpe for developing a code to calculate including correlations within the Rivet frame. We also thank Marius Ambrozas for many discussion on the treatment of systematic uncertainties. This article is part of a project that has received funding from the European Union’s Horizon 2020 research and innovation programme under grant agreement STRONG 2020 - No 824093. LF is supported by the F.R.S.-FNRS of Belgium. A. L. acknowledges funding by Research Foundation-Flanders (FWO) (application number: 1272421N). LM acknowledges the support of the Deutsche Forschungsgemeinschaft (DFG, German Research Foundation) under Germany’s Excellence Strategy - EXC 2121 "Quantum Universe" - 390833306.
References
- [1] S. Drell and T.-M. Yan, “Massive Lepton Pair Production in Hadron-Hadron Collisions at High-Energies”, Phys. Rev. Lett. 25 (1970) 316.
- [2] J. C. Collins, D. E. Soper, and G. F. Sterman, “Transverse Momentum Distribution in Drell-Yan Pair and W and Z Boson production”, Nucl. Phys. B 250 (1985) 199.
- [3] T. Sjöstrand et al., “An introduction to PYTHIA 8.2”, Comput. Phys. Commun. 191 (2015) 159, arXiv:1410.3012.
- [4] J. Bellm et al., “Herwig 7.0/Herwig++ 3.0 release note”, Eur. Phys. J. C 76 (2016) 196, arXiv:1512.01178.
- [5] M. Bahr et al., “Herwig++: physics and manual”, Eur. Phys. J. C 58 (2008) 639–707, arXiv:0803.0883.
- [6] T. Gleisberg et al., “Event generation with SHERPA 1.1”, JHEP 0902 (2009) 007, arXiv:0811.4622.
- [7] A. Bermudez Martinez et al., “Production of Z-bosons in the parton branching method”, Phys. Rev. D 100 (2019) 074027, arXiv:1906.00919.
- [8] A. Bermudez Martinez et al., “The transverse momentum spectrum of low mass Drell–Yan production at next-to-leading order in the parton branching method”, Eur. Phys. J. C 80 (2020) 598, arXiv:2001.06488.
- [9] F. Hautmann et al., “Collinear and TMD quark and gluon densities from Parton Branching solution of QCD evolution equations”, JHEP 01 (2018) 070, arXiv:1708.03279.
- [10] F. Hautmann et al., “Soft-gluon resolution scale in QCD evolution equations”, Phys. Lett. B 772 (2017) 446, arXiv:1704.01757.
- [11] A. Bermudez Martinez, F. Hautmann, and M. L. Mangano, “TMD evolution and multi-jet merging”, Phys. Lett. B 822 (2021) 136700, arXiv:2107.01224.
- [12] R. Angeles-Martinez et al., “Transverse Momentum Dependent (TMD) parton distribution functions: status and prospects”, Acta Phys. Polon. B 46 (2015), no. 12, 2501, arXiv:1507.05267.
- [13] S. Gieseke, M. H. Seymour, and A. Siodmok, “A Model of non-perturbative gluon emission in an initial state parton shower”, JHEP 06 (2008) 001, arXiv:0712.1199.
- [14] T. Sjöstrand and P. Skands, “Multiple interactions and the structure of beam remnants”, JHEP 03 (2004) 053, arXiv:hep-ph/0402078.
- [15] J. Isaacson, Y. Fu, and C. P. Yuan, “Improving ResBos for the precision needs of the LHC”, arXiv:2311.09916.
- [16] F. Hautmann, I. Scimemi, and A. Vladimirov, “Non-perturbative contributions to vector-boson transverse momentum spectra in hadronic collisions”, Phys. Lett. B 806 (2020) 135478, arXiv:2002.12810.
- [17] CMS Collaboration, “Measurement of the mass dependence of the transverse momentum of lepton pairs in Drell-Yan production in proton-proton collisions at = 13 TeV”, Eur. Phys. J. C 83 (2023), no. 7, 628, arXiv:2205.04897.
- [18] A. Bacchetta et al., “Unpolarized Transverse Momentum Distributions from a global fit of Drell-Yan and Semi-Inclusive Deep-Inelastic Scattering data”, arXiv:2206.07598.
- [19] M. Bury et al., “PDF bias and flavor dependence in TMD distributions”, JHEP 10 (2022) 118, arXiv:2201.07114.
- [20] A. Bermudez Martinez et al., “Collinear and TMD parton densities from fits to precision DIS measurements in the parton branching method”, Phys. Rev. D 99 (2019) 074008, arXiv:1804.11152.
- [21] H. Jung, S. T. Monfared, and T. Wening, “Determination of collinear and TMD photon densities using the Parton Branching method”, Physics Letters B 817 (2021) 136299, arXiv:2102.01494.
- [22] H. Jung and S. T. Monfared, “TMD parton densities and corresponding parton showers: the advantage of four- and five-flavour schemes”, arXiv:2106.09791.
- [23] A. Bermudez Martinez et al., “The transverse momentum spectrum of low mass Drell–Yan production at next-to-leading order in the parton branching method”, Eur. Phys. J. C 80 (2020) 598, arXiv:2001.06488.
- [24] J. Alwall et al., “The automated computation of tree-level and next-to-leading order differential cross sections, and their matching to parton shower simulations”, JHEP 1407 (2014) 079, arXiv:1405.0301.
- [25] H. Yang et al., “Back-to-back azimuthal correlations in jet events at high transverse momentum in the TMD parton branching method at next-to-leading order”, Eur. Phys. J. C 82 (2022) 755, arXiv:2204.01528.
- [26] F. Hautmann et al., “A parton branching with transverse momentum dependent splitting functions”, Phys. Lett. B 833 (2022) 137276, arXiv:2205.15873.
- [27] B. R. Webber, “Monte Carlo Simulation of Hard Hadronic Processes”, Ann. Rev. Nucl. Part. Sci. 36 (1986) 253.
- [28] G. Marchesini and B. R. Webber, “Monte Carlo Simulation of General Hard Processes with Coherent QCD Radiation”, Nucl. Phys. B 310 (1988) 461.
- [29] S. Catani, B. R. Webber, and G. Marchesini, “QCD coherent branching and semiinclusive processes at large x”, Nucl. Phys. B 349 (1991) 635.
- [30] V. N. Gribov and L. N. Lipatov, “Deep inelastic scattering in perturbation theory”, Sov. J. Nucl. Phys. 15 (1972) 438. [Yad. Fiz.15,781(1972)].
- [31] L. N. Lipatov, “The parton model and perturbation theory”, Sov. J. Nucl. Phys. 20 (1975) 94. [Yad. Fiz.20,181(1974)].
- [32] G. Altarelli and G. Parisi, “Asymptotic freedom in parton language”, Nucl. Phys. B 126 (1977) 298.
- [33] Y. L. Dokshitzer, “Calculation of the structure functions for Deep Inelastic Scattering and annihilation by perturbation theory in Quantum Chromodynamics.”, Sov. Phys. JETP 46 (1977) 641. [Zh. Eksp. Teor. Fiz.73,1216(1977)].
- [34] F. Hautmann, L. Keersmaekers, A. Lelek, and A. M. Van Kampen, “Dynamical resolution scale in transverse momentum distributions at the LHC”, Nucl. Phys. B 949 (2019) 114795, arXiv:1908.08524.
- [35] ZEUS, H1 Collaboration, “Combination of measurements of inclusive deep inelastic scattering cross sections and QCD analysis of HERA data”, Eur. Phys. J. C 75 (2015) 580, arXiv:1506.06042.
- [36] xFitter Developers’ Team Collaboration, H. Abdolmaleki et al., “xFitter: An Open Source QCD Analysis Framework. A resource and reference document for the Snowmass study”, 6, 2022. arXiv:2206.12465.
- [37] S. Alekhin et al., “HERAFitter, Open Source QCD Fit Project”, Eur. Phys. J. C 75 (2015) 304, arXiv:1410.4412.
- [38] F. Hautmann et al., “TMDlib and TMDplotter: library and plotting tools for transverse-momentum-dependent parton distributions”, Eur. Phys. J. C 74 (2014), no. 12, 3220, arXiv:1408.3015.
- [39] N. A. Abdulov et al., “TMDlib2 and TMDplotter: a platform for 3D hadron structure studies”, Eur. Phys. J. C 81 (2021) 752, arXiv:2103.09741.
- [40] M. I. Abdulhamid et al., “Azimuthal correlations of high transverse momentum jets at next-to-leading order in the parton branching method”, Eur. Phys. J. C 82 (2022) 36, arXiv:2112.10465.
- [41] D. Amati et al., “A treatment of hard processes sensitive to the infrared structure of QCD”, Nucl. Phys. B173 (1980) 429.
- [42] A. Bassetto, M. Ciafaloni, and G. Marchesini, “Jet Structure and Infrared Sensitive Quantities in Perturbative QCD”, Phys. Rept. 100 (1983) 201–272.
- [43] A. M. van Kampen, “Drell-Yan transverse spectra at the LHC: a comparison of parton branching and analytical resummation approaches”, SciPost Phys. Proc. 8 (2022) 151, arXiv:2108.04099.
- [44] A. Bermudez Martinez et al. to be published.
- [45] H. Jung et al., “The Parton Branching evolution for collinear and TMD parton densities - uPDFevolv2”. to be published, 2023.
- [46] Z. Nagy and D. E. Soper, “Evolution of parton showers and parton distribution functions”, Phys. Rev. D 102 (2020), no. 1, 014025, arXiv:2002.04125.
- [47] S. Frixione and B. R. Webber, “Correcting for cutoff dependence in backward evolution of QCD parton showers”, arXiv:2309.15587.
- [48] M. Mendizabal, F. Guzman, H. Jung, and S. Taheri Monfared, “On the role of soft gluons in collinear parton densities”, arXiv:2309.11802.
- [49] S. Baranov et al., “CASCADE3 A Monte Carlo event generator based on TMDs”, Eur. Phys. J. C 81 (2021) 425, arXiv:2101.10221.
- [50] T. Sjöstrand, S. Mrenna, and P. Skands, “PYTHIA 6.4 physics and manual”, JHEP 05 (2006) 026, arXiv:hep-ph/0603175.
- [51] CMS Collaboration, “Measurement of the differential Drell-Yan cross section in proton-proton collisions at = 13 TeV”, JHEP 12 (2019) 059, arXiv:1812.10529.
- [52] A. Buckley et al., “Rivet user manual”, Comput. Phys. Commun. 184 (2013) 2803, arXiv:1003.0694.
- [53] CMS Collaboration, “Measurements of differential Z boson production cross sections in proton-proton collisions at = 13 TeV”, JHEP 12 (2019) 061, arXiv:1909.04133.
- [54] ATLAS Collaboration, “Measurement of the low-mass Drell-Yan differential cross section at = 7 TeV using the ATLAS detector”, JHEP 06 (2014) 112, arXiv:1404.1212.
- [55] CMS Collaboration, “Study of Final-State Radiation in Decays of Z Bosons Produced in Collisions at 7 TeV”, Phys. Rev. D 91 (2015) 092012, arXiv:1502.07940.
- [56] A. Bermudez Martinez, F. Hautmann, and M. L. Mangano, “Multi-jet merging with TMD parton branching”, JHEP 09 (2022) 060, arXiv:2208.02276.
- [57] A. Bermudez Martinez, F. Hautmann, and M. L. Mangano, “Multi-jet physics at high-energy colliders and TMD parton evolution”, 2021. arXiv:2109.08173.
- [58] LHCb Collaboration, “Precision measurement of forward boson production in proton-proton collisions at TeV”, JHEP 07 (2022) 026, arXiv:2112.07458.
- [59] L. Moureaux and I. Bubanja, “Fits with covariance matrices”. https://github.com/lmoureaux/CovarianceFits.
- [60] L. Corpe, “Correlations Library”. Contribution to yellow report of LHCEW working group: Jet and electroweak bosons, 2019.
- [61] ATLAS Collaboration, “Measurement of the transverse momentum and distributions of Drell–Yan lepton pairs in proton–proton collisions at TeV with the ATLAS detector”, Eur. Phys. J. C 76 (2016) 291, arXiv:1512.02192.
- [62] D0 Collaboration, “Measurement of the inclusive differential cross section for bosons as a function of transverse momentum in collisions at TeV”, Phys. Rev. D 61 (2000) 032004, arXiv:hep-ex/9907009.
- [63] CDF Collaboration, “The transverse momentum and total cross section of pairs in the boson region from collisions at TeV”, Phys. Rev. Lett. 84 (2000) 845, arXiv:hep-ex/0001021.
- [64] CDF Collaboration, “Transverse momentum cross section of pairs in the -boson region from collisions at TeV”, Phys. Rev. D 86 (2012) 052010, arXiv:1207.7138.
- [65] PHENIX Collaboration, “Measurements of pairs from open heavy flavor and Drell-Yan in collisions at GeV”, Phys. Rev. D 99 (2019) 072003, arXiv:1805.02448.
- [66] G. Moreno et al., “Dimuon production in proton - copper collisions at = 38.8 GeV”, Phys. Rev. D 43 (1991) 2815.
- [67] CMS Collaboration, “Study of Drell-Yan dimuon production in proton-lead collisions at 8.16 TeV”, JHEP 05 (2021) 182, arXiv:2102.13648.