The Variability of H Equivalent Widths in Be Stars
Abstract
Focusing on B-emission stars, we investigated a set of H equivalent widths calculated from observed spectra acquired over a period of about 4 years from 2003 to 2007. During this time, changes in equivalent width for our program stars were monitored. We have found a simple statistical method to quantify these changes in our observations. This statistical test, commonly called the F ratio, involves calculating the ratio of the external and internal error. We show that the application of this technique can be used to place bounds on the degree of variability of Be stars. This observational tool provides a quantitative way to find Be stars at particular stages of variability requiring relatively little observational data.
1 Introduction
Be (B emission) stars are characterized by the presence of Balmer emission lines in their spectra due to the presence of circumstellar material. Often the prominent observational feature is the H emission line, making this line a valuable feature to study. Accumulating evidence supports the view that this emission originates from a geometrically thin, circumstellar disk rotating with near-Keplerian velocity (see, for example Carciofi & Bjorkman (2006)).
Despite decades of study, the mechanism that forms and maintains these disks is not completely understood and this represents the main unsolved puzzle in this field of research. Certainly, rapid rotation plays a role but since it is generally accepted that Be star rotation rates are below critical, other mechanisms must contribute to the development of the disk.
Observations combined with detailed modeling are crucial to interpreting disk physical conditions such as density, temperature, chemical composition, etc. Constraints on these physical properties will allow dynamic models that can follow disk structure over time to be developed and tested with greater certainty.
Many Be stars are known to be variable and the study of this variability has had a long history (see the review paper by Porter & Rivinius (2003) for more details). The variability occurs over a wide range of time scales from periods much less than a day (Percy et al., 2002) to periods as long as decades (Okazaki, 1997). Observational evidence suggests that the early type Be stars exhibit more short-period variability compared with later types (see for example, Percy et al. (2004); Hubert & Floquet (1998)). Rivinius et al. (2003) demonstrated that the source of the short term variability is non-radial pulsation. Long period variability has been associated with disk growth or loss events (see for example, Wisniewski et al. (2010)) and cyclic changes due to disk density enhancements (Okazaki, 1997). A successful model must account for this observed variability. Therefore, it is crucial to observationally monitor the Be star/disk system at particular stages of variability, for example during a disk loss or disk growth event, if we hope to improve our understanding of these objects.
We have applied a statistical method to our observations in the H emitting region of Be stars to find and to classify particular systems based on their degree of variability. This method utilizes the ratio of external to internal error (E/I) and number of degrees of freedom of the system. This test is commonly known as the E/I test, F test or variance ratio. Please see Fisher et al. (1987) for more detail. Our application of the F test uses the equivalent width () of the H spectral line to place a quantitative bound on the degree of variability of a particular star/disk system and in doing so, allows one to determine if a particular system should be monitored more frequently. Basically, this method tests the null hypothesis so if the errors are equal then the ratio will be 1. In our case, a rejection of the null hypothesis means that the system is variable. We note that the F test has been used previously in astrophysics. For example, Garmany et al. (1980) used this test to search for binary systems in O stars.
This paper is organized as follows; the observations and data analysis can be found in Section 2, and the results in Section 3. A discussion including comparisons with previous studies is provided in Section 4. Section 5 summarizes our work.
2 Observations and Data Analysis
Spectroscopic observations of the 56 program stars were acquired between 2003 December and 2007 December at the Lowell Observatory’s 42-inch John S. Hall telescope (located near Flagstaff, Arizona) equipped with the Solar Stellar Spectrograph (SSS). The SSS instrument is an echelle spectrograph with a resolving power of 10,000 in the H region. The spectroscopic observations were processed using routines developed for the SSS instrument (Hall et al., 1994). There are a number of observations not included in the analysis where the flux at the emission line has been saturated due to an overexposure.
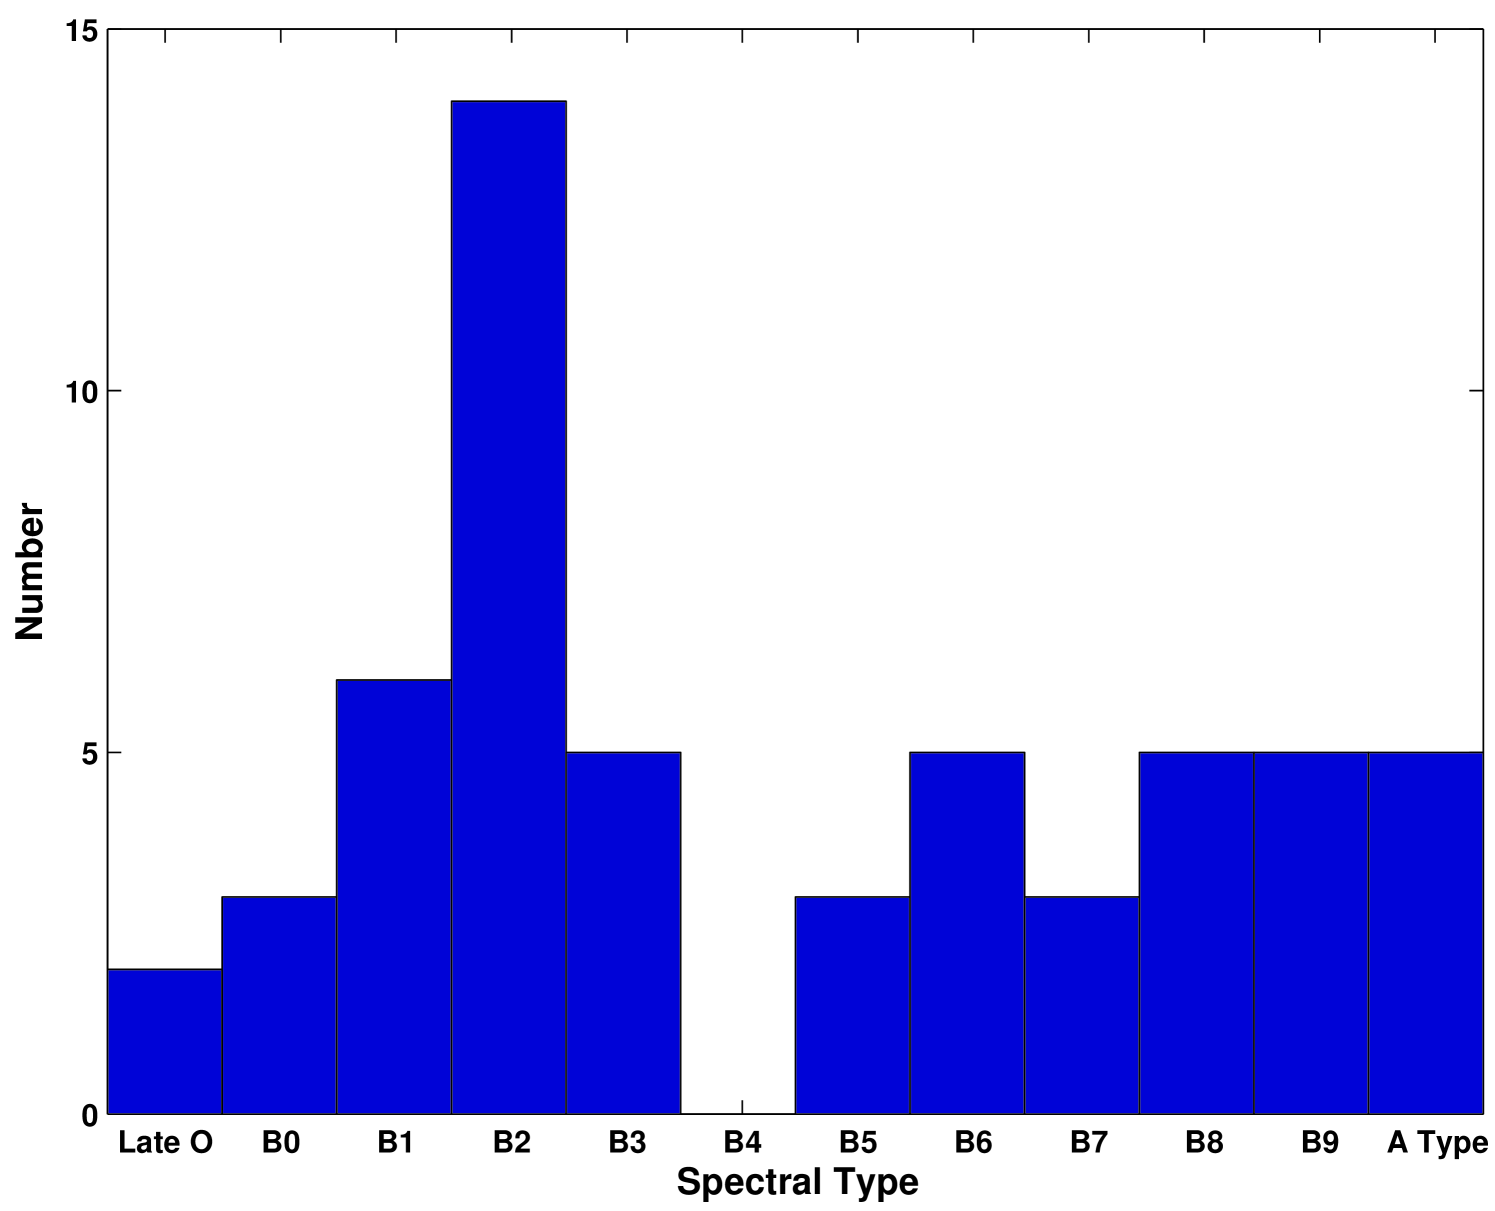
Two criteria were used to select the program stars; known Be stars that were brighter than approximately magnitude 5 in the V band, and those with declinations north of about to be accessible from the telescope at air-masses of less than 2. However, in order to include as many Be stars as possible, there were some exceptions. For example we included fainter Be stars with strong H emission and bright Be stars with declinations below the threshold. We note that 49 of the 56 program stars in this study are B spectral types, however five A-type stars and two late O-type stars that showed H emission were also included in the study. The full list of targets can be found in Table 1. Figure 1 shows the distribution of the program stars as a function of spectral type. Due to the difficulty of assigning spectral types for Be stars, there is likely considerable error in the spectral designation (and luminosity class) of particular stars (see Steele et al. (1999) for further discussion). We note that there are significantly more B2 stars compared with other types in the study. In fact, the B2 spectral types represent 25% of the program stars. This distribution of Be stars is typical of other studies. For example, figure 1 in Porter (1996) and figure 5 in Slettebak (1982) show this characteristic maximum for Be stars at spectral type B2.
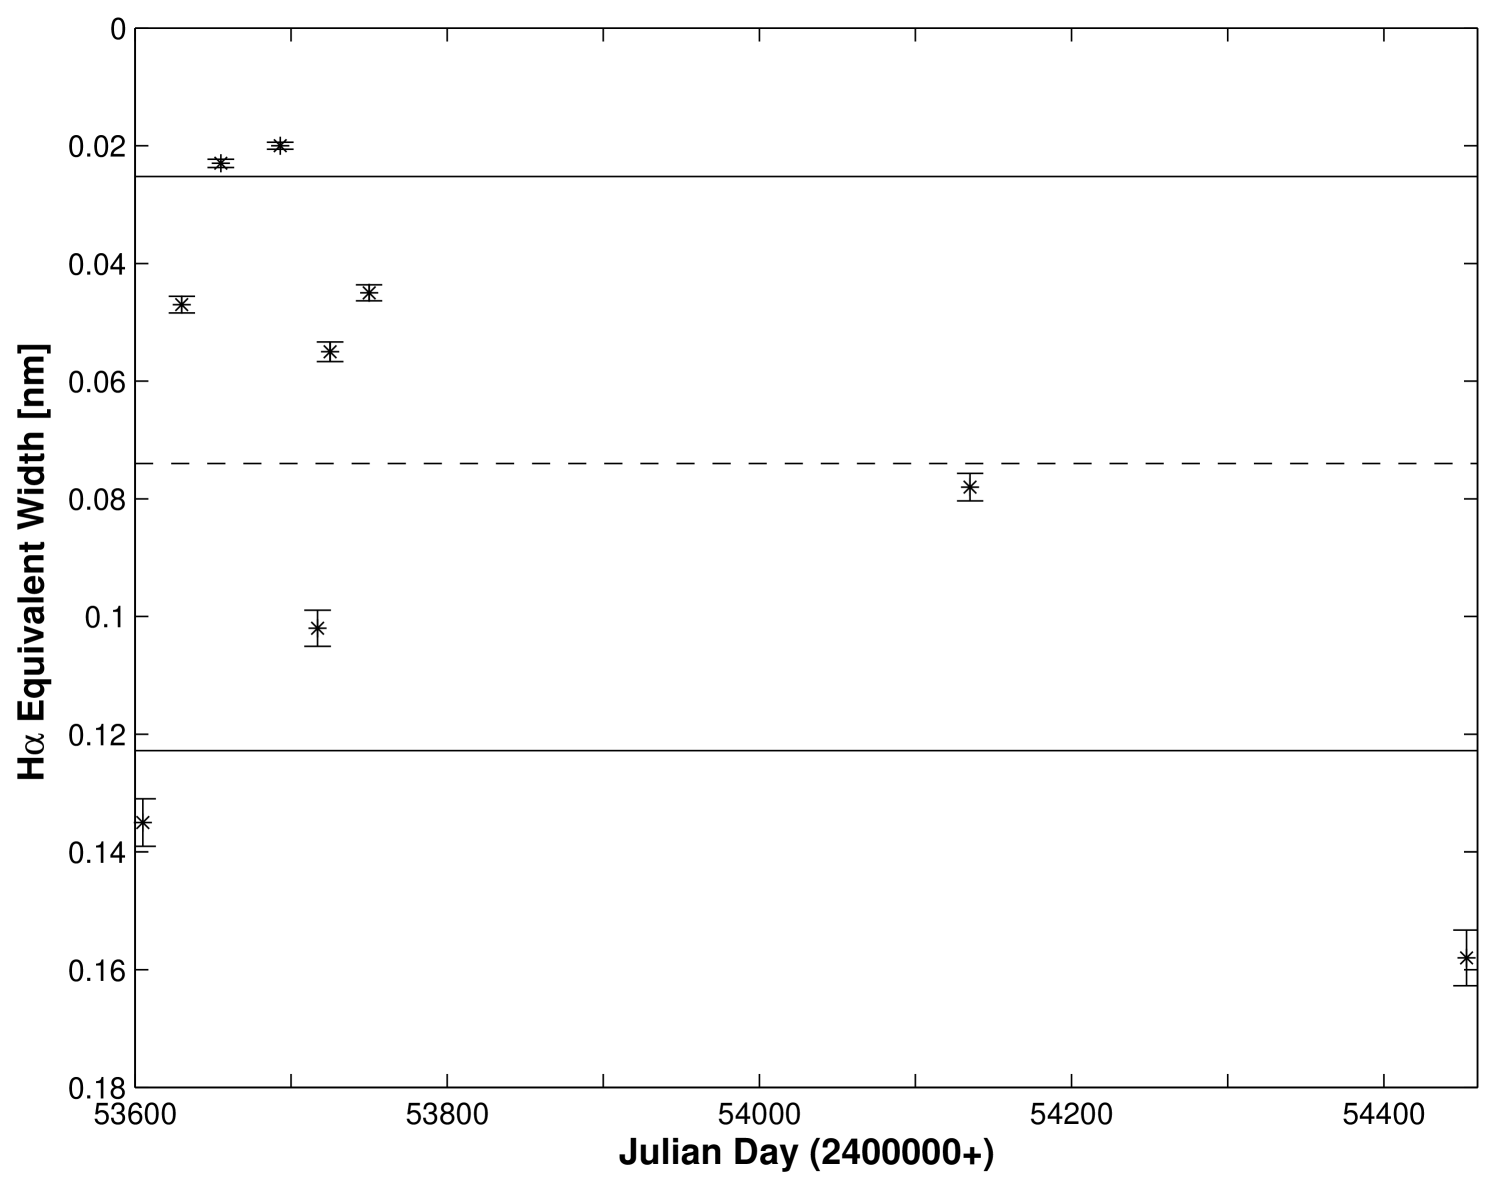
For each target, a plot showing the variation of H equivalent width () with time including the estimated error was constructed. An example of such a plot is shown in Figure 2 for the star 23 Tau (HR 1156). Each observation is shown along with its estimated error. Also shown in the plot is the mean , and the mean one standard deviation calculated based on all the samples. Throughout this paper, we follow the standard convention of denoting the of the H line as positive when observed in absorption and negative when in emission.
Technically the uncertainty of the is based on two sources of error; continuum normalization and the combination of photometric noise in the presence of telluric lines. The first and most dominant being the error associated with continuum normalization. Because the is measured with respect to the continuum, any scaling error in the level of the continuum translates directly to a multiplicative error in . Based on our experience on how well the continuum normalization can be performed, and how reproducible it is from exposure to exposure and from star to star, we estimate this source of error to be at the 3% level.
The second source of error in is related to the combination of photometric noise (which is low for most of our bright sources) and the presence of telluric lines. The telluric lines vary with the amount of atmospheric absorption, which not only changes during the night, but also from night to night (especially across different seasons) as the atmospheric conditions vary, mostly due to changes in the amount of water vapor. For example, we used spectra of the telluric standard Leo (HR 3982) to estimate the average impact of telluric lines across the H line. We analyzed ten spectra of Leo obtained on different nights and varying airmasses that were comparable to the typical conditions at which spectra of Be stars were obtained. We then fitted a smoothed Voigt profile to the absorption line to estimate the telluric component that contributed to the overall equivalent width of the H line. The telluric component in the H line of Leo (with an of 0.60 nm) ranged from 0.015 to 0.025 nm, which represents a fractional contribution of 2% to 4%. Therefore, we note that by ignoring the telluric contribution we might be underestimating the strength of the H emission in our program stars by as much as 4%, and we are not accounting for any possible additional variability that might be present due to changes in telluric line absorption at the 2% level.
Our tests to establish the telluric contribution in the H line showed that it was not possible to make a high precision telluric correction. Therefore, we concluded that utilizing the spectra we have accessible in our archival data set we cannot perform such a correction at the desired level. We do acknowledge that leaving the measures uncorrected for telluric contribution leaves the systematic effect of telluric absorption in our results. However, we choose not to increase the uncertainty of our results by applying a correction factor that can produce errors as large (if not larger) than the underlying contribution we are trying to correct for. Therefore, our estimate for the uncertainty associated with the measure is fixed at the 3% level.
When more than one observation was present for a given target star, we have also calculated the mean uncertainty
| (1) |
where is the uncertainty of the data point, and is the total number of spectra of a given target star. Similarly, the standard deviation of the sample was calculated using
| (2) |
in Equation 2 corresponds to the degree of freedom used for the test. Having obtained and allowed us to calculate a simple observable to assess the variability of a given target using a ratio of the form
| (3) |
This ratio along with the number of spectra allows a quantitative assessment to be assigned to the variability of a particular target in terms of the amount of change in the of H. Therefore, the emphasis of this work is subtly different than the focus of many studies in the literature that have focused on obtaining the period of the variability.
We have calculated the F ratio and corresponding confidence level for all our targets. The individual values are listed in Table 1. The confidence level, , takes into account the number of spectra available for each target. Therefore this column should be used assess the variability of a particular target. For example, for HR 193, the first star in Table 1, the ratio is 1.73 and is 0.86. This means that this source is variable at the 86% confidence level, or in other words this is the confidence level at which we conclude that the sample variance based on the entire set of spectra for HR 193 and the variance based on the mean uncertainty are different.
The program stars were also investigated for obvious trends in the H , such as increasing or decreasing over the duration of this study. In order to quantitatively assess a trend, we fit a line to each set of H s for a particular target. We calculated the slope and error from line fitting for each line. Since we are only interested in assessing the trend and not in the numerical value of the slope, observational errors were not included in the slope fitting. Also, for this analysis we did not include any stars for which only two observations were available. Table 2 lists the slope and the slope divided by the error for each target. Recall that since we have adopted the convention that emission corresponds to a negative , negative slopes correspond to an increase in H and vice versa. In order to help the reader assess these numbers, in the final column of Table 2, a trend of gain (G) or loss (L) in H is assigned to targets with a 3 detection or greater and are variable with a confidence of greater than 90%.
3 Results
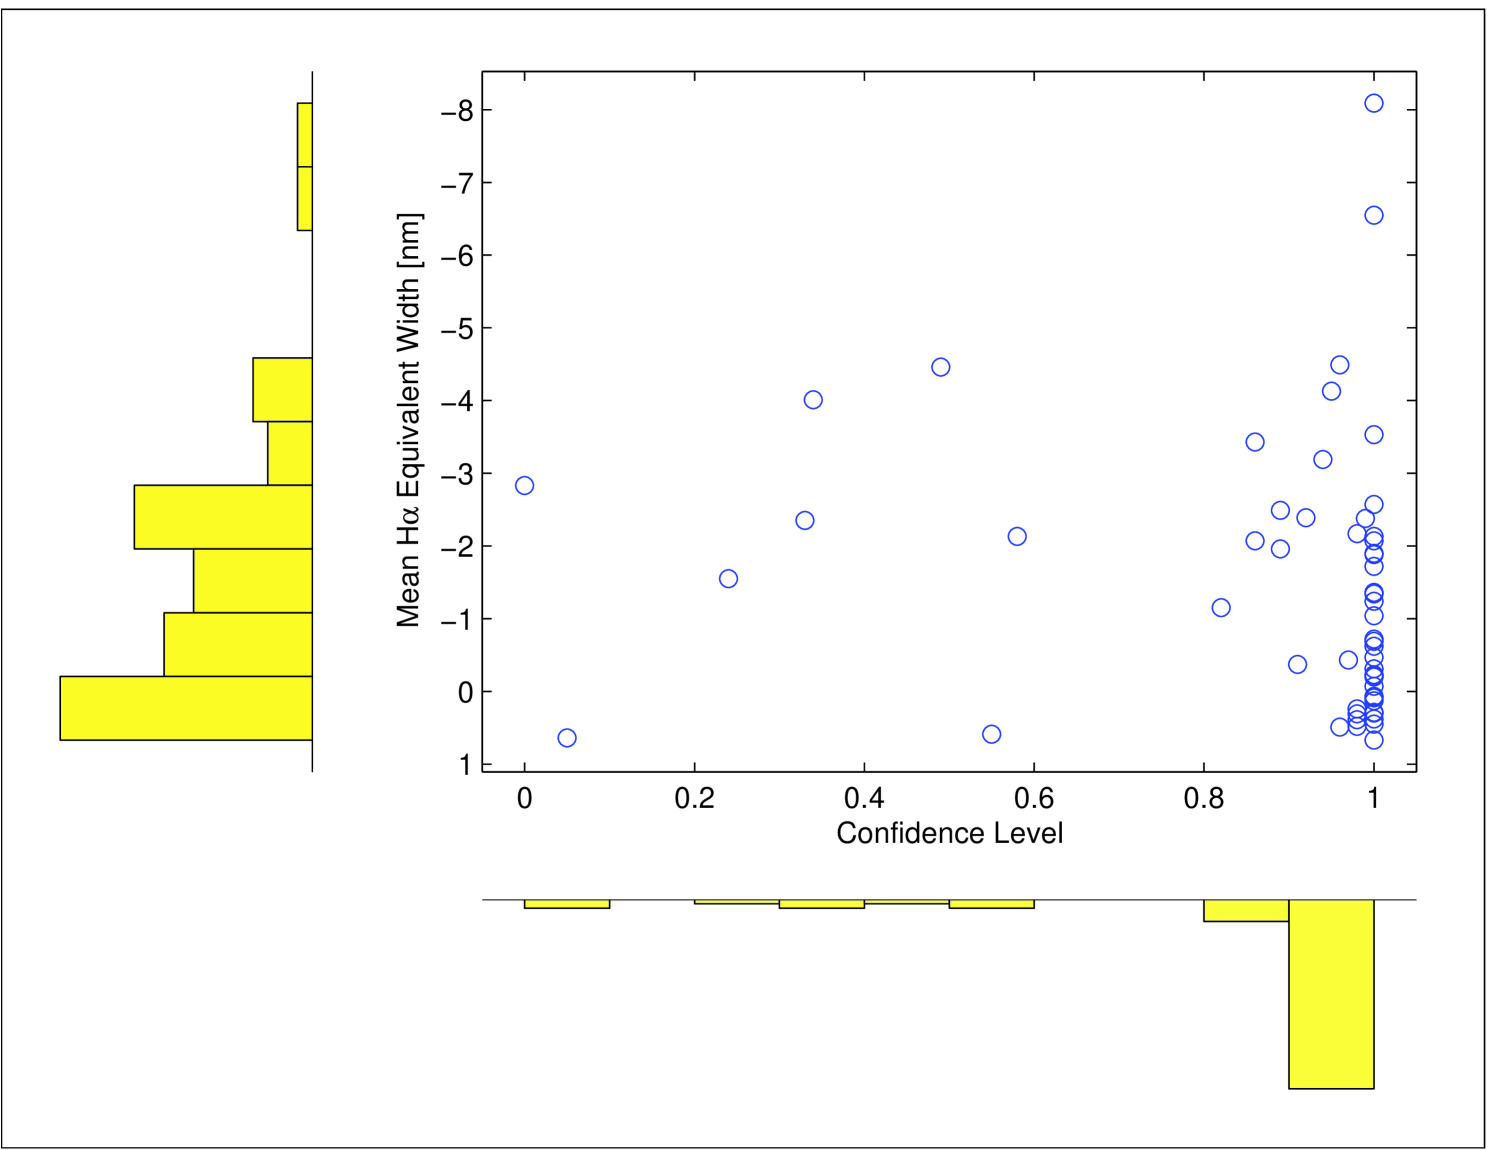
The value for each program star is plotted in Figure 3 and the frequency with which each value occurs is shown in the inverted histogram below the abscissa. The value of ranges from a minimum of 0 to a maximum of greater than 99%. Of the 56 targets analyzed, 77% of them were categorized as variable with a of 90% or greater. Only 11% of the program stars were variable with a confidence of less than 50%. Within this group of six targets, 4 had only 2 or 3 spectra obtained resulting in the low value of . The other two stars, Per (HR 1087) and 48 Per (HR 1273) have 17 and 18 spectra with of 34% and 0%, respectively. This points to the global stability of the H emitting region for these two systems.
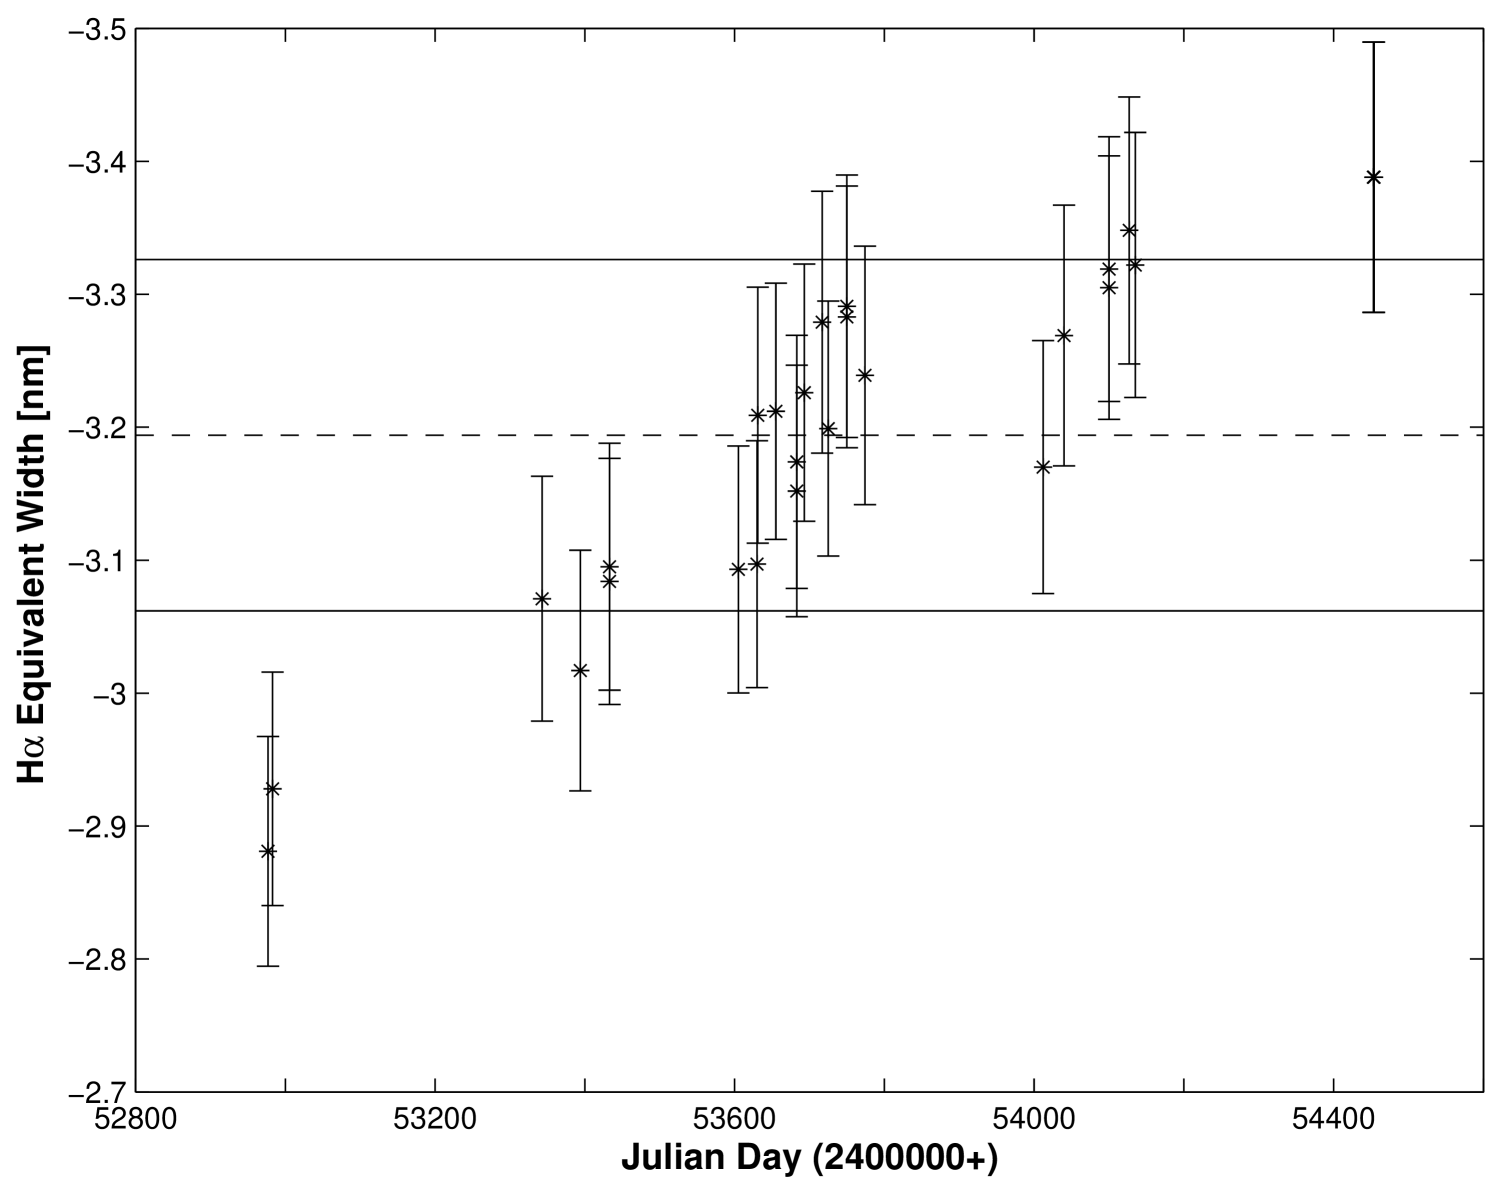
Figure 4 shows the plot of versus time for the early Be star, Cas (HR 264). The application of the F test reveals that this system is variable at the confidence level of 94%. We note that this star shows more moderate variations in the H ranging from a minimum of -2.88 nm to a maximum of -3.39 nm over the time it was monitored in our study. Despite these moderate variations in , the results from the line fitting analysis (shown Table 2) also allow us to designate this star as showing a definite H increasing trend (G) at the 12 level. This illustrates the point that the variability criteria using this statistical technique can be adjusted as needed, depending on the needs of a specific observing program.
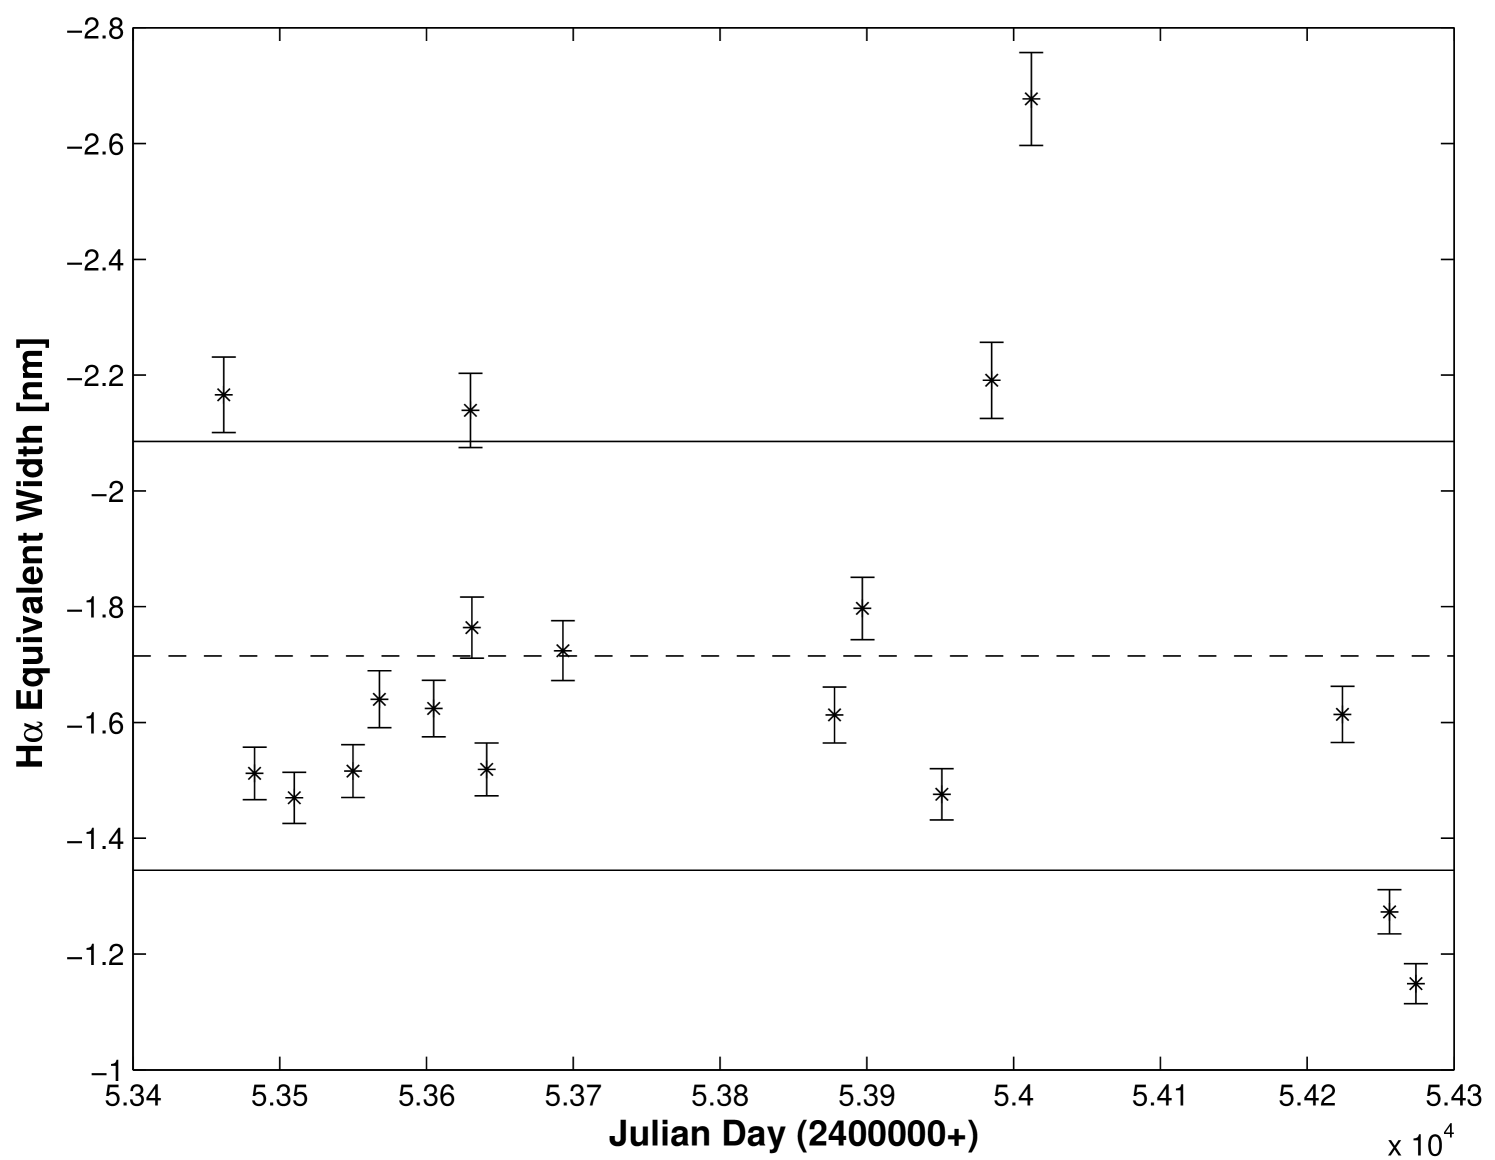
Lyr (HR 7106) is an example of a star that we find is variable with . The plot of versus time for this star is shown in Figure 5. The H ranges from a minimum of -1.15 nm to a maximum of -2.68 nm over the time it was monitored in this investigation. For this star, although it is certainly variable, we do not find an obvious trend in H (see Table 2). This designation does not necessarily mean that there is no periodicity; it simply means that there is no monotonically increasing or decreasing trend. Perhaps this should be expected based on the close binary nature of this source (Zhao et al., 2008; Schmitt et al., 2009). This star is a known interacting binary with an orbital period of 12.9421 days (Kreiner, 2004). The random (perhaps periodic) nature of this variability can be seen in Figure 5.
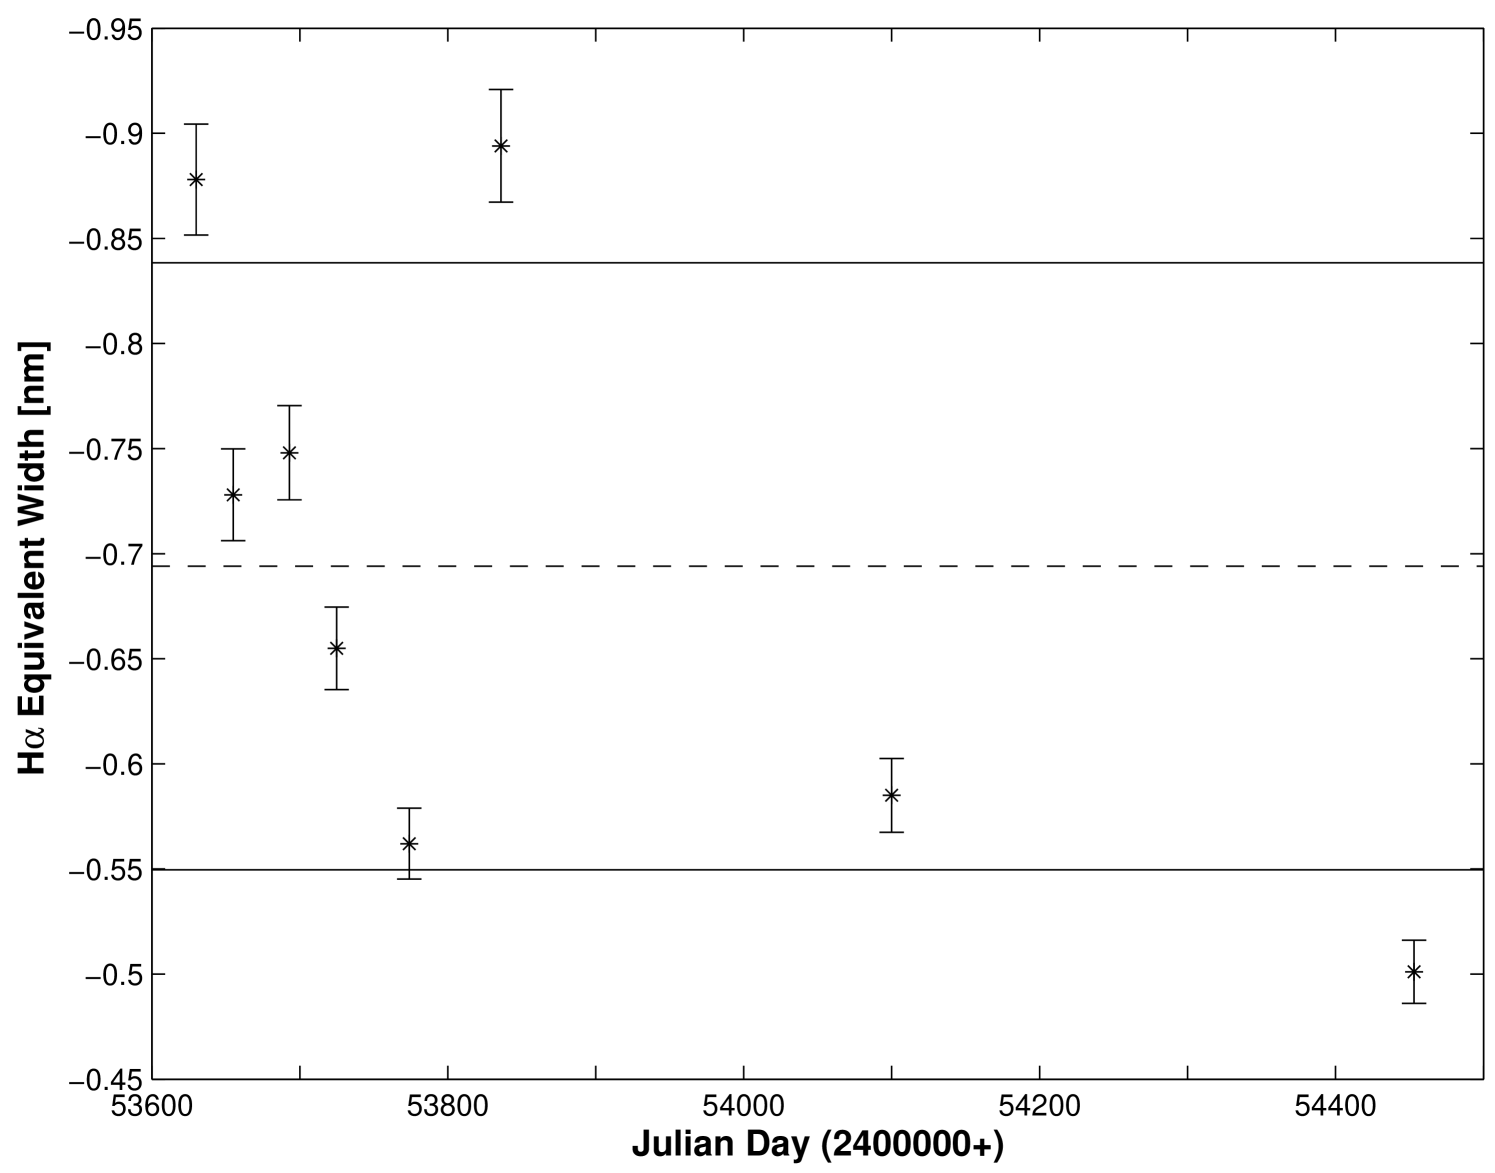
Figure 6 shows the plot of for the star Ori (HR 1934) and is another example of a variable star with . Overall, it may appear that there is a trend towards less negative numbers corresponding to a decrease in overall H emission. However, we were not able to make this claim at the 3 level and have chosen instead, to present the numbers in Table 2 and allow the reader to make their own assessment. This may be an example where more observations are required to determine whether this is a monotonic decreasing trend or whether this is periodic or random behavior.
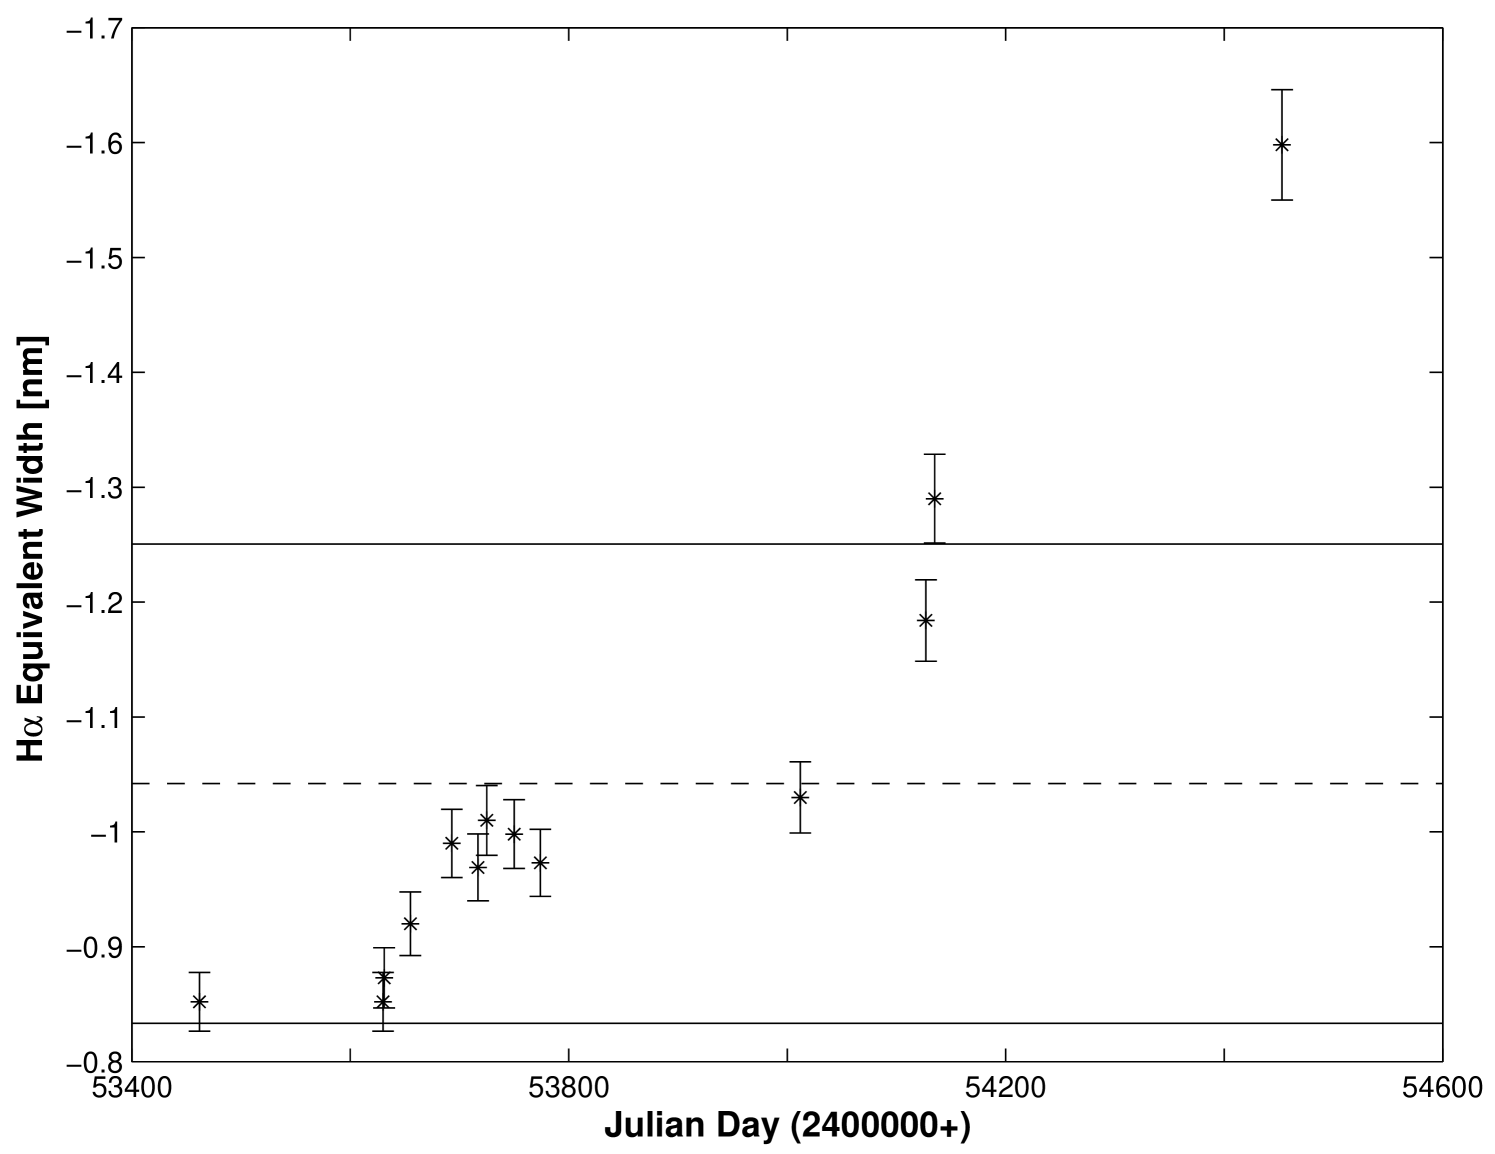
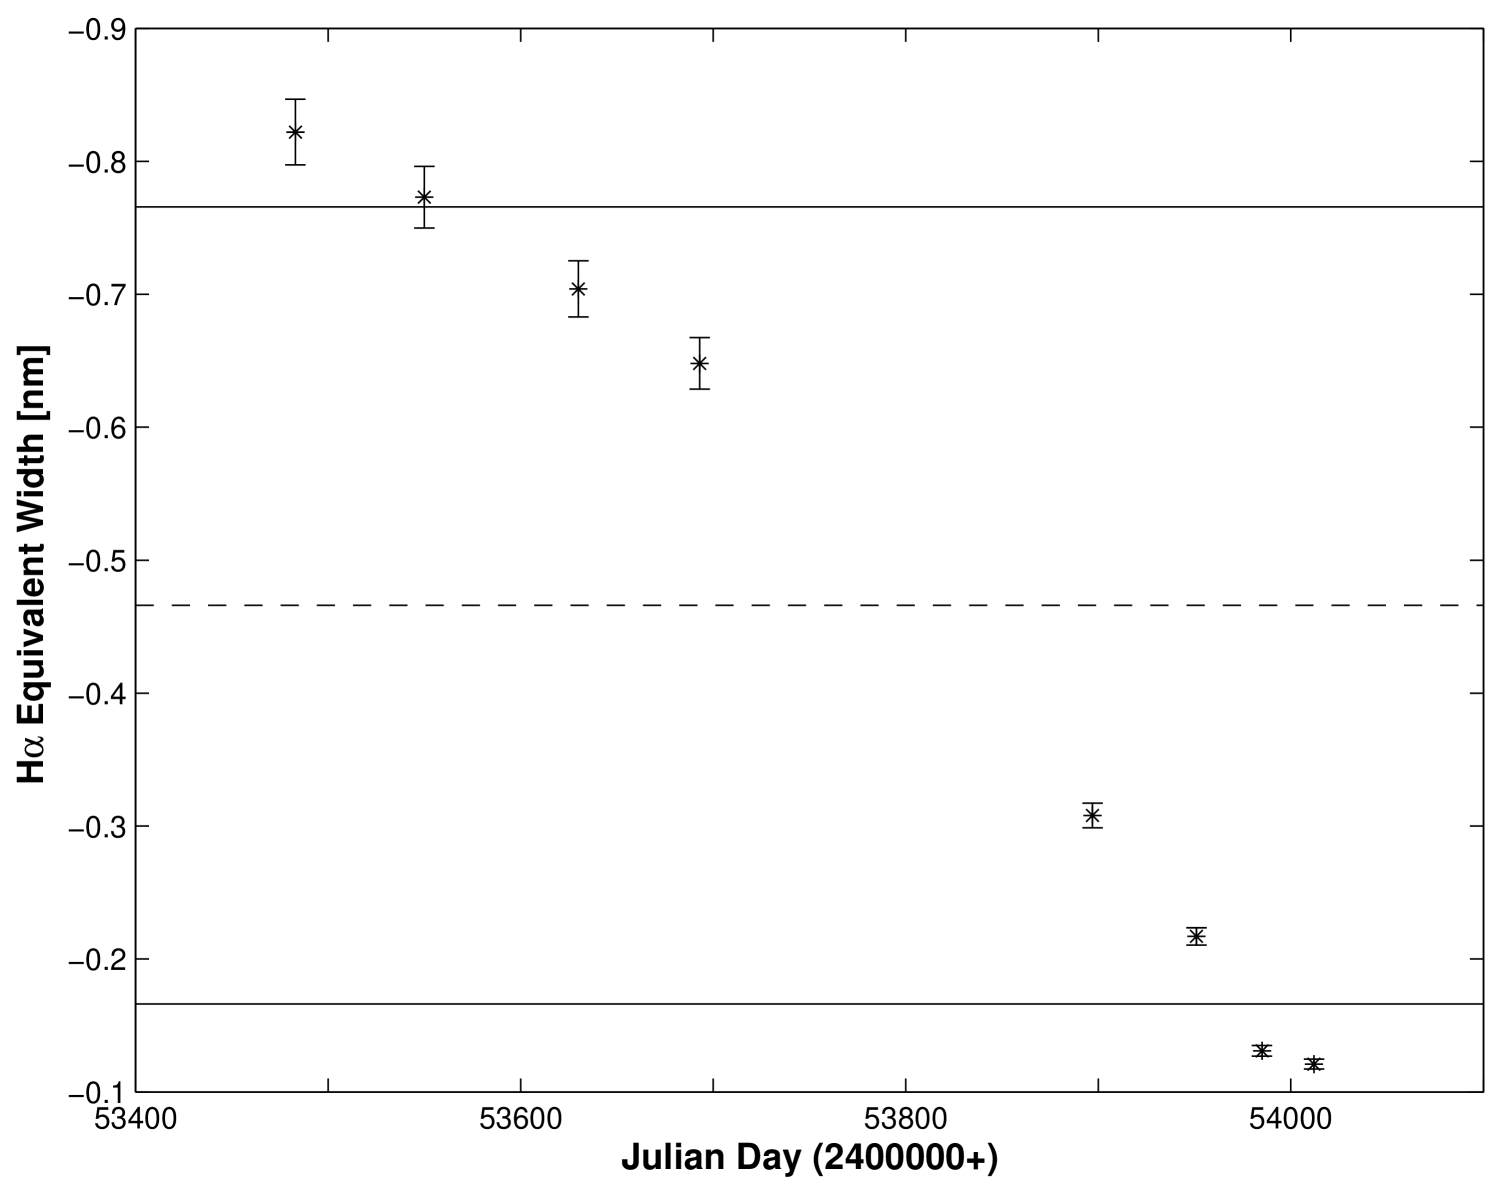
Figures 7 and 8, for the stars BK Cam (HR 985) and 28 Cyg (HR 7708), respectively, demonstrate further examples of stars that are variable with a confidence level of greater than 99%. Notice that the plot of versus time for BK Cam clearly shows an increasing trend in H over the duration of this study, whereas the plot for 28 Cyg shows a decreasing trend. The values presented in Table 2 support this interpretation.
4 Discussion
We have a number of stars in common with other studies of Be star variability including studies of photometric variability and line profile variations. While this study focuses specifically on changes in the H equivalent width, it is interesting to compare our results with properties others have found for the same stars. Rather than discuss every star we have in common with previous investigations, we have chosen a selection of some of the more interesting cases and cases that highlight similarities or differences between our study and other work in the literature. This discussion is provided to allow the reader to assess the value of this simple, but illuminating technique.
One of our program stars, CMa (HR 2749) has been previously studied by Rivinius et al. (2003), Maintz et al. (2003), and S̆tefl et al. (1999) and its’ line profile variability is well known. This star has been found to have a period of 1.5 days (Steele et al., 1999). For this particular star we only have three observations, and in combination with the fact that this star is variable on a relatively short time scale our ratio will be susceptible to sampling limitations. Not surprisingly our results fail to establish variability of this source, which is also reflected in a value of only 33%. We also note that it is possible to have changes in the shape of the H profile without affecting the value of the H equivalent width as long as increases or decreases in emission or absorption cancel out. For example, there could be a significant change in the V/R (violet to red) ratio where the reduction in due to a weaker V component is compensated by an increase in R, or vice versa. However, other program stars that vary on short time scales were captured by our technique. For example, Per (HR 496) is a known short period variable (Hubert & Floquet, 1998) and our study clearly identifies this star as variable with a confidence of . Furthermore, our line fitting technique (see Table 2) indicates that this system is undergoing a reduction in H emission. Neveretheless, CMa is a good example to illustrate the subtle difference in this technique compared with other studies. This tool is designed to capture changes in the H equivalent width. The H emitting region typically extends several stellar radii from the central star (Tycner et al., 2006). Large changes in H equivalent width will occur with variations in disk density, changes in optical depths that affect emission, or a change in the distribution of disk material. As such, our application of the F test is designed to identify systems that may be experiencing significant changes in their density and thermal structure.
For the Be star Cyg (HR 8146) we find that it is variable with a confidence of . This star was previously identified as having long period variability by Hubert & Floquet (1998) and also was noted as variable by Percy et al. (2002). Hubert & Floquet (1998) mention that this star exhibited a strong increase in brightness followed by a very slow decline over 400 days. Percy et al. (2002) correlate the amplitude of the short period variations with possible disk growth and loss suggested by changes in brightness over a longer term. Our technique agrees with and reflects the nature of the variability for this star.
Large changes in H equivalent width have been noted in the literature for 66 Oph (HR 6712). Peters (1989, 1992, 1994); Hanuschik et al. (1996) and Hubert & Floquet (1998) all report large changes, with Hipparcos also showing 3 large outbursts (Hubert & Floquet, 1998). We find that his star is variable with . Our result is in clear agreement with these studies. Furthermore, we find that during the time of our observations that the H for 66 Oph was undergoing a decreasing trend. Similarly Ori (HR 1934) has been noted to exhibit recurrent outbursts (Peters, 1996). We find that this star is variable at . As expected, our technique captures the change expected due to these large outbursts.
Hubert & Floquet (1998) find that larger amplitudes of light variability using Hipparcos photometry are found more often in the early Be stars (33% of B0-B2e) compared with late types (10% B7-B9e). Hubert & Floquet (1998) do have a larger set of stars but a comparison of their figure 1 with our Figure 1 shows the number distribution for both studies as of function of spectral type are quite similar. Their finding is consistent with our statistics especially considering that we expect our technique to be most sensitive to significant changes in the disk density. We find 55% of our sample is variable with confidence of 99% or greater. Within this group of variable stars, 45% are early Be stars (B0-B2) while 29% are late-type (B7-B9).
We also considered whether or not the application of the F test may be biased toward finding variability with a high confidence level for stars with particularly strong H emission. Figure 3 (discussed above) also shows the correlation of versus . It is clear that stars represented by variability with the highest confidence of greater than 90% exhibit a substantial range in the strength of H . In fact, as shown in Figure 3 the highest values of have the greatest proportion of stars with weak emission. This supports the view that this simple statistical technique can be used to effectively to find Be stars at particular stages.
5 Summary
We have investigated, a simple but quantitative way to determine whether a Be star is variable based on measurements of the H emission line. Since the H spectral line is often the most prominent feature in Be star spectra, the H spectra are often easy to obtain through new observations or are often available in the literature. Our application of the F test based on and , provides a simple quantitative assessment about the change in the of H for an object. This technique can be used to find Be stars in particular stages of variability or alternatively can be used to determine when a star/disk system is changing and needs to be monitored closely. The specific connection between photometric variability and changes in H equivalent width remains unclear and improvements in understanding Be star variability is key to the development and testing of dynamical models (Hubert & Floquet, 1998). We should also mention that our measurements do not differentiate from line emission changes or continuum changes and either of these could result in changes in measure.
A prerequisite to the development of successful dynamical models will be timely observations that adequately sample the disk-loss, and disk-growth events of classical Be stars. McSwain et al. (2009) studied Be stars in southern open clusters and found 12 new Be stars that transitioned between B and Be phases, clear evidence that it is possible to find reasonably sized samples to investigate particular evolutionary stages. These transition phases were recently investigated using spectropolarimetric data for the Be stars, Aquarii and 60 Cygni by Wisniewski et al. (2010). Aqr (HR 8539) is one of our program stars that we find variable. We also find a trend in decreasing H during our study (see Table 2). Interestingly, Wisniewski et al. (2010) find that during one of the disk loss phases there were two extended outburst events. These events seemed to halt the disk loss phase for some time. We have a significant data set for Aqr, and the most recent spectra we obtained, suggests that the H may be starting to increase again. It is clear that observations acquired at particular stages are key to improving our understanding of Be stars and their intrinsic variability.
| HR # | HD # | Name | Spectral Type | # | [nm] | F value | aaConfidence level of the detected variability based on the ratio of the variances. |
|---|---|---|---|---|---|---|---|
| 193 | 4180 | o Cas | B5IIIe | 18 | -3.43 | 1.73 | 0.86 |
| 264 | 5394 | Cas | B0IVe | 26 | -3.19 | 1.90 | 0.94 |
| 335 | 6811 | And | B7Ve | 13 | 0.13 | 35.40 | 0.99 |
| 496 | 10516 | Per | B2Vpe | 20 | -3.53 | 7.19 | 0.99 |
| 11606 | V777 Cas | B2Vne | 2 | -1.96 | 30.61 | 0.89 | |
| 936 | 19356 | Per | B8V | 13 | 0.67 | 11.39 | 0.99 |
| 19243 | V801 Cas | B1Ve | 3 | -4.49 | 23.81 | 0.96 | |
| 985 | 20336 | BK Cam | B2.5Vne | 13 | -1.04 | 44.59 | 0.99 |
| 1087 | 22192 | Per | B5Ve | 17 | -4.01 | 0.81 | 0.34 |
| 1142 | 23302 | 17 Tau | B6IIIe | 11 | 0.39 | 4.26 | 0.98 |
| 1156 | 23480 | 23 Tau | B6IVe | 9 | 0.07 | 486.89 | 0.99 |
| 1165 | 23630 | Tau | B7IIIe | 11 | -0.31 | 12.24 | 0.99 |
| 1180 | 23862 | 28 Tau | B8IVevar | 12 | -2.07 | 144.37 | 0.99 |
| 1209 | 24534 | X Per | O9.5pe | 4 | -2.38 | 23.68 | 0.99 |
| 1261 | 25642 | 47 Per | A0IVn | 2 | 0.64 | 0.01 | 0.05 |
| 1273 | 25940 | 48 Per | B3Ve | 18 | -2.83 | 0.26 | 0.00 |
| 1508 | 30076 | 56 Eri | B2Ve | 3 | -4.13 | 17.73 | 0.95 |
| 1605 | 31964 | Aur | A8Iab | 6 | 0.09 | 84.16 | 0.99 |
| 1622 | 32343 | 11 Cam | B2.5Ve | 9 | -2.39 | 2.90 | 0.92 |
| 1660 | 32991 | 105 Tau | B3Ve | 2 | -4.46 | 0.94 | 0.49 |
| 1789 | 35439 | 25 Ori | B1Ve | 6 | -1.34 | 34.42 | 0.99 |
| 1910 | 37202 | Tau | B2IVe | 38 | -1.90 | 26.55 | 0.99 |
| 1934 | 37490 | Ori | B2IIIe | 8 | -0.69 | 48.13 | 0.99 |
| 2148 | 41511 | 17 Lep | Apsh | 4 | 0.45 | 121.60 | 0.99 |
| 2343 | 45542 | . Gem | B6IIIe | 13 | -0.07 | 57.93 | 0.99 |
| 2538 | 50013 | CMa | B1.5IVe | 4 | -2.17 | 18.41 | 0.98 |
| 2749 | 56139 | CMa | B2IV - Ve | 3 | -2.35 | 0.50 | 0.33 |
| 2845 | 58715 | Cmi | B8Ve | 22 | -0.20 | 18.34 | 0.99 |
| 3034 | 63462 | o Pup | B1IV:nne | 2 | -1.55 | 0.16 | 0.24 |
| 4696 | 107348 | 5 Crv | B8V | 9 | -0.37 | 2.69 | 0.91 |
| 4787 | 109387 | Dra | B6IIIpe | 21 | -2.13 | 1.10 | 0.58 |
| 141569 | B9.5e | 6 | 0.30 | 22.22 | 0.99 | ||
| 5938 | 142926 | 4 Her | B9pe | 6 | -0.21 | 82.39 | 0.99 |
| 5941 | 142983 | 48 Lib | B3Ia/Iab | 13 | -2.49 | 2.07 | 0.89 |
| 5953 | 143275 | Sco | B0.2IVe | 37 | -1.88 | 126.29 | 0.99 |
| 6118 | 148184 | Oph | B2Vne | 20 | -6.55 | 11.51 | 0.99 |
| 6397 | 155806 | V1075 Sco | O8Ve | 4 | -0.43 | 15.34 | 0.97 |
| 6519 | 158643 | 51 Oph | A0V | 7 | 0.31 | 7.04 | 0.98 |
| 6712 | 164284 | 66 Oph | B2Ve | 15 | -0.72 | 125.11 | 0.99 |
| 6779 | 166014 | o Her | B9.5V | 6 | 0.59 | 1.13 | 0.55 |
| 7040 | 173370 | 4 Aql | B9V | 5 | 0.24 | 10.29 | 0.98 |
| 7106 | 174638 | Lyr | B7Ve+… | 18 | -1.72 | 51.82 | 0.99 |
| 179218 | MWC 614 | B9e | 3 | -0.38 | 801.34 | 0.99 | |
| 7708 | 191610 | 28 Cyg | B2.5Ve | 8 | -0.47 | 460.73 | 0.99 |
| 7739 | 192685 | QR Vul | B3Ve | 5 | 0.29 | 638.97 | 0.99 |
| 7763 | 193237 | P CygbbThis star is a Luminous Blue Variable, LBV. | B2pe | 62 | -8.09 | 3.60 | 0.99 |
| 7836 | 195325 | 1 Del | A1she… | 5 | 0.49 | 7.15 | 0.96 |
| 7963 | 198183 | Cyg | B5Ve | 6 | 0.48 | 8.54 | 0.98 |
| 8047 | 200120 | 59 Cyg | B1.5Vnne | 7 | -1.24 | 12.10 | 0.99 |
| 8146 | 202904 | Cyg | B2Vne | 18 | -2.57 | 5.62 | 0.99 |
| 8260 | 205637 | Cap | B3V:p | 6 | -0.23 | 153.86 | 0.99 |
| 206773 | B0Vpe | 2 | -1.15 | 11.47 | 0.82 | ||
| 8402 | 209409 | o Aqr | B8IVe | 12 | -2.07 | 1.97 | 0.86 |
| 8520 | 212076 | 31 Peg | B2IV - Ve | 11 | -2.13 | 39.00 | 0.99 |
| 8539 | 212571 | Aqr | B1Ve | 11 | -0.62 | 146.25 | 0.99 |
| 8773 | 217891 | Psc | B6Ve | 15 | -1.36 | 27.42 | 0.99 |
| HR # | HD # | Name | Slope | Slope/Uncertainty | Trend |
|---|---|---|---|---|---|
| 193 | 4180 | o Cas | -0.000441 | -8.076 | - |
| 264 | 5394 | Cas | -0.000329 | -11.592 | G |
| 335 | 6811 | And | 1.206e-05 | 0.442 | - |
| 496 | 10516 | Per | 0.000709 | 4.072 | L |
| 936 | 19356 | Per | .00010 | 1.369 | - |
| 19243 | V801 Cas | 0.001634 | 9.682 | L | |
| 985 | 20336 | BK Cam | -0.000723 | -10.026 | G |
| 1087 | 22192 | Per | -0.000361 | -10.00 | - |
| 1142 | 23302 | 17 Tau | -6.98e-05 | -4.525 | G |
| 1156 | 23480 | 23 Tau | 9.64e-05 | 1.805 | - |
| 1165 | 23630 | Tau | -2.32e-05 | -0.956 | - |
| 1180 | 23862 | 28 Tau | 0.0027 | 9.795 | L |
| 1209 | 24534 | X Per | -0.000959 | -3.842 | G |
| 1273 | 25940 | 48 Per | -7.03e-05 | -2.207 | - |
| 1508 | 30076 | 56 Eri | -0.0013 | -3.350 | G |
| 1605 | 31964 | Aur | -6.21e-05 | -1.157 | - |
| 1622 | 32343 | 11 Cam | 0.000353 | 4.091 | L |
| 1789 | 35439 | 25 Ori | -0.000457 | -1.633 | - |
| 1910 | 37202 | Tau | 6.50e-05 | 0.579 | - |
| 1934 | 37490 | Ori | 0.000335 | 2.125 | - |
| 2148 | 41511 | 17 Lep | 0.000390 | 1.111 | - |
| 2343 | 45542 | . Gem | -3.712e-05 | 2.722 | - |
| 2538 | 50013 | CMa | 0.000272 | 0.069 | - |
| 2749 | 56139 | CMa | 8.16e-05 | 0.473 | - |
| 2845 | 58715 | Cmi | -1.304e-05 | -0.804 | - |
| 4696 | 107348 | 5 Crv | -3.22e-05 | -1.536 | - |
| 4787 | 109387 | Dra | 0.000159 | 4.602 | - |
| 141569 | 0.000849 | 2.790 | - | ||
| 5938 | 142926 | 4 Her | 0.000160 | 3.421 | L |
| 5941 | 142983 | 48 Lib | -0.000278 | -5.844 | - |
| 5953 | 143275 | Sco | 0.0018 | 10.650 | L |
| 6118 | 148184 | Oph | 0.0012 | 2.35 | - |
| 6397 | 155806 | V1075 Sco | -0.000157 | -1.318 | - |
| 6519 | 158643 | 51 Oph | 4.263e-05 | 1.042 | - |
| 6712 | 164284 | 66 Oph | 0.000696 | 7.471 | L |
| 6779 | 166014 | o Her | 2.304e-05 | 0.801 | - |
| 7040 | 173370 | 4 Aql | 6.832e-05 | 3.88 | L |
| 7106 | 174638 | Lyr | 0.000187 | 0.560 | - |
| 179218 | MWC 614 | -0.0019 | -16.310 | G | |
| 7708 | 191610 | 28 Cyg | 0.0014 | 18.74 | L |
| 7739 | 192685 | QR Vul | 0.000257 | 0.573 | - |
| 7763 | 193237 | P Cyg | -0.000641 | -4.154 | - aaWe chose not to designate this star as increasing since we obtained a large number of spectra on 2 nights which may have biased the slope. |
| 7836 | 195325 | 1 Del | -5.03e-05 | -0.681 | - |
| 7963 | 198183 | Cyg | -6.55e-5 | -0.791 | - |
| 8047 | 200120 | 59 Cyg | -0.00027 | -2.146 | - |
| 8146 | 202904 | Cyg | 0.00038 | 2.876 | - |
| 8260 | 205637 | Cap | -0.0002 | 0.776 | - |
| 8402 | 209409 | o Aqr | 3.62e-05 | 0.385 | - |
| 8520 | 212076 | 31 Peg | -0.0013 | -5.54 | G |
| 8539 | 212571 | Aqr | 0.00076 | 5.36 | L |
| 8773 | 217891 | Psc | 0.0008 | 12.4 | G |
References
- Carciofi & Bjorkman (2006) Carciofi, A. C., & Bjorkman, J. E. 2006, ApJ, 639, 1081
- Fisher et al. (1987) Fisher, N. I., Lewis, T., & Embleton, B. J. J. 1987, Statistical analysis of spherical data, Cambridge University Press, UK, p.79
- Garmany et al. (1980) Garmany, C. D., Conti, P. S., & Massey, P. 1980, ApJ, 242, 1063
- Hall et al. (1994) Hall, J. C., Fulton, E. E., Huenemoerder, D. P., Welty, A. D., & Neff, J. E. 1994, PASP, 106, 315
- Hanuschik et al. (1996) Hanuschik, R. W., Hummel, W., Sutorius, E., Dietle, O., & Thimm, G. 1996, A&AS, 116, 309
- Hubert & Floquet (1998) Hubert, A. M., & Floquet, M. 1998, A&A, 335, 565
- Kreiner (2004) Kreiner, J. M. 2004, Acta Astronomica, 54, 207
- Maintz et al. (2003) Maintz, M., Rivinius, Th., S̆tefl, S., Baade, D., Wolf, B., & Townsend, R. H. D. 2003, A&A, 411, 181
- McSwain et al. (2009) McSwain, M. V., Huang, W., & Gies, D. R. 2009, ApJ, 700, 1216
- Okazaki (1997) Okazaki, A. T. 1997, A&A, 318, 548
- Percy et al. (2002) Percy, J. R., Hosick, J., Kincaide, H., & Pang, C. 2002, PASP, 114, 551
- Percy et al. (2004) Percy, J. R., Harlow, C. D. W., & Wu, A. P. S. 2004, PASP, 116, 178
- Peters (1989) Peters, G. 1989, Be Star Newsletter 21, 9
- Peters (1992) Peters, G. 1992, Be Star Newsletter 25, 10
- Peters (1994) Peters, G. 1994, Be Star Newsletter 27, 13
- Peters (1996) Peters, G. 1994, Be Star Newsletter 31, 17
- Porter (1996) Porter, J. M. 1996, MNRAS, 280, L31
- Porter & Rivinius (2003) Porter, J. M., & Rivinius, T. 2003, PASP, 115, 1153
- Rivinius et al. (2003) Rivinius, Th., Baade, D., & S̆tefl, S. 2003, A&A, 411, 229
- Schmitt et al. (2009) Schmitt, H. R., Pauls, T. A., Tycner, C., Armstrong, J. T., Zavala, R. T., Benson, J. A., Gilbreath, G. C., Hindsley, R. B., Hutter, D. J., Johnston, K. J., Jorgensen, A. M., & Mozurkewich, D. 2009, ApJ, 691, 984
- Slettebak (1982) Sletteback, A., ApJS, 50,55
- S̆tefl et al. (1999) S̆tefl, S., Aerts, C., & Balona, L. 1999, MNRAS, 305, 505
- Steele et al. (1999) Steele, I. A., Negueruela, I., & Clark, J. S. 1999, A&AS, 137, 147
- Tycner et al. (2006) Tycner, Christopher, Gilbreath, G. C., Zavala, R. T., Armstrong, J. T., Benson, J. A., Hajian, Arsen R., Hutter, D. J., Jones, C. E., Pauls, T. A., & White, N. M. 2006, AJ, 131, 2710
- Wisniewski et al. (2010) Wisniewski, J. P., Draper, Z. H., Bjorkman, K. S., Meade, M. R., Bjorkman, J. E., & Kowalski, A. F., 2010, ApJ, 709, 1306
- Zhao et al. (2008) Zhao, M., Gies, D., Monnier, J. D., Thureau, N., Pedretti, E., Baron, F., Merand, A., ten Brummelaar, T., McAlister, H., Ridgway, S. T., Turner, N., Sturmann, J., Sturmann, L., Farrington, C., & Goldfinger, P. J. 2008, ApJ, 684, L95