Theoretical light curve models of the symbiotic nova CN Cha — Optical flat peak for three years
Abstract
CN Cha is a slow symbiotic nova characterized by a three-years-long optical flat peak followed by a rapid decline. We present theoretical light curves for CN Cha, based on hydrostatic approximation, and estimate the white dwarf (WD) mass to be for a low metal abundance of . This kind of flat peak novae are border objects between classical novae having a sharp optical peak and extremely slow novae, the evolutions of which are too slow to be recognized as a nova outburst in human timescale. Theoretically, there are two types of nova envelope solutions, static and optically-thick wind, in low mass WDs (). Such a nova outburst begins first in a hydrostatic manner, and later it could change to an optically-thick wind evolution due to perturbation by the companion star in the nova envelope. Multiple peaks are a reflection of the relaxation process of transition. CN Cha supports our explanation on the difference between long-lasted flat peak novae like CN Cha and multiple peak novae like V723 Cas, because the companion star is located far outside, and does not perturb, the nova envelope in CN Cha.
1 Introduction
CN Cha is a galactic symbiotic nova outbursted in late 2012 or early 2013. It was identified as a Mira variable (Hoffmeister, 1963) long before the outburst. The outburst shows a stable flat peak at mag that lasted three years followed by a rapid decline. Lancaster et al. (2020) summarized observational information in literature and database and made a comprehensive light curve (see their Figure 2). They also presented an optical/near IR spectrum taken on UT 2019 March 12 that shows emission lines including P-Cygni profiles. The light curve of CN Cha resembles the eight-years-long flat peak of the symbiotic nova PU Vul.
CN Cha is located one kpc below the galactic plane for the Gaia early Data Release 3 (Gaia eDR3) distance of kpc (Bailer-Jones et al., 2021). Lancaster et al. (2020) presented a possible historical orbit in the Galaxy and concluded that this star is most likely a thick disk component star of Gyr old. Note that wind mass loss is systematically weaker and their evolutions are slower in Population II novae (Kato et al., 2013) than in Population I novae (e.g., Della Valle, 2002, for a summary).
A long-lasted flat-peak rarely appears among a number of novae, whereas many show a sharp optical maximum (e.g., Strope et al., 2010). A flat peak in novae is theoretically explained as follows:
A nova is a thermonuclear runaway event on a mass-accreting white dwarf (WD) (Nariai et al., 1980; Iben, 1982; Prialnik et al., 1986; Prialnik & Kovetz, 1995; Sion et al., 1979; Sparks et al., 1978; Kato et al., 2017). Once hydrogen shell burning begins, a hydrogen-rich envelope atop the WD expands to a giant size. Strong optically-thick winds are accelerated (Kato & Hachisu, 1994) that blow off a large part of the envelope. The nova evolves fast to reach its optical maximum and immediately enters the decay phase. This wind mass loss accelerates the nova evolution and, as a result, stronger wind mass-loss makes a sharper maximum in the optical light curve (e.g., Hachisu et al., 2020).
In general, the wind is stronger in more massive WDs and/or larger heavy element enrichment (Hachisu & Kato, 2010; Kato et al., 2013). On the other hand, in less massive WDs and/or lower metallicity environments, the nova evolves more slowly because of their weaker mass losses. In an extreme case, no optically thick winds are accelerated and, then, the nova evolves very slowly (Kato & Hachisu, 2009). The envelope structure hardly changes because its mass is decreasing due only to hydrogen shell-burning, about a thousand times longer timescale compared with that due to strong winds. Therefore, the nova stays at an expanded stage for a long time. This makes the optical peak flat for a thousand times longer time.
A good example of long-lasted flat peak is the symbiotic nova PU Vul (Cúneo et al., 2018, for a recent summary). This is a well observed nova, but there is no indication of optically-thick wind mass-loss (e.g., Yamashita et al., 1982; Kanamitsu, 1991a). The flat peak lasts as long as eight years (see Figure 1). If such a flat peak lasts much longer, e.g., a century, the outbursting WD may not be recognized as a nova outburst, instead as a supergiant. The flat-peak nova PU Vul could be an object on the border that we can recognize a thermonuclear runaway event as a nova in human timescale.
Theoretically a hydrogen shell flash occurs on a WD of mass as small as 0.4 (Nariai et al., 1980; Yaron et al., 2005; Shen et al., 2009). On the other hand, estimated WD masses in novae are more massive (, see, e.g., Horne et al., 1993; Smith et al., 1998; Thoroughgood et al., 2001; Kato & Hachisu, 2011; Hachisu & Kato, 2015; Selvelli & Gilmozzi, 2019). A possible explanation of this discrepancy is that we have missed such variables fading very slowly after red-giant-like stage.
Kato & Hachisu (2009) studied the condition of occurrence of optically thick winds. The border of WD mass for occurrence of winds lies at - 0.7 , depending on the metallicity. A shell flash on a WD () evolves too slow to be recognized as a nova outburst in human timescale. PU Vul is a rare object that was identified as a nova close to this border.
In this paper, we present light curve models for CN Cha and determine the WD mass. We also discuss whether or not CN Cha is the next close example of the border object. This paper is organized as follows. First, we compare the light curve of CN Cha with various types of novae in Section 2. Then, we present our model light curves to estimate the WD mass in section 3. Discussion and conclusions follow in sections 4 and 5, respectively.
| Model | ||||||||||
|---|---|---|---|---|---|---|---|---|---|---|
| () | () | () | ( yr-1) | |||||||
| A | … | 0.57 | 0.70 | 0.296 | 0.004 | 0.2 | -1.82 | 13.2 | ||
| B | … | 0.55 | 0.70 | 0.296 | 0.004 | 0.2 | -1.80 | 13.05 | ||
| C | … | 0.6 | 0.70 | 0.296 | 0.004 | 0.0 | -1.83 | 13.05 | ||
| D | … | 0.6 | 0.70 | 0.29 | 0.01 | 0.0 | -1.90 | 13.2 |
2 Comparison of Optical Light Curves among Different Speed Classes
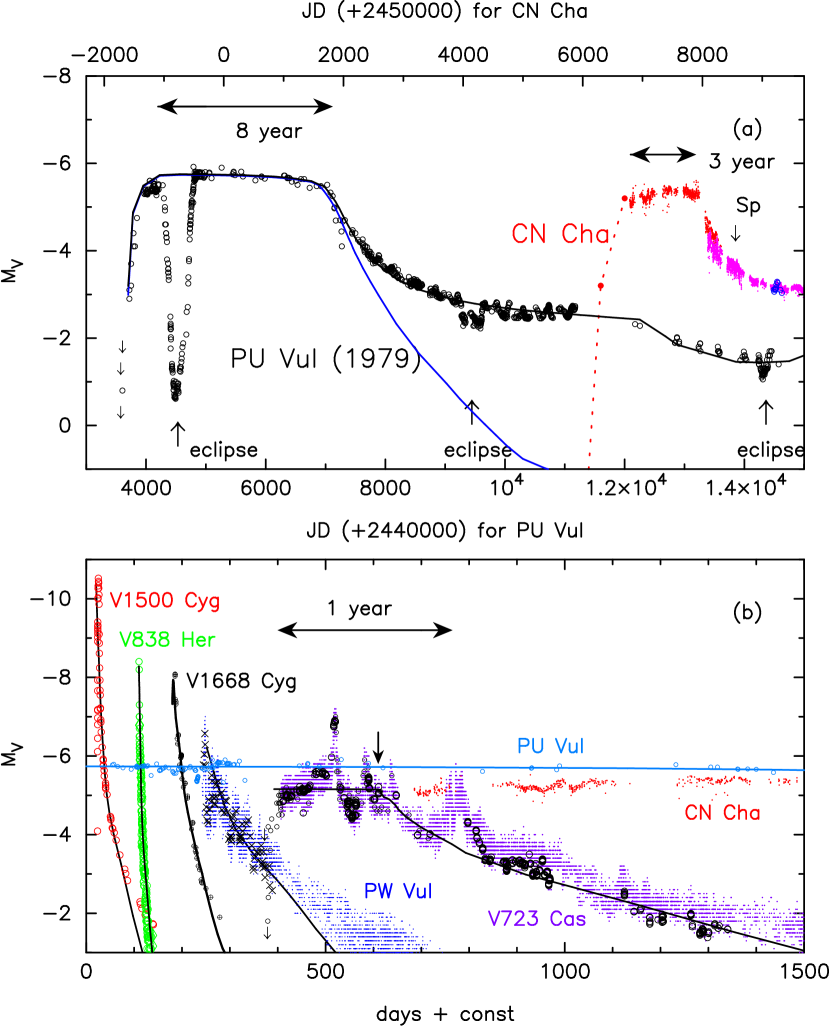
Figure 1 shows light curves of well observed novae having different speed classes111The nova speed class is defined by or (days of 3 or 2 mag decay from optical maximum). For example, very fast novae ( day), fast novae ( day), moderately fast nova ( day), slow novae ( day), and very slow novae ( day), which are defined by Payne-Gaposchkin (1957).. We compare them with that of CN Cha and clarify what are the differences between them.
2.1 Fast Novae
The bottom panel in Figure 1 shows, from left to right, the very fast novae V1500 Cyg 1975 and V838 Her 1991, fast nova V1668 Cyg 1978, and moderately fast nova PW Vul 1984#1. They show a sharp optical peak. The WD masses of these novae have been obtained by theoretically reproducing their light curves in the decay phase. The estimated WD mass is 1.2 for V1500 Cyg (see Appendix of Hachisu & Kato, 2014), 1.35 (0.55,0.33,0.02,0.03,0.07) for V838 Her (Kato et al., 2009b), 0.98 for V1668 Cyg (Hachisu & Kato, 2016a), 0.83 for PW Vul (Hachisu & Kato, 2015).
2.2 PU Vul: a Slow Nova with a Flat Peak
The symbiotic nova PU Vul is a unique nova having a long-lasted optical flat-peak (see Figure 1a). A very stable flat peak lasted as long as eight years. The early spectra mimicked those of an F supergiant and no indication of strong mass ejection (Yamashita et al., 1982; Kanamitsu, 1991a). The optical spectrum was absorption-dominated until JD 2,446,000, but showed a distinct nebular feature on JD 2,447,000 (Iijima, 1989; Kanamitsu et al., 1991b). On JD 2,448,000, the optical and UV spectra showed rich emission lines which are typical in the nebular phase (Vogel & Nussbaumer, 1992; Kanamitsu et al., 1991b; Tomov et al, 1991). P Cygni line-profiles appeared in the decay phase, indicating optically thin mass-ejection from the WD photosphere (Belyakina et al., 1989; Vogel & Nussbaumer, 1992; Sion et al., 1993; Nussbaumer & Vogel, 1996).
Based on these observational aspects, Kato et al. (2012) presented a light curve model for PU Vul with the assumption of hydrostatic envelope, i.e., no optically thick winds. They calculated a theoretical light curve that fits with the observed UV 1455 Å and optical data. They used a narrow (20Å wide) spectral band centered at 1455 Å, which is known to be emission-line free and can be a representative of continuum flux in classical novae (Cassatella et al., 2002).
Their model shown in Figure 1 is a WD with the optically-thin mass-loss rate of yr-1 in the decay phase. The chemical composition of the envelope is assumed to be , , and because the spectra show no indication of C, O, or Ne enrichment. The blue line shows the magnitude of the photospheric emission. This model is obtained from the UV light curve fitting. The black line represent the total flux which is the summation of the photospheric emission and the emission from optically thin plasma surrounding the WD. The origin of the plasma is optically thin mass-loss in the decay phase (see Kato et al., 2012, for more detail).
2.3 Slow novae with Multiple Peaks
The slow nova V723 Cas shows an oscillatory behavior around in the early phase which is settled down to a smooth decline in the later phase (Figure 1b). The WD mass in V723 Cas was estimated from a model light curve analysis to be 0.5-0.55 with the chemical composition of (Hachisu & Kato, 2015).
Kato & Hachisu (2011) presented the light curve model assuming that the outburst of V723 Cas began as a hydrostatic envelope without winds like the PU Vul evolution, but somewhat later changed to a normal evolution with smooth light curve decline, i.e., optically thick wind phase. This model is indicated by the black line in Figure 1b.
Such a transition from hydrostatic to winds does not normally occur because a redgiant-like hydrostatic envelope has a very different structure from that of a wind mass-loss envelope. Kato & Hachisu (2011) concluded that the transition could occur only when the extended nova envelope engulfs the companion and its motion in the envelope triggered the transition. The large energy release owing to the frictional energy produces additional luminosity. We see a relaxation process in a large spike-like oscillation of the light curve.
We do not expect such a transition in CN Cha or PU Vul because they are a very wide binary and their nova envelopes/photospheres do not engulf the companion.
2.4 CN Cha
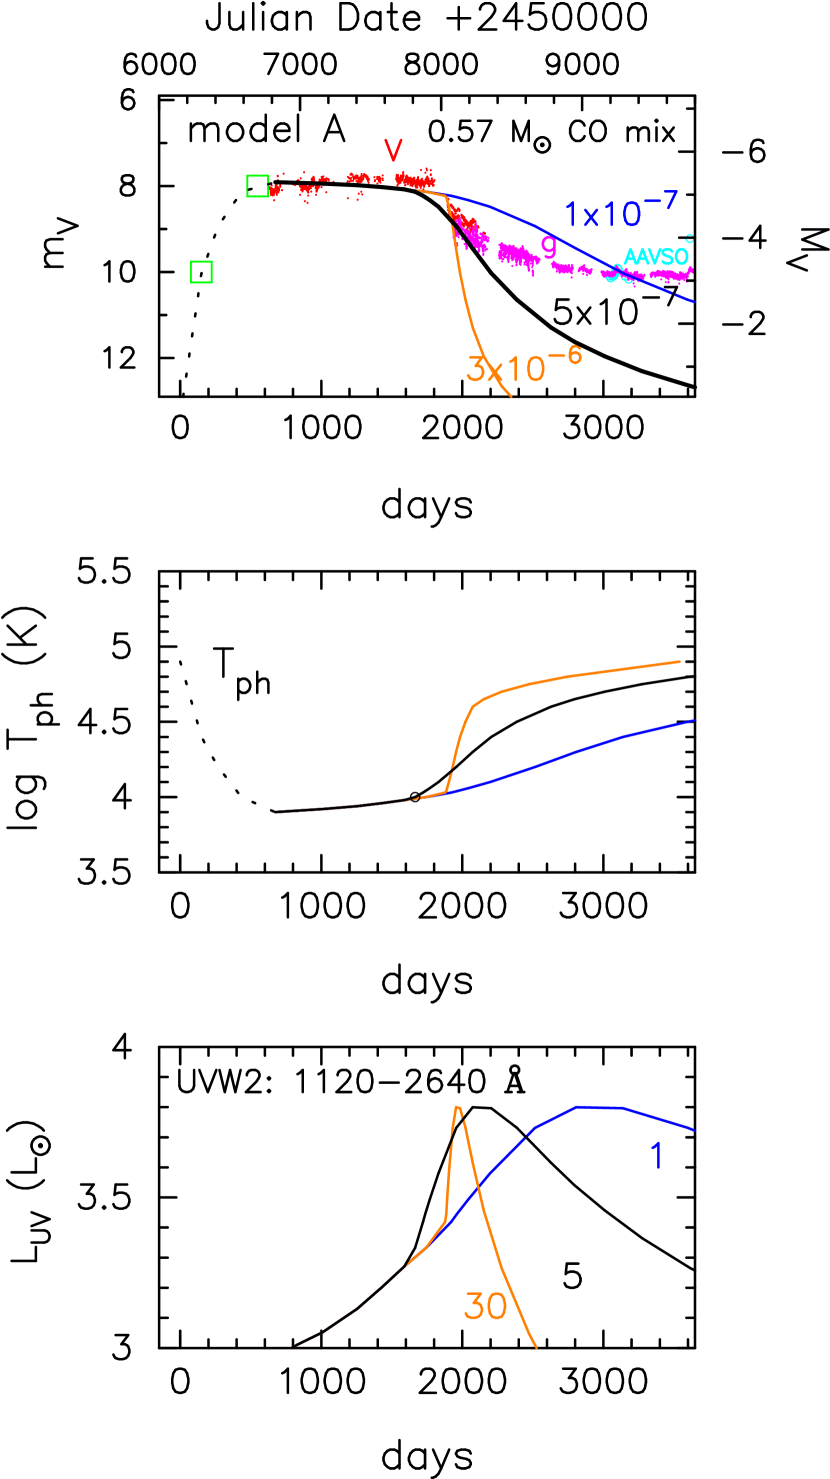
Figure 2 shows the optical data for CN Cha, (red dots) and (magenta dots) taken from ASAS-SN (Shappee et al., 2014; Jayasinghe et al., 2019), and (cyan blue dots) from AAVSO. We see that the flat phase variation in CN Cha is much smaller than that in V723 Cas, or in other similar novae, like HR Del, V5558 Sgr, in which optical/ magnitudes change by 2-3 mag (Figure 6 in Kato & Hachisu, 2011).
Lancaster et al.’s spectrum taken on JD 2458554.672 (downward arrow labeled “Sp” in Figure 1a) shows many narrow emission lines including P Cygni profiles, suggesting optically-thin wind mass loss. Although we do not find UV flux data in the decay phase of CN Cha, its resemblance to PU Vul suggests that the band flux is dominated by that of optically thin plasma outside the WD photosphere. Our model in Figure 2 is calculated from the photospheric blackbody emission, which does not include the flux from optically-thin nebular emission. Thus, we may take the observed data as the upper limit for our model light curve.
3 Model Light Curve Fittings
3.1 Method
In slow novae, the envelope is almost in hydrostatic balance until it reaches optical maximum. In the phases of flat optical peak and after that, the energy generation rate of nuclear burning is balanced with the energy loss from the photosphere, i.e., . First, we integrated the hydrostatic equation with the diffusion equation from the photosphere to the base of envelope. We use the OPAL opacity (Iglesias & Rogers, 1993). The model parameters are the WD mass, WD radius (radius at the base of envelope), and chemical composition of envelope. Then, we make a sequence of envelope solutions in the order of decreasing mass. This sequence is a good approximation of nova evolution when no optically thick winds occur. The time interval between two successive solutions is obtained from , where is the difference between the envelope masses of the two successive solutions, and and are the wind mass-loss rate of optically thin winds and hydrogen nuclear burning rate, respectively. Here, is calculated from the envelope structure and chemical composition of envelope, but we assume the value of as mentioned below. This method has been used to follow the supersoft X-ray phase of novae after the optically thick wind stops (Kato & Hachisu, 1994; Sala & Hernanz, 2005) or to follow PU Vul evolution in which the optically thick winds does not occur throughout the outburst (Kato et al., 2011, 2012). In the flat-peak phase, we have no wind mass loss, . In the later decay phase of K, we assume optically thin mass-loss ( several yr-1) after Kato et al. (2011, 2012) in PU Vul.
In the rising phase, we assume that the envelope is in hydrostatic balance, but the energy generation rate is slightly larger than the thermal equilibrium, i.e., , by a few to several percent. We obtained envelope solutions to be consistent with the observational data. This part is plotted with a dotted line in Figure 2(top).
The ignition mass is approximately obtained as the mass at when the photospheric temperature goes down to (K)=4.9, as shown in the middle panel of Figure 2. The envelope mass decreases only by a few percent from to day.
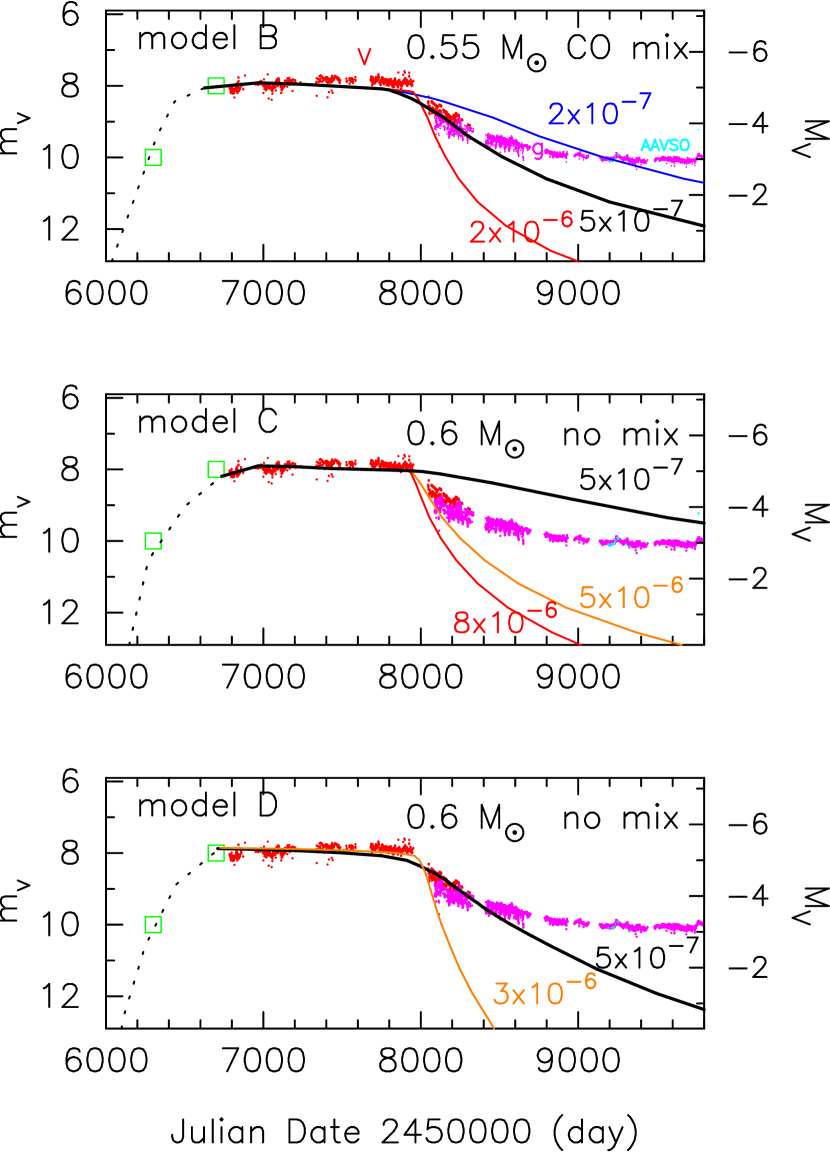
We assume Population II composition for the accreted matter, i.e., with/without additional CO enhancement . For comparison, we calculated model D () as listed in Table 1.
The absolute magnitudes, , for the standard Johnson bandpass are calculated from the photospheric temperature, , and luminosity, . The UVW2 band flux is calculated from the blackbody emission between 1120 and 2640 Å.
3.2 Light Curve Fitting
Table 1 lists our models. It shows, from left to right, the WD mass , chemical composition of the envelope , , , , WD radius, ignition mass , distance modulus in the band , and assumed optically-thin wind mass-loss rates .
The top panel in Figure 2 shows the light curve fitting of model A with the observation. The model light curve shows a flat optical peak, which is the most expanded phase of photosphere, and its photospheric temperature is as low as K, as shown in the middle panel. We fit our theoretical curve with the observation to obtain the distance modulus in the band, i.e., (obs) (model)=13.2.
The envelope mass gradually decreases because of hydrogen burning at a rate of yr-1. In the decay phase of K, we assume the optically-thin wind mass-loss as done in the PU Vul model by Kato et al. (2011) and Kato et al. (2012). For simplicity, we assume a constant mass loss rate (. The magnitude decays as increases with time, while the photospheric luminosity is almost constant. If we assume a larger mass-loss rate, the magnitude decays faster because the envelope mass decreases more quickly.
From the resemblance of the light curve to PU Vul and the presence of emission lines that indicate the optically thin mass-loss, we regard that the light curve is strongly contaminated with nebular emission as often observed in the nebular phase of novae (e.g., Kato et al. (2012) for PU Vul, Hachisu & Kato (2006) for V1668 Cyg). In other words, the photospheric (continuum) component would be much fainter than light curve.
We plot three light curves with different wind mass-loss rates in the top panel of Figure 2. The mass loss starts at the point denoted by the open small circle in the middle panel. The model with yr-1 is too slow and rejected.
Figure 3 shows the light curve fittings of model B, model C, and model D. We obtain the distance modulus in the band from the flat-peak phase, and the lower limit of mass-loss rates from the decay phase.
It is difficult to further constrain the mass loss rate in CN Cha. The bottom panel in Figure 2 shows the UV light curves of the three different mass-loss models. If we have UV observations in the decay phase, we can determine the mass-loss rate by comparing them with the model light curves.
In PU Vul, UV 1455 Å band light curve is obtained with IUE that represents temperature evolution in the decay phase. Kato et al. (2011) and Kato et al. (2012) determined the optically-thin wind mass-loss rate to be yr-1 for a WD.
The mass loss rate obtained in PU Vul may be a representative of mass loss rates in the extended nova envelope for the particular case of no optically thick winds. We plot the model of yr-1 by the thick solid black line in Figures 2 and 3. We thus exclude model C.
For a less massive WD (), the envelope mass is larger while the nuclear burning rate is smaller. Thus, the evolution timescale is much more longer than those in models B and C. To reproduce a reasonable light curve for CN Cha, we need to take a much more larger . Thus, less massive WDs than those in models B and C are unlikely.
3.3 Distance Modulus
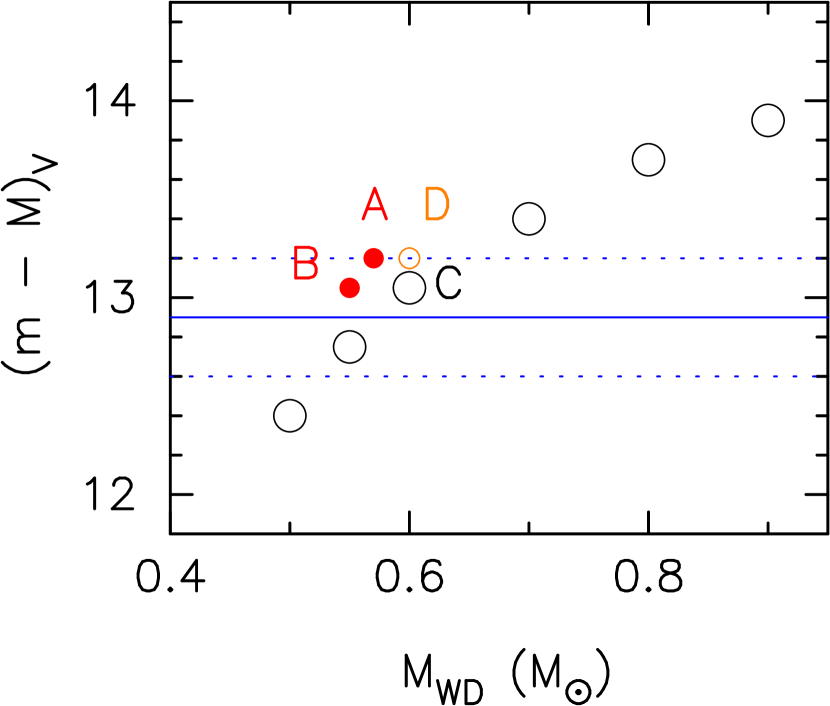
Figure 4 shows the distance modulus in the band, , calculated from light curve fitting. The photospheric luminosity at the flat-peak is brighter for more massive WDs, so that the becomes larger with the increasing . The horizontal solid/dotted blue lines indicate , calculated from a Gaia eDR3 distance, kpc (Bailer-Jones et al., 2021), and scattering in ASAS-SN data. From this plot, we may exclude and . Thus, models A and B are reasonable for CN Cha.
For models A, B, and C, we adopt a WD (radius) in a thermal balance with a relatively large mass-accretion rate of several yr-1 (Kato et al., 2020). For model D, we take a smaller WD radius for a colder WD for comparison, and increase the heavy element enrichment to . The resultant distance modulus increases by 0.15 mag, because model D is brighter than model C mainly because of a smaller WD radius. Note that model D is for a Population I star and disfavored as a model of CN Cha.
4 Discussion
We could not accurately obtain/constrain the mass accretion rate because our static-sequence approach cannot be applied to the early rising phase of a shell flash. However, the mass accretion rate corresponding to our ignition mass can be found in literature.
Chen et al. (2019) presented hydrogen shell flash calculation and obtained the ignition mass of (the recurrence time yr) for a 0.6 WD with and CO-rich accretion of yr-1. This ignition mass is close to that of model A, which suggests that the mass accretion rate of CN Cha is around yr-1.
Chen et al. (2019) also obtained the ignition mass of ( yr) for a WD with no CO enrichment, , and yr-1. Kato et al. (2020) obtained the ignition mass to be ( yr) for a WD with , no CO enhancement, and yr-1. These values are roughly consistent with model C.
The above values indicate that the mass accretion rate of CN Cha is yr-1.
5 Concluding Remarks
CN Cha is a rare nova that has a long-lasted flat-peak. Our 0.55-0.57 WD models show reasonable light curve fittings with the observation. This is the second well-observed flat-peak nova after PU Vul that also hosts a less massive WD of .
On the other hand, some slow novae, V723 Cas, HR Del, and V5558 Sgr have similar WD masses of - (e.g., Hachisu & Kato, 2015), but they show violent multiple spike-like peaks, instead of a flat peak.
We point out that this difference arises from the binary nature: a wide binary or not. In a close binary like V723 Cas, a nova envelope at/near optical maximum extends beyond the binary orbit. In other words, the companion main-sequence star moves in the nova envelope.
This idea is supported by the following theoretical implications: (1) In low mass WDs, there are two possible nova evolutions, which are represented by an optically-thick wind mass-loss envelope and static envelope with no winds (Kato & Hachisu, 2009). The evolutions of these two envelope solutions do not cross each other because their envelope structures are very different. (2) Transition from static to wind mass-loss solutions could occur, if the companion star moves in the envelope because the static envelope structure becomes close to that of wind solution considering both the centrifugal force and companion’s gravity (Kato & Hachisu, 2011). The observed multiple spike-like peaks are interpreted as a relaxation process of the transition to wind solutions.
The main theoretical points of the present work are summarized as follows:
-
1.
Nova outbursts accompany, in most, strong optically-thick wind mass-loss. Then the nova evolution is fast, and the optical light curve shows a sharp peak in a white dwarf of mass (e.g., Hachisu & Kato, 2015).
- 2.
-
3.
In the region between the above two cases (), a nova outburst begins first in a hydrostatic manner, and later it could change to an evolution with optically-thick wind mass-loss due to perturbation by the companion star in the nova envelope (Kato & Hachisu, 2011).
-
4.
This hypothesis predicts that such a transition occurs only in close binaries like V723 Cas and does not occur in wide binaries like PU Vul. CN Cha is the second example of flat-peak novae in wide binaries, and strengthens the idea by Kato & Hachisu (2011).
Thus, we encourage observations for searching slow novae. We suggest that a long-lasted flat-peak nova appears only in long-period binaries, and not in close binaries. Photometric and spectroscopic observations are highly valuable.
References
- Bailer-Jones et al. (2021) Bailer-Jones, C. A. L., Rybizki, J., Fouesneau, M., Demleitner, M., & Andrae, R. 2021, AJ, 161, 147, 10.3847/1538-3881/abd806
- Belyakina et al. (1989) Belyakina, T.S., Bondar, N.I., Chochol, D. et al. 1989, A&A, 223, 119
- Cassatella et al. (2002) Cassatella, A., Altamore, A., & González-Riestra, R. 2002, A&A, 384, 1023 10.1051/0004-6361:20020107
- Chen et al. (2019) Chen, H.-L., Woods, T. E., Yungelson, L. R., et al. 2019, MNRAS, 490, 1678, 10.1093/mnras/stz2644
- Cúneo et al. (2018) Cúneo, V. A., Kenyon, S. J., Gómez, M. N., et al. 2018, MNRAS, 479, 2728, 10.1093/mnras/styl686
- Della Valle (2002) Della Valle, M. 2002, Classical Nova Explosions, eds. M. Hernaz & J. José (AIP: New York), AIP Conf. Ser., 637, 443, 10.1063/1.1518244
- Hachisu & Kato (2006) Hachisu, I., & Kato, M. 2006, ApJS, 167, 59, 10.1086/508063
- Hachisu & Kato (2010) Hachisu, I., & Kato, M. 2010, ApJ, 709, 680, 10.1088/0004-637X/709/2/680
- Hachisu & Kato (2014) Hachisu, I., & Kato, M. 2014, ApJ, 785, 97, 10.1088/0004-637X/785/2/97
- Hachisu & Kato (2015) Hachisu, I., & Kato, M. 2015, ApJ, 798, 76, 10.1088/0004-637X/798/2/76
- Hachisu & Kato (2016a) Hachisu, I., & Kato, M. 2016a, ApJ, 816, 26, 10.3847/0004-637X/816/1/26
- Hachisu et al. (2020) Hachisu, I., Saio, H., Kato, M., Henze, M. & Shafter, A.W. 2020, ApJ, 902, 91, 10.3847/1538-4357/abb5fa
- Hoffmeister (1963) Hoffmeister, C. 1963, VeSon, 6, 1
- Horne et al. (1993) Horne, K., Welsh, W. F., & Wade, R. A. 1993, ApJ, 410, 357, 10.1086/172752
- Iben (1982) Iben, I. Jr. 1982, ApJ, 259, 244, 10.1086/160164
- Iglesias & Rogers (1993) Iglesias, C.A., & Rogers, F.J. 1993, ApJ, 412, 752, 10.1086/172958
- Iijima (1989) Iijima, T. 1989, A&A, 215,57
- Jayasinghe et al. (2019) Jayasinghe, T., Stanek, K. Z., Kochanek, C. S., et al. 2019, MNRAS, 486, 1907, 10.1093/mnras/stz844
- Kanamitsu (1991a) Kanamitsu, O. 1991a, PASJ, 43, 225,
- Kanamitsu et al. (1991b) Kanamitsu, O., Yamashita, Y., Norimoto, Y., Watanabe, E., & Yutani, M. 1991b, PASJ, 43, 523
- Kato & Hachisu (1994) Kato, M., & Hachisu, I., 1994, ApJ, 437, 802, 10.1086/175041
- Kato & Hachisu (2009) Kato, M., & Hachisu, I., 2009, ApJ, 699, 1293, 10.1088/0004-637X/699/2/1293
- Kato & Hachisu (2011) Kato, M., & Hachisu, I., 2011, ApJ, 743, 157, 10.1088/0004-637X/743/2/157
- Kato et al. (2009b) Kato, M., Hachisu, I., Cassatella, A. 2009, ApJ, 704, 1676, 10.1088/0004-637X/704/2/1676
- Kato et al. (2011) Kato, M., Hachisu, I., Cassatella, A., & González-Riestra, R. 2011, ApJ, 727, 72, 10.1088/0004-637X/727/2/72
- Kato et al. (2013) Kato, M., Hachisu, I., Henze, M. 2013, ApJ, 779, 19 10.1088/0004-637X/779/1/19
- Kato et al. (2012) Kato, M., Mikołajewska, J, Hachisu, I. 2012, ApJ, 750, 5, 10.1088/0004-637X/750/1/5
- Kato et al. (2017) Kato, M., Saio, H., & Hachisu, I., 2017, ApJ, 838, 153, 10.3847/1538-4357/838/2/153
- Kato et al. (2020) Kato, M., Saio, H, & Hachisu, I. 2020, ApJ, 892, 15 https://10.3847/1538-4357/ab7996
- Lancaster et al. (2020) Lancaster, L., Greene, J. E., Ting, Y-S., et al. 2020, ApJ, 160, 125, 10.3847/1538-3881/aba435
- Nariai et al. (1980) Nariai, K., Nomoto, K., & Sugimoto, D. 1980, PASJ, 32, 473
- Nussbaumer & Vogel (1996) Nussbaumer, H., & Vogel, M. 1996, A&A, 307,470
- Payne-Gaposchkin (1957) Payne-Gaposchkin, C. 1957, in “The Galactic Novae” (North-Holland, Holland)
- Prialnik et al. (1986) Prialnik, D., 1986, ApJ, 310, 222, 10.1086/164677
- Prialnik & Kovetz (1995) Prialnik, D., & Kovetz, A. 1995, ApJ, 445, 789, 10.1086/175741
- Sala & Hernanz (2005) Sala, G., & Helnanz, M. 2005, A&A, 439, 1061, 10.1051/0004-6361:20042622
- Selvelli & Gilmozzi (2019) Selvelli, P., & Gilmozzi, R. 2019, A&A, 622, A186, 10.1051/0004-6361/201834238
- Shappee et al. (2014) Shappee , B. J., Prieto, J. L., Grupe, D., et al. 2014, ApJ, 788, 48, 10.1088/0004-637X/788/1/48
- Shen et al. (2009) Shen, K.J., Idan, I., & Bildsten, L. 2009, ApJ, 705, 693, 10.1088/0004-637X/705/1/693
- Sion et al. (1979) Sion, E. M., Acierno, M.J., & Tomczyk, S. 1979, ApJ, 230, 832, 10.1086/157143
- Sion et al. (1993) Sion, E. M., Shore, S.N., Ready, C. J., Scheible, M. P. 1993, AJ, 106, 2118, 10.1086/116789
- Smith et al. (1998) Smith, D. A., Dhillon, V. S., & Marsh, T. R. MNRAS, 296, 465, 10.1046/j.1365-8711.1998.00743.x
- Sparks et al. (1978) Sparks, W. N., Starrfield, S., & Truran J. W. 1978, ApJ, 220, 1063, 10.1086/155992
- Strope et al. (2010) Strope, R., Schaefer, B. E., & Henden, A. A. 2010, AJ, 140, 34 10.1088/0004-6256/140/1/34
- Thoroughgood et al. (2001) Thoroughgood, T. D., Dhillon, V. S., Littlefair, S. P., Marsh, T. R., & Smith, D. A. 2001, MNRAS, 327, 1323, 10.1046/j.1365-8711.2001.04828.x
- Tomov et al (1991) Tomov,T., Zamanov, R., Iliev, L., Mikolajewski, M., & Georgiev, L. 1991, MNRAS, 252, 31, 10.1093/mnras/252.1.31P
- Vogel & Nussbaumer (1992) Vogel, M., & Nussbaumer, H. 1992, A&A, 259, 525
- Yamashita et al. (1982) Yamashita, Y., Maehara, H., Norimoto, Y. 1982, PASJ, 34, 269
- Yaron et al. (2005) Yaron, O., Prialnik, D., Shara, M.M., & Kovetz, A. 2005, ApJ, 623, 398, 10.1086/428435