TIGEr: Text-to-Image Grounding for Image Caption Evaluation
Abstract
This paper presents a new metric called TIGEr for the automatic evaluation of image captioning systems. Popular metrics, such as BLEU and CIDEr, are based solely on text matching between reference captions and machine-generated captions, potentially leading to biased evaluations because references may not fully cover the image content and natural language is inherently ambiguous. Building upon a machine-learned text-image grounding model, TIGEr allows to evaluate caption quality not only based on how well a caption represents image content, but also on how well machine-generated captions match human-generated captions. Our empirical tests show that TIGEr has a higher consistency with human judgments than alternative existing metrics. We also comprehensively assess the metric’s effectiveness in caption evaluation by measuring the correlation between human judgments and metric scores.
1 Introduction
Image captioning is a research topic at the nexus of natural language processing and computer vision, and has a wide range of practical applications Hodosh et al. (2013); Fang et al. (2015), such as image retrieval and human-machine interaction. Given an image as input, the task of image captioning is to generate a text that describes the image content. Overall, prior studies of this task have been focusing on two aspects: 1) building large benchmark datasets Lin et al. (2014); Hodosh et al. (2013), and 2) developing effective caption generation algorithms Karpathy and Li (2015); Bernardi et al. (2016); Gan et al. (2017). Remarkable contributions that have been made, but assessing the quality of the generated captions is still an insufficiently addressed issue. Since numerous captions with varying quality can be produced by machines, it is important to propose an automatic evaluation metric that is highly consistent with human judges, easy to implement and interpret.
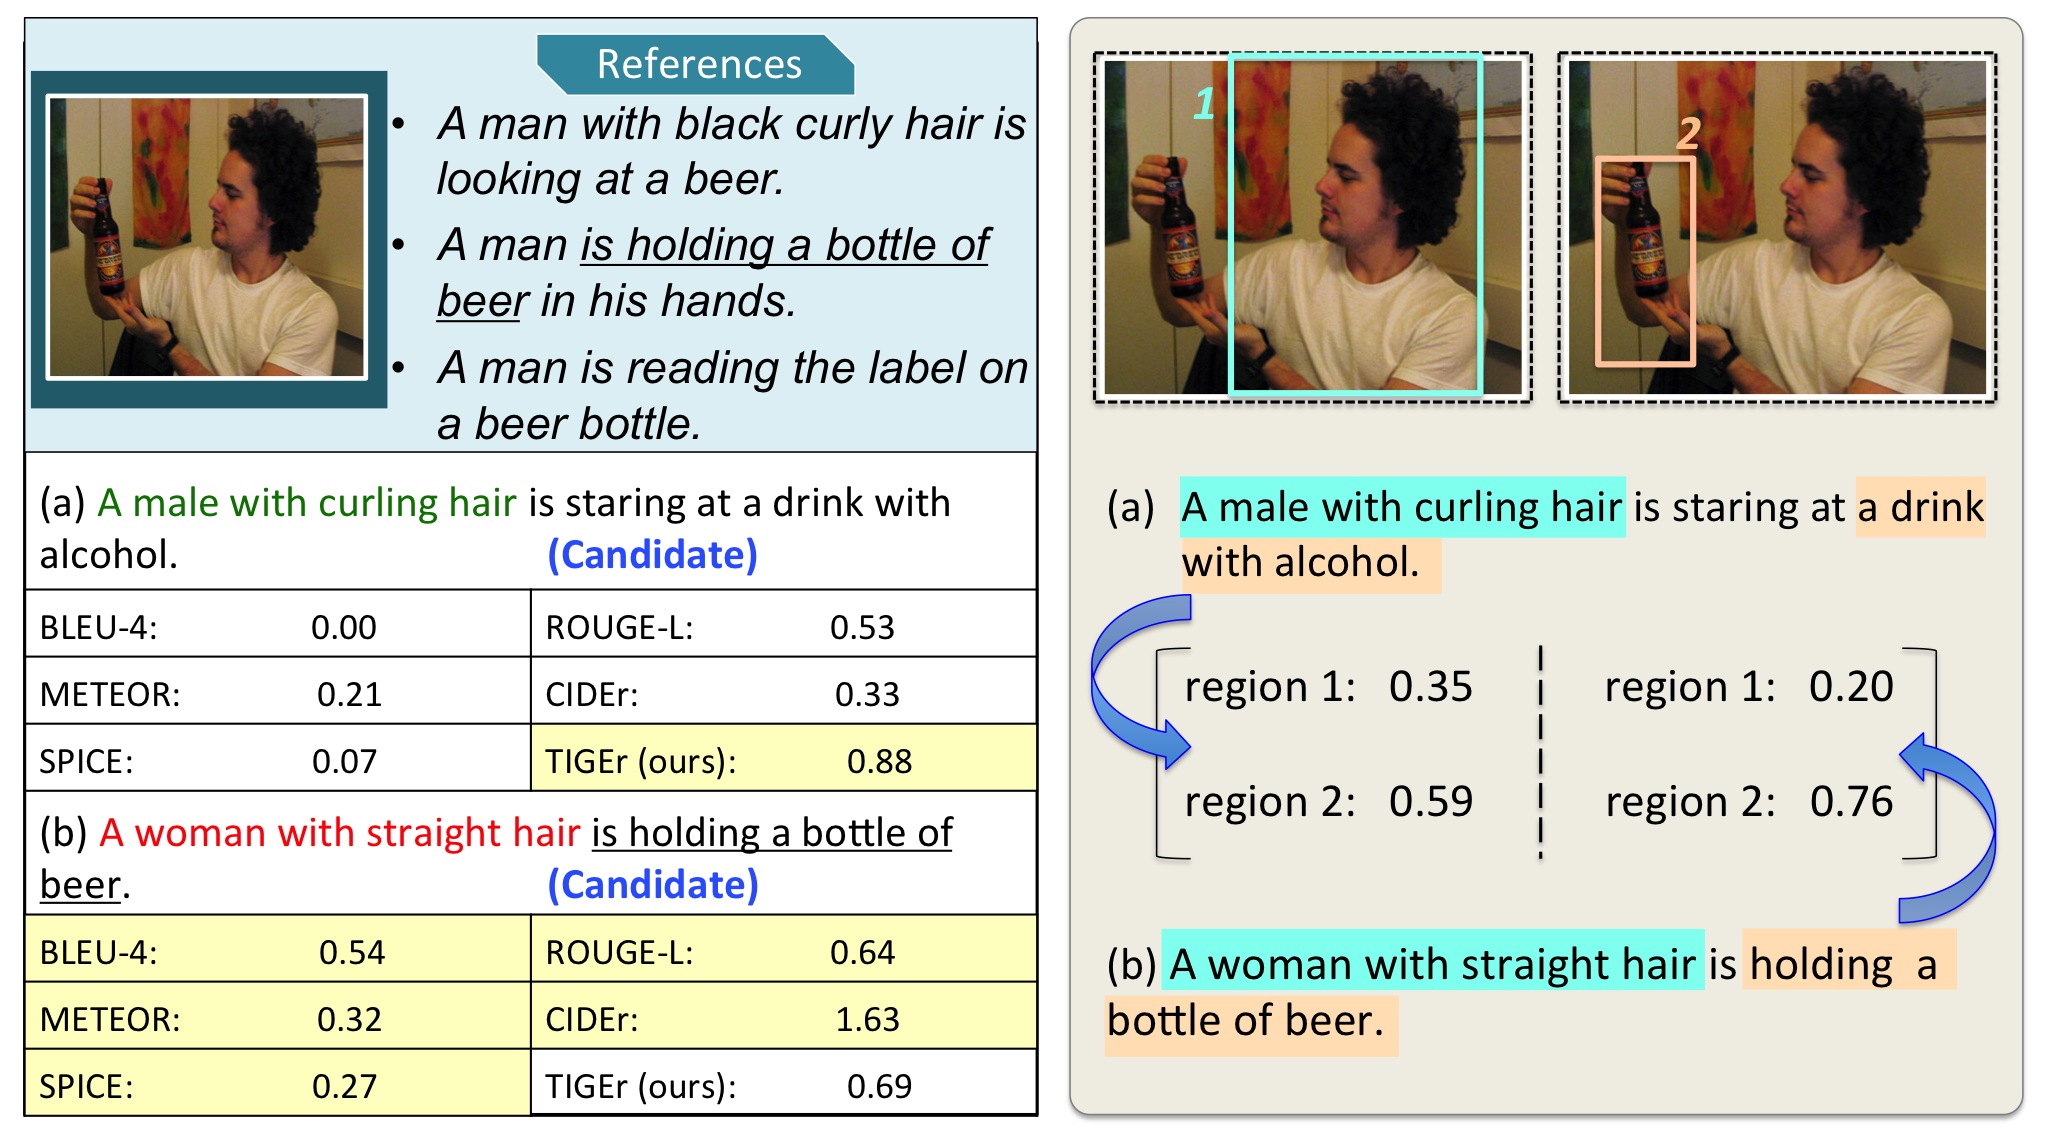
Prior evaluation metrics typically considered several aspects, including content relevance, information correctness, grammaticality, and if expressions are human-like Hodosh et al. (2013); Bernardi et al. (2016). Rule-based metrics inspired by linguistic features such as n-gram overlapping are commonly used to evaluate machine-generated captions Chen et al. (2018); Karpathy and Li (2015); Huang et al. (2019). However, these metrics primarily evaluate a candidate caption based on references without taking image content into account, and the possible information loss caused by references may bring biases to the evaluation process. Moreover, the ambiguity inherent to natural language presents a challenge for rule-based metrics that are based on text overlapping. As shown in Figure 1, although Caption (a) describes the image properly, most words in this sentence are different from the references. In contrast, Caption (b) contains wrong information (“a woman with straight hair”), but overlaps with human-written references (“is holding a bottle of beer”). Consequently, all existing metrics improperly assign a higher score to Caption (b).
In order to address the aforementioned challenges, we propose a novel Text-to-Image Grounding based metric for image caption Evaluation (TIGEr), which considers both image content and human-generated references for evaluation. First, TIGEr grounds the content of texts (both reference and generated captions) in a set of image regions by using a pre-trained image-text grounding model. Based on the grounding outputs, TIGEr calculates a score by comparing both the relevance ranking and distribution of grounding weights among image regions between the references and the generated caption. Instead of evaluating image captions by exact n-gram matching, TIGEr compares the candidate caption with references by mapping them into vectors in a common semantic space.
As a result, TIGEr is able to detect the paraphrases based on the semantic meaning of caption sentences. A systematic comparison of TIGEr and other commonly used metrics shows that TIGEr improves the evaluation performance across multiple datasets and demonstrates a higher consistency with human judgments. For example, Figure 1 presents a case where only TIGEr is able to assign a higher score to the caption candidate that is more consistent with human judgments. Our main contributions include:
-
•
We propose a novel automatic evaluation metric, TIGEr111Code is released at https://github.com/SeleenaJM/CapEval., to assess the quality of image captions by grounding text captions in image content.
-
•
By performing an empirical study, we show that TIGEr outperforms other commonly used metrics, and demonstrates a higher and more stable consistency with human judgments.
-
•
We conduct an in-depth analysis of the assessment of metric effectiveness, which deepens our understanding of the characteristics of different metrics.
2 Related Work
Caption Evaluation
The goal of image caption evaluation is to measure the quality of a generated caption given an image and human-written reference captions Bernardi et al. (2016).
In general, prior solutions to this task can be divided into three groups. First, human evaluation is typically conducted by employing human annotators to assess captions (e.g., via Amazon’s Mechanical Turk) Bernardi et al. (2016); Aditya et al. (2015a); Wang et al. (2018b).
Second, automatic rule-based evaluation measures assess the similarity between references and generated captions. Many metrics in this group were extended from other related tasks Papineni et al. (2002); Banerjee and Lavie (2005); Lin (2004). BLEU Papineni et al. (2002) and METEOR Banerjee and Lavie (2005) were initially developed to evaluate machine translation outcomes based on n-gram precision and recall. ROUGE Lin (2004) was originally used in text summarization, which measures the overlap of n-grams using recall. Recently, two metrics were specifically built for visual captioning: 1) CIDEr Vedantam et al. (2015) measures n-gram similarity based on TF-IDF; and 2) SPICE Anderson et al. (2016) quantifies graph similarity based on the scene graphs built from captions. Overall, these metrics focus on text-level comparisons, assuming that the information contained in human-written references can well represent the image content. Differing from prior work, we argue in this study that references may not fully cover the image content because both references and captions are incomplete and selective translations of image contents made by human judges or automated systems. The ground truth can only be fully revealed by taking the images themselves into account for evaluation.
Finally, machine-learned metrics use a trained model to predict the likelihood of a testing caption as a human-generated description Cui et al. (2018); Dai et al. (2017). Prior studies have applied learning-based evaluation for related text generation tasks, e.g., machine translation Corston-Oliver et al. (2001); Lowe et al. (2017); Kulesza and Shieber (2004). Most recently, Cui et al. (2018) trained a hybrid neural network model for caption evaluation based on image and text features. This work mainly focuses on the generation of adversarial data used for model training. Despite improving the consistency with human decisions, this approach may involve high computational cost and lead to overfitting Gao et al. (2019). Besides, the interpretability of the evaluation is limited due to the black-box nature of end-to-end learning models. An even more serious problem of using machine-learned metrics is the so-called “gaming of the metric”: if a generation system is optimized directly for a learnable metric, then the system’s performance is likely to be over-estimated. See a detailed discussion in Gao et al. (2019).
Though caption evaluation is similar to traditional text-to-text generation evaluation in terms of testing targets and evaluation principles, this task additionally need to synthesize image and reference contents as ground truth information for further evaluation, which is hard to achieve by using a rule-based method with a strong human prior. In this study, we propose a new metric that combines the strengths of learning-based and rule-based approaches in terms of: 1) utilizing a pre-trained grounding model222We find in our experiments that we can simply use the pre-trained model as is to evaluate systems developed on different datasets, and the pre-trained model is very efficient to run. Thus, the cost of computing TIGEr is not much higher than that of computing other traditional metrics. to combine the image and text information; and 2) scoring captions by defining principle rules based on the grounding outputs to make the evaluation interpretable.
Image-Text Matching
The task of image-text matching can be defined as the measurement of semantic similarity between visual data and text data. The main strategy of solutions designed for this task is to map image data and text data into a common semantic vector space Fang et al. (2015); Wang et al. (2018a); Lee et al. (2018). Prior studies usually consider this issue from two perspectives: From the perspective of data encoding, prior work either regards an image/text as a whole or applies bottom-up attention to encode image regions and words/phrases Karpathy et al. (2014); Kiros et al. (2014). From the perspective of algorithm development, prior work has often applied a deep learning framework to build a joint embedding space for images and texts, and some of these studies train a model with ranking loss Fang et al. (2015); Lee et al. (2018); Frome et al. (2013) and some use classification loss (e.g., softmax function) Jabri et al. (2016); Fukui et al. (2016). In this work, we take advantage of a state-of-the-art model for image-text matching Lee et al. (2018) and propose an automatic evaluation metric for image captioning based on the matching results. Our goal is to capture comprehensive information from input data while also providing an explainable method to assess the quality of an image description.
3 The TIGEr Metric
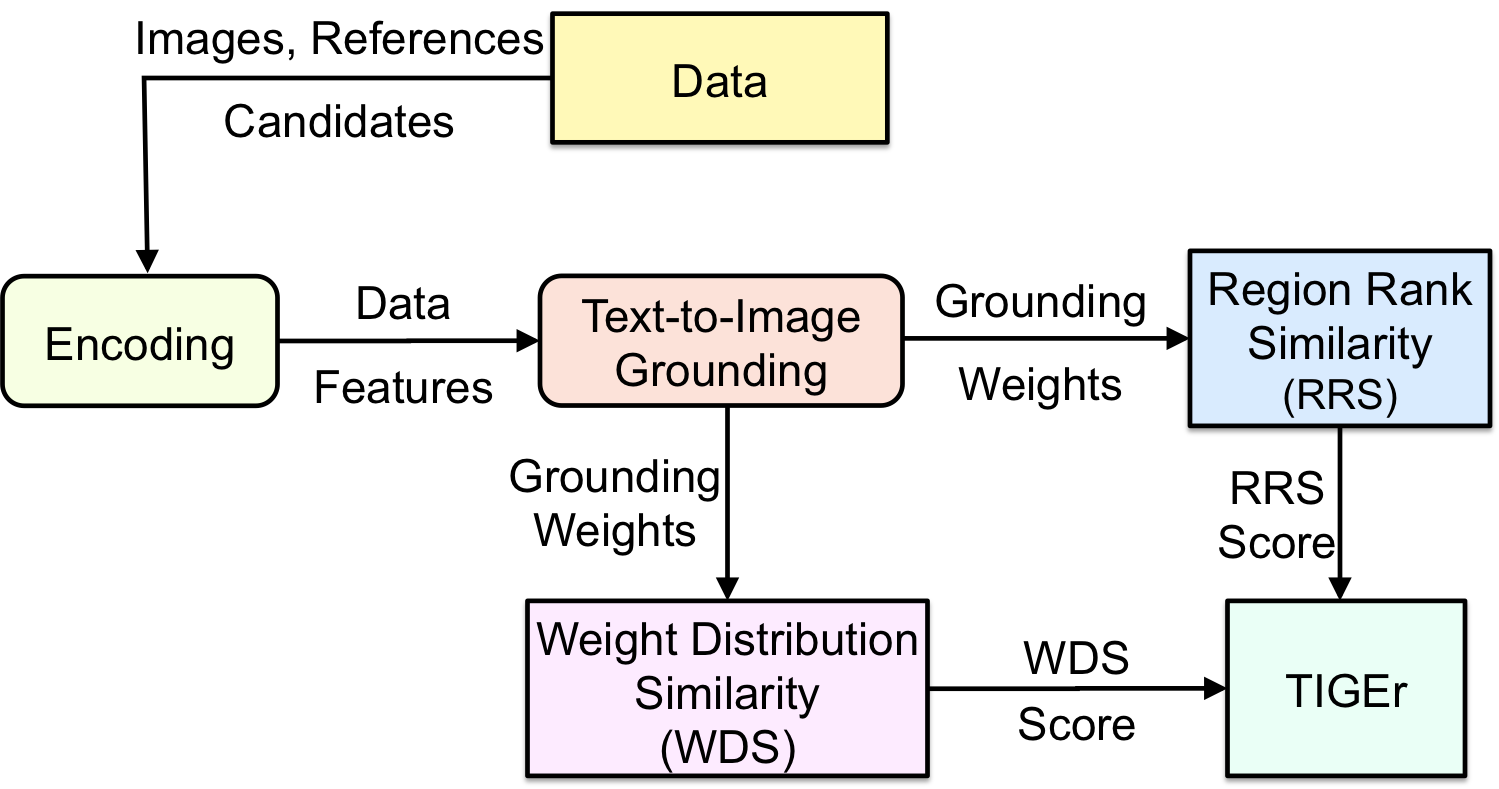
The overall framework of TIGEr is shown in Figure 2. With the assumption that a good machine-generated caption should generate a description of an image like a human would, we compare against a set of reference captions produced by humans in two stages.
The first stage is text-image grounding, where for each caption-image pair, we compute a vector of grounding scores, one for each specific region of the image, indicating how likely the caption is grounded in the region. The grounding vector can also be interpreted as estimating how much attention a human judge or the to-be-evaluated image captioning system pays on each image region in generating the caption. A good system is expected to distribute its attention among different regions of an image similarly to that of human judges. For example, if a human judge wrote a caption solely based on a particular region of an image (e.g., a human face or a bottle as shown in Figure 1) while ignoring the rest of the image, then a good machine-generated caption would be expected to describe only the objects in the same region.
The second stage is grounding vector comparison, where we compare the grounding vector between an image and the machine-generated caption , denoted by , and that between and reference captions , denoted by . The more similar these two vectors are, the higher quality of is. The similarity is measured by using two metric systems. The first one measures how similarly these image regions are ordered (by their grounding scores) in the two vectors. The second one measures how similarly the attention (indicated by grounding scores) is distributed among different regions of the image in the two vectors. The TIGEr score is the average score of the resulting two similarity scores.
In the rest of this section, we describe the two stages in detail.
3.1 Text-Image Grounding
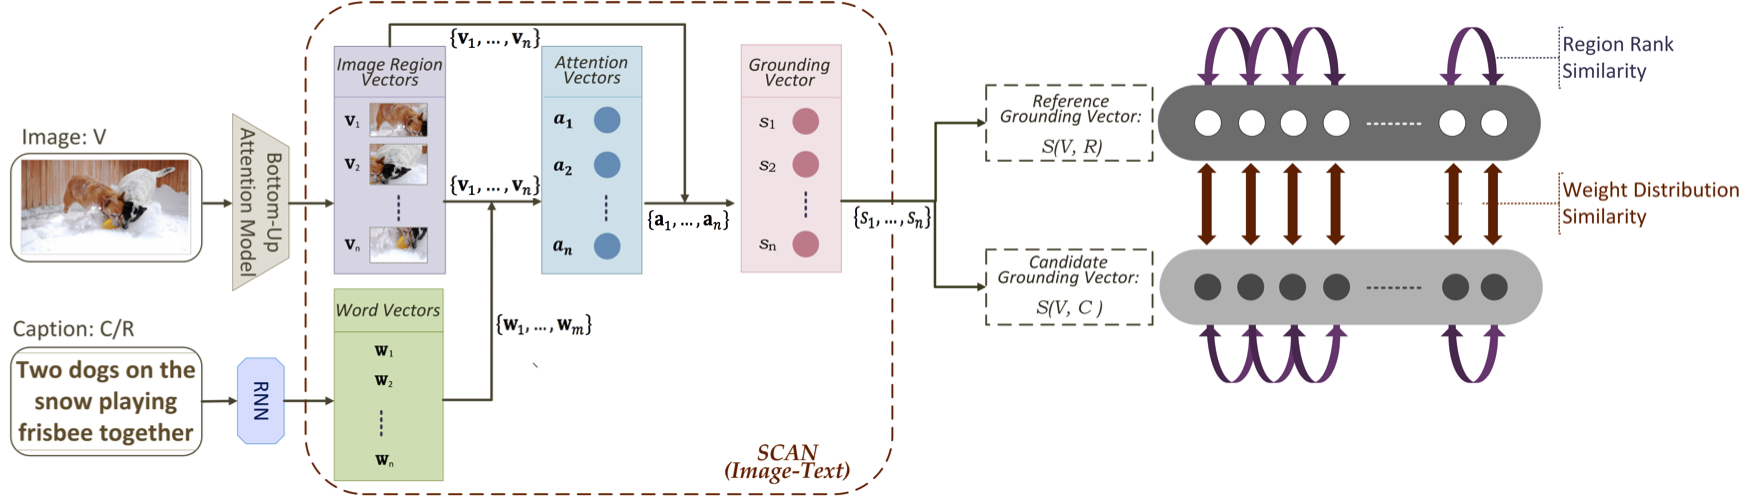
To compute the grounding scores of an image-caption pair, we need to map the image and its paired caption into vector representations in the same vector space. We achieve this by using a Stacked Cross Attention Neural Network (SCAN) Lee et al. (2018), which is pre-trained on the 2014 MS-COCO train/val dataset with default settings333Github link: https://github.com/kuanghuei/SCAN. The training data contains 121,287 images, of which each is annotated with five text descriptions. The architecture of SCAN is shown in Figure 3.
We first encode caption or , which is a sequence of words, into a sequence of -dimensional () word embedding vectors, , using a bi-directional recurrent neural network (RNN) models with gated recurrent units (GRU) Bahdanau et al. (2015). We then map image into a sequence of feature vectors in two steps. First, we extract from a set of region-level 2048-dimensional feature vectors using a pre-trained bottom-up attention model Anderson et al. (2018). Then, we use linear projection to convert these vectors into a sequence of -dimensional image region vectors .
We compute how much caption , represented as , is grounded to each image region , , as follows. First, we compute an attention feature vector for each as
| (1) | ||||
| (2) |
where is a smoothing factor, and is a normalized similarity function defined as
| (3) |
| (4) |
Then, we get the grounding vector of and as
| (5) | |||
| (6) |
where the absolute value of indicates how much caption is grounded to the -th image region or, in other words, to what degree is generated based on the -th image region.
Given an image , in order to evaluate the quality of a machine-generated caption based on a set of reference captions , we generate two grounding vectors, as in Equation 5 and which is a mean grounding vector over all references in as
| (7) |
3.2 Grounding Vector Comparison
The quality of is measured by comparing and using two metric systems, Region Rank Similarity (RRS) and Weight Distribution Similarity (WDS).
3.2.1 Region Rank Similarity (RRS)
RRS is based on Discounted Cumulative Gain (DCG) Järvelin and Kekäläinen (2002), which is widely used to measure document ranking quality of web search engines. Using a graded relevance scale of documents in a rank list returned by a search engine, DCG measures the usefulness, or gain, of a document based on its position in the ranked list.
In the image captioning task, we view a caption as a query, an image as a collection of documents, one for each image region, and the grounding scores based on reference captions as human-labeled relevance scores. Note that consists of a set of similarity scores for all image regions. If we view as a relevance score between caption (query) and image region (document) , we can sort these image regions by their scores to form a ranked list, similar to common procedure in Information Retrieval of documents from data collections via search engines.
Then, the quality of the ranked list, or equivalently the quality of , can be measured via DCG, which is the sum of the graded relevance values of all image regions in , discounted based on their positions in the rank list derived from :
| (8) |
where is the human-labeled graded relevance value of the image region at position in the ranked list.
Similarly, we can generate an ideal ranked list from where all regions are ordered based on their human-labeled graded relevance values. We compute the Ideal DCG (IDCG) as
| (9) |
Finally, RRS between and is defined as Normalized DCG (NDCG) as
|
|
(10) |
The assumption made in using RRS is that is generated based mainly on a few highly important image regions, rather than the whole image. A high-quality should be generated based on a similar set or the same set of highly important image regions based on which human judges write reference captions. One limitation of RRS is that it is not suitable to measure the quality of captions that are generated based on many equally important image regions. In these cases, we assume that humans produce captions by distributing their attention more or less evenly across all image regions rather than focusing on a small number of highly important regions. The remedy to this limitation is the new metric we describe next.
3.2.2 Weight Distribution Similarity (WDS)
WDS measures how similarly a system and human judges distribute their attention among different regions of an image when generating captions. Let and be the attention distributions derived from the grounding scores in and , respectively. We measure the distance between the two distributions via KL Divergence Kullback and Leibler (1951) as
| (11) |
where and .
In addition, we also find it useful to capture the difference in caption-image relevance between and . The relevance value of a caption-image pair can be approximated by using the module of each grounding vector. We use to denote the value difference term, defined as
| (12) |
Finally, letting , we get WDS between two grounding vectors using a sigmoid function as
| (13) |
where is the to-be-tuned temperature.
3.2.3 TIGEr Score
The TIGEr score is defined as the average value444We selected arithmetic mean by empirically observing the value variance between RRS and WDS in the [0, 1] interval.of RRS and WDS:
|
|
(14) |
The score is a real value of . A higher TIGEr score indicates a better caption as it matches better with the human generated captions for the same image.
4 Experiments
4.1 Dataset
Composite Dataset
The multisource dataset Aditya et al. (2015a) we used contains testing captions for 2007 MS-COCO images, 997 Flickr 8k pictures, and 991 Flickr 30k images. In total, there are 11,985 candidates graded by annotators on the description relevance from 1 (not relevant) to 5 (very relevant). Each image has three candidate captions, where one is extracted from human-written references, and the other two are generated by recently proposed captioning models Karpathy and Fei-Fei (2015); Aditya et al. (2015b).
Flickr 8K
The Flickr 8K dataset was collected by Hodosh et al. (2013), and contains 8092 images. Each picture is associated with five reference captions written by humans. This dataset also includes 5822 testing captions for 1000 images. Unlike the aforementioned two datasets, where testing captions are directly generated based on an image, candidates in Flickr 8K were selected by an image retrieval system from a reference caption pool. For grading, native speakers were hired to give a score from 1 (not related to the image content) to 4 (very related). Each caption was graded by three human evaluators, and the inter-coder agreement was around 0.73. Because 158 candidates are actual references of target images, we excluded these for further analysis.
Pascal-50S
The PASCAL-50S dataset Vedantam et al. (2015) contains 1000 images from the UIUC PASCAL Sentence dataset, of which 950 images are associated with 50 human-written captions per image as references, and the remainder of the images has 120 references for each picture. This dataset also contains 4000 candidate caption pairs with human evaluation, where each annotator was asked to select one candidate per pair that is closer to the given reference description. Candidate pairs are grouped by four types: 1) human-human correct (HC) contains two human-written captions for the target image, 2) human-human incorrect (HI) includes two captions written by human but describing different images, 3) the group of human-machine (HM) is contains a human-written and a machine-generated caption, and 4) machine-machine (MM) includes two matching-generated captions focusing on the same image.
4.2 Compared Metrics
Given our emphasis on metric interpretability and efficiency, we selected six rule-based metrics that have been widely used to evaluate image captions for comparison. The metrics are BLEU-1, BLEU-4, ROUGE-L, METEOR, CIDEr, and SPICE. We use MS COCO evaluation tool555https://github.com/tylin/coco-caption to implement all metrics. Before testing, the input texts were lowercased and tokenized by using the ptbtokenizer.py script from the same tool package.
4.3 Evaluation
Our examination of metric performances mainly focuses on the caption-level correlation with human judgments. Following prior studies Anderson et al. (2016); Elliott and Keller (2014), we use Kendall’s tau () and Spearman’s rho () rank correlation to evaluate pairwise scores between metrics and human decisions in the Composite and Flickr 8K datasets.
| Composite | Flickr8k | |||
|---|---|---|---|---|
| BLEU-1 | 0.280 | 0.353 | 0.323 | 0.404 |
| BLEU-4 | 0.205 | 0.352 | 0.138 | 0.387 |
| ROUGE-L | 0.307 | 0.383 | 0.323 | 0.404 |
| METEOR | 0.379 | 0.469 | 0.418 | 0.519 |
| CIDEr | 0.378 | 0.472 | 0.439 | 0.542 |
| SPICE | 0.419 | 0.514 | 0.449 | 0.596 |
| Ours | ||||
| RRS | 0.388 | 0.479 | 0.418 | 0.521 |
| WDS | 0.433 | 0.526 | 0.464 | 0.572 |
| TIGEr | 0.454 | 0.553 | 0.493 | 0.606 |
Since human annotation of the Pascal-50S data is a pairwise ranking instead of scoring, we kept consistency with the prior work Vedantam et al. (2015); Anderson et al. (2016) that evaluates metrics by accuracy. Different from Anderson et al. (2016) who considered equally-scored pairs as correct cases, our definition of a correct case is that the metric should assign a higher score to a candidate that was preferred by human annotators.
4.4 Result on Composite & Flickr 8K
Metric Performance
Table 1 displays the correlation between metrics and human judgments in terms of and . Based on both correlation coefficients, we achieved a noticeable improvement in the assessment of caption quality on Composite and Flick8K compared to the previous best results produced with existing metrics Anderson et al. (2016); Elliott and Keller (2014). Regarding the isolated impact of two similarity measures, we observe that WDS contributes more to caption evaluation than RRS. This finding indicates that the micro-level comparison of grounding similarity distribution is more sensitive to human judges than the macro-level contrast of image region rank by grounding scores.
TIGEr Score Analysis
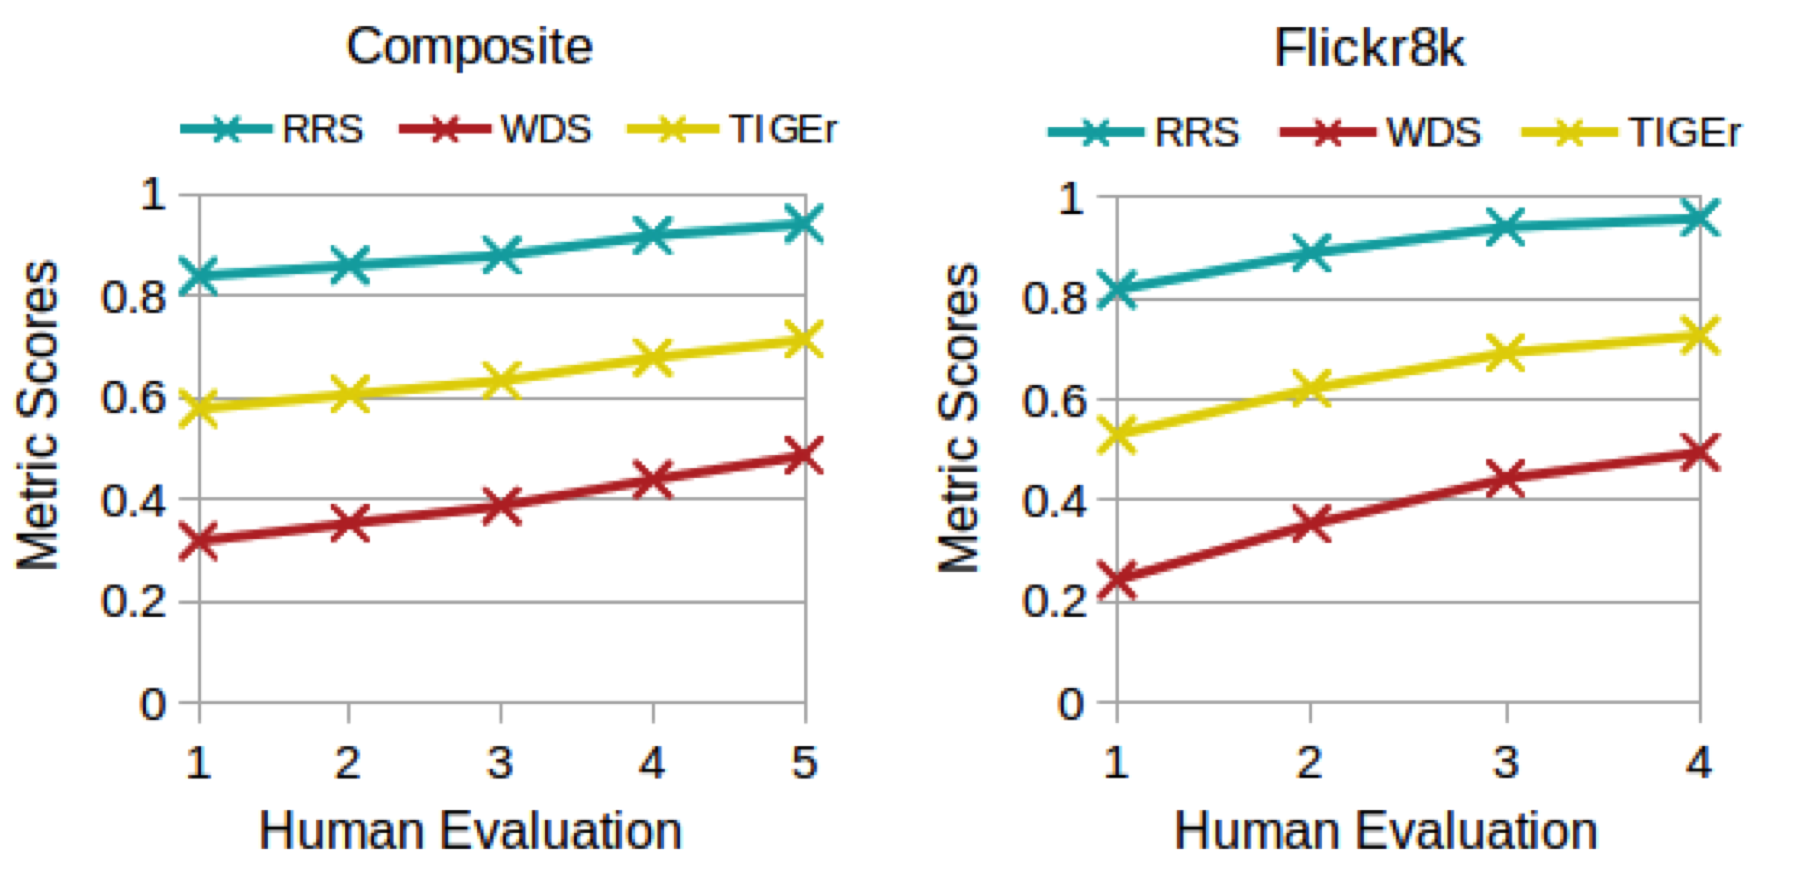
To understand the evaluation results of TIGEr, we further analyzed our metric scores based on the group of human scoring on caption quality. As shown in Figure 4, our metric scores are increasing according to the growth of human scores in both datasets. Overall, the growth rate of RRS is similar with the WDS score per dataset. Interestingly, the value of the metric scores increase more slowly in high-scored caption groups than in low-scored groups (Flickr8k), which suggests that the difference in caption relevance between adjacent high-scored groups (e.g., 3 vs. 4) is smaller than the descriptions in nearby low-scored groups. A more detailed error analysis and qualitative analysis is addressed in the Appendix.
4.5 Result on Pascal-50S
Fixed Reference Number
Table 2 reports the evaluation accuracy of metrics on PASCAL-50S with five reference captions per image. Our metric achieves higher accuracy in most pair groups except for HM and HC. Given all instances, TIGEr improves the closeness to human judgment by 2.72% compared to the best prior metric (i.e., METEOR). Among the four considered candidate groups, identifying irrelevant human-written captions in HI is relatively easy for all metrics, and TIGEr achieves the highest accuracy (99.80%). In contrast, judging the quality of two correct human-annotated captions in HC is difficult with a lower accuracy per metric compared to other testing groups. For this pair group, TIGEr (56.00%) shows a comparable performance with the best alternative metric (METEOR: 56.70%). More importantly, TIGEr reaches a noteworthy improvement in judging machine-generated caption pairs (MM) with an increasing in terms of accuracy by about 10.00% compared to the best prior metric (CIDEr: 64.50%).
Changing Reference Number
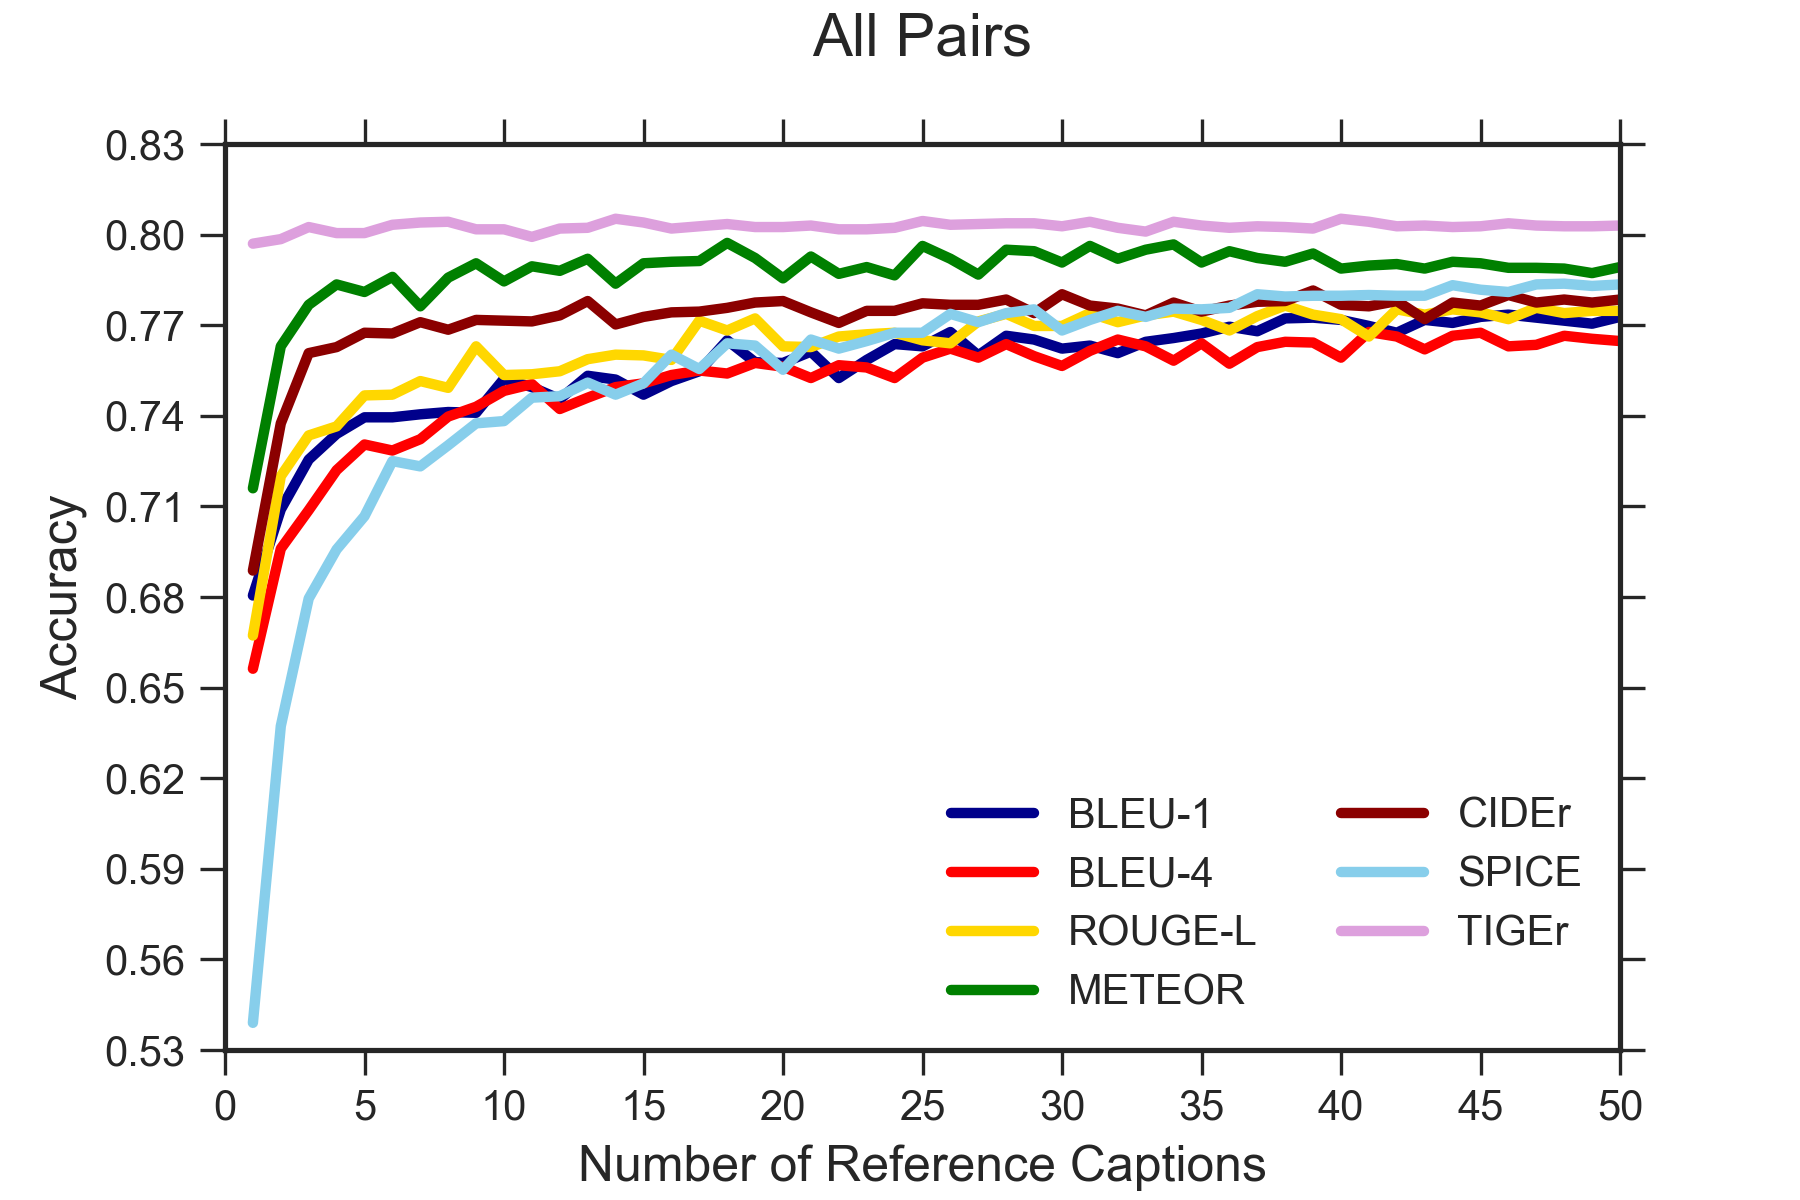
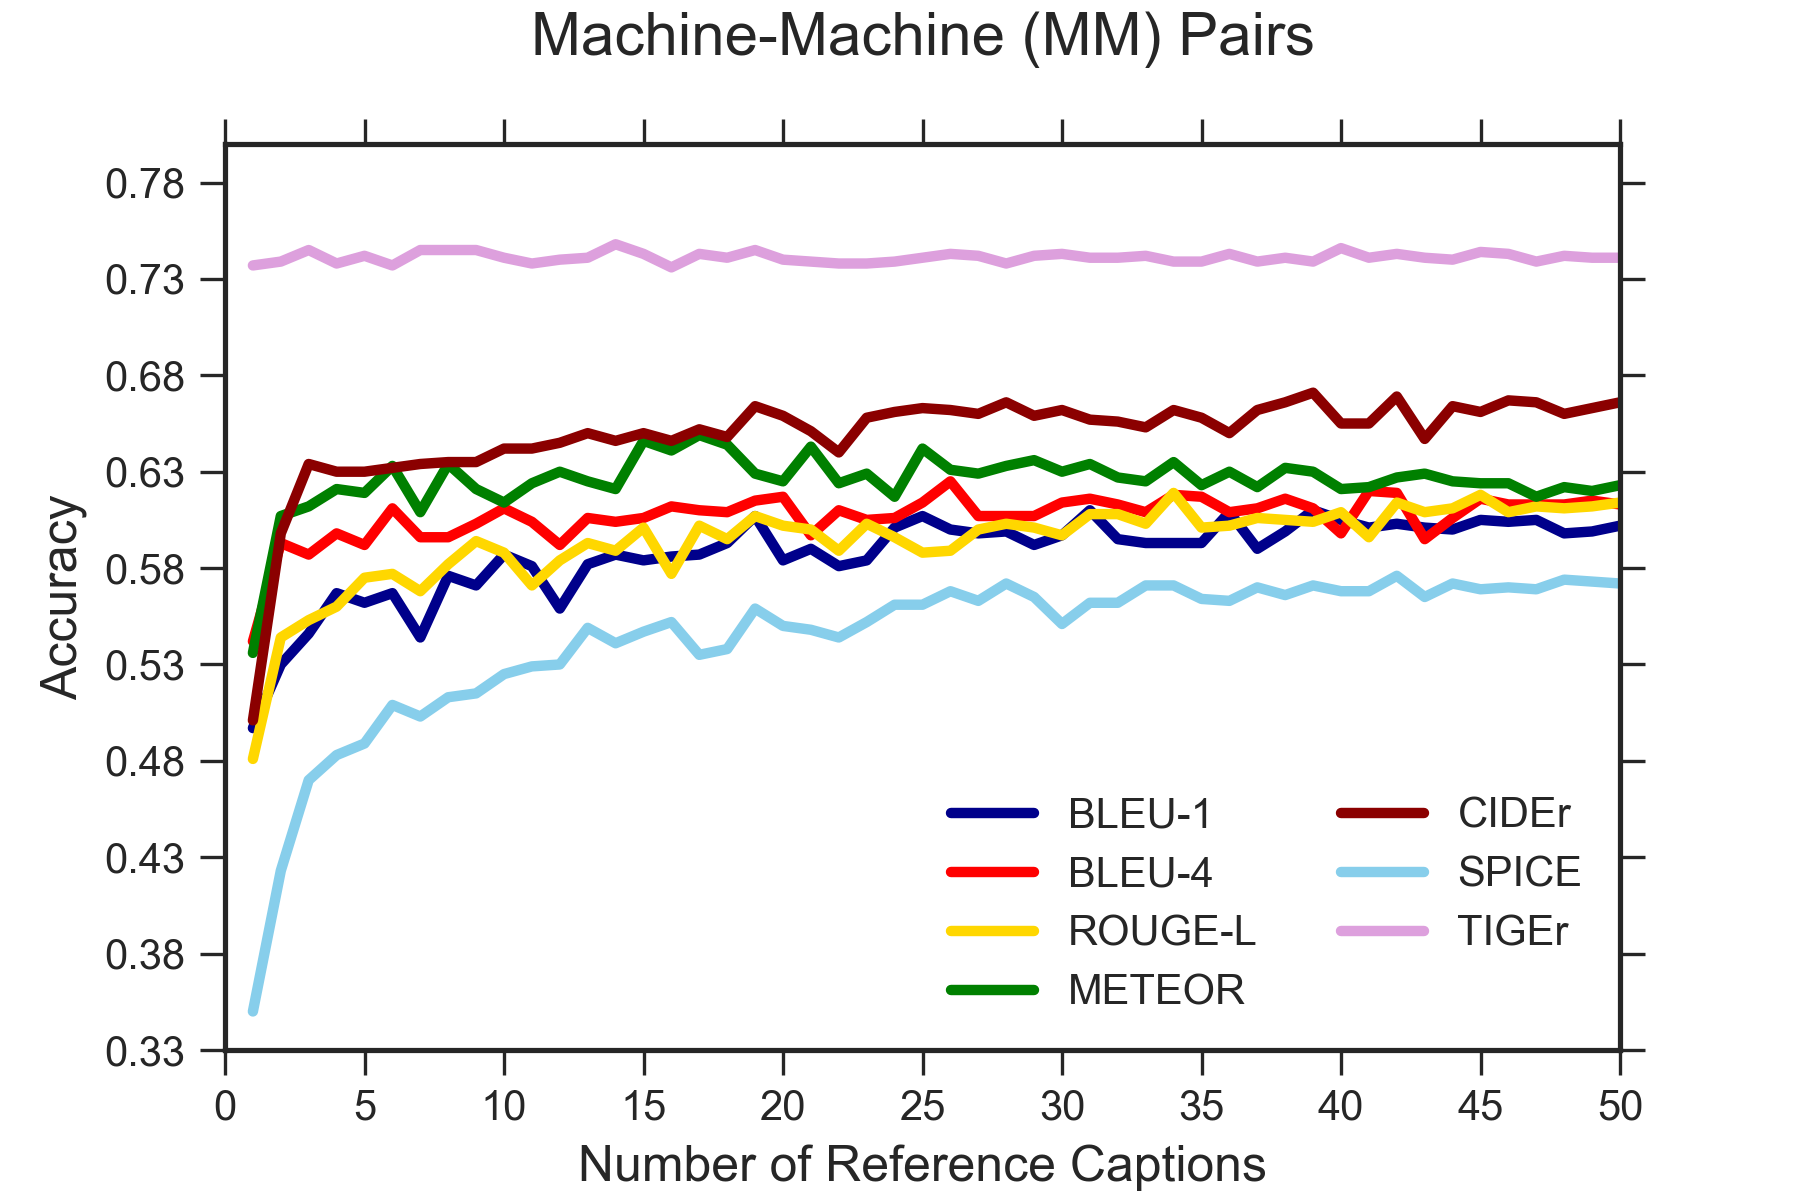
In order to explore the impact of reference captions on metric performance, we changed the number of references from 1 to 50. As shown in Figure 5, TIGEr outperforms prior metrics in All and MM candidate pairs by: 1) achieving higher accuracy, especially for small numbers of references; and 2) obtaining more stable performance results across varied reference sizes. Our findings suggest that TIGEr has low reference dependency. Compared with prior work Vedantam et al. (2015), the slight differences in results might be caused by the random choices for reference subsets.
| HC | HI | HM | MM | All | |
|---|---|---|---|---|---|
| BLEU-1 | 51.20 | 95.70 | 91.20 | 58.20 | 74.08 |
| BLEU-4 | 53.00 | 92.40 | 86.70 | 59.40 | 72.88 |
| ROUGE-L | 51.50 | 94.50 | 92.50 | 57.70 | 74.05 |
| METEOR | 56.70 | 97.60 | 94.20 | 63.40 | 77.98 |
| CIDEr | 53.00 | 98.00 | 91.50 | 64.50 | 76.75 |
| SPICE | 52.60 | 93.90 | 83.60 | 48.10 | 69.55 |
| TIGEr (ours) | 56.00 | 99.80 | 92.80 | 74.20 | 80.70 |
4.6 Text Component Sensitivity
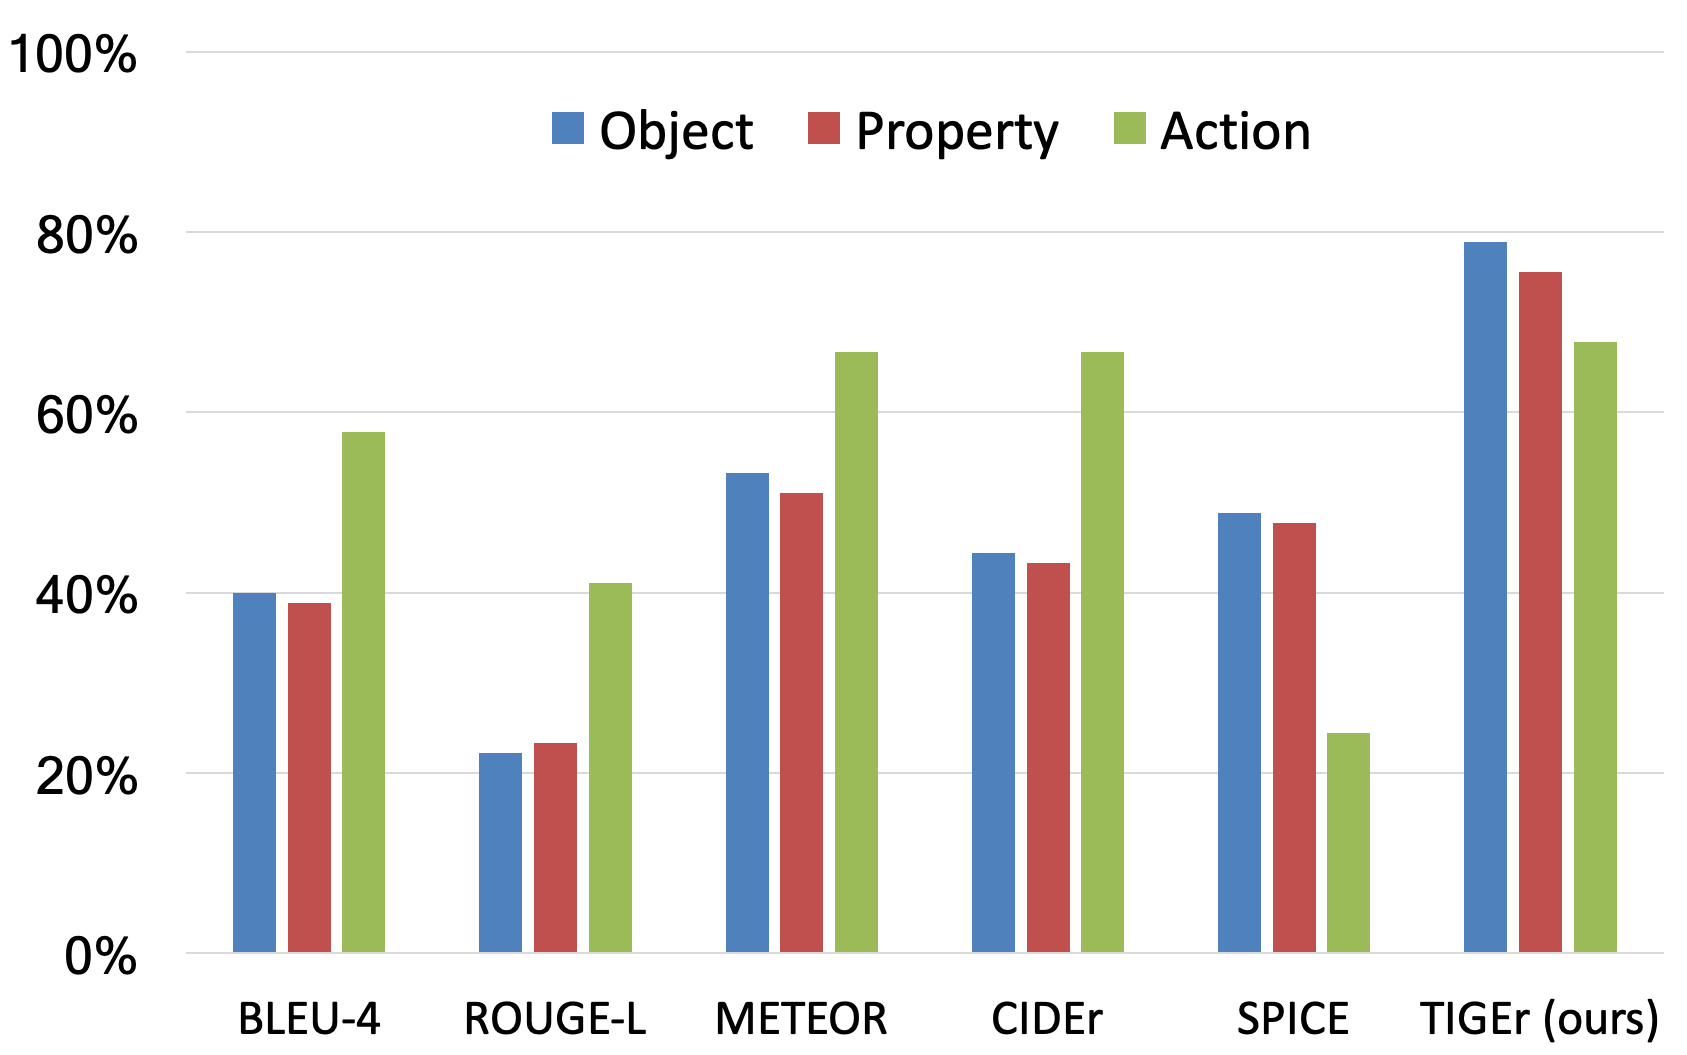
We also explore the metrics’ capability to identify specific text component errors (i.e., object, action, and property). We randomly sampled a small set of images from Composite and Pascal-50S. Given an image, we pick a reference caption and generate two candidates by replacing a text component. For example, we replaced the action “walk” from a reference “People walk in a city square” with a similar action “stroll” and a different action“are running” as a candidate pair. We then calculated the accuracy of pairwise ranking per metric for each component. As Figure 7 shows, TIGEr is sensitive to recognizing object-level changes while comparatively weak in detecting action differences. This implies that text-to-image grounding is more difficult at the action-level than the object-level. Similarly, SPICE also has a lower capability to identify action inconsistencies, which shows the limitation of scene graphs to capture this feature. In contrast, the n-gram-based metrics prefer to identify movement changes. To further study the sensitivity of TIGEr to property-level (i.e., object attributes) differences, we manually grouped the compared pairs based on their associated attribute category such as color. Our results show that states (e.g., sad, happy), counting (e.g., one, two), and color (e.g., red, green) are top attribute groups in the sampled data, where TIGEr can better identify the differences of the counting description (acc. 84.21%) compared to the expression of state (69.70%) and color (69.23%).
4.7 Grounding Analysis
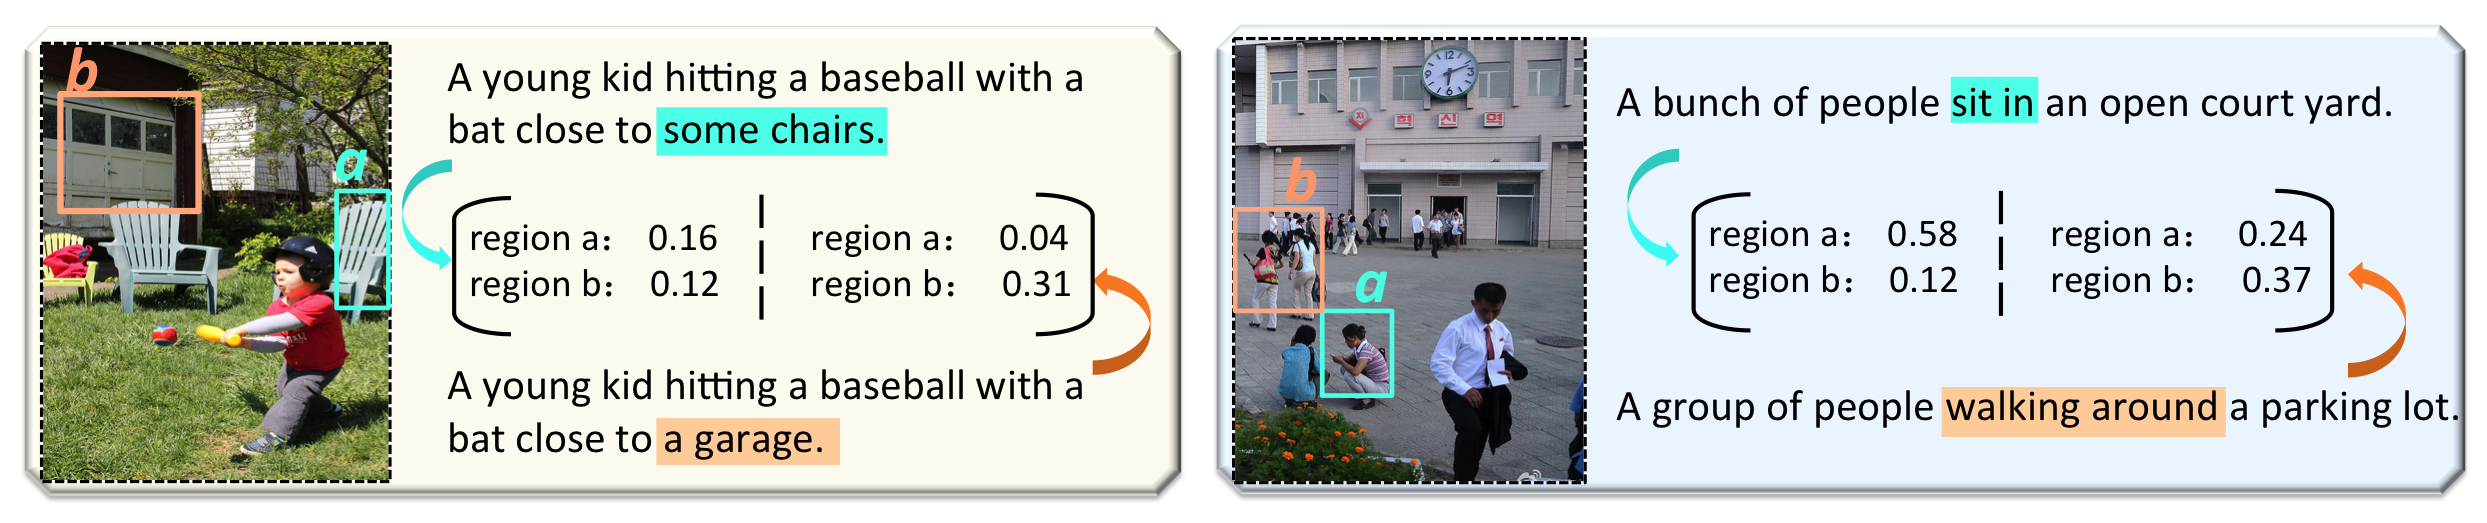
To analyze the process of text-to-image grounding behind TIGEr in depth, we visualize a set of matching cases of image-caption pairs. Figure 6 provides two illustrative examples. Interestingly, both captions per image are correct, but focus on different image parts. For instance, in the left image, caption 1 mentions “chairs”, which matches region a, while caption 2 relates to region b by addressing “garage”. According to our observation, the image region typically has a higher grounding weight with the corresponding caption than the other unrelated region. Our observations suggest that since captions are typically short, they may not cover the information of all regions of an image and hence taking image content into account for captioning evaluation is necessary.
5 Conclusion and Future Work
We have presented a novel evaluation metric called TIGEr for image captioning by utilizing text-to-image grounding result based on a pre-trained model. Unlike traditional metrics that are solely based on text matching between reference captions and machine-generated captions, TIGEr also takes the matching between image contents and captions into account , and the similarity between captions generated by human judges and automated systems, respectively. The presented experiments with three benchmark datasets have shown that TIGEr outperforms existing popular metrics, and has a higher and more stable correlation with human judgments. In addition, TIGEr is a fine-grained metric in that it identifies description errors at the object level.
Though TIGEr was build upon SCAN, our metric is not tied to this grounding model. The improvements with grounding models focusing on the latent correspondence between object-level image regions and descriptions will allow TIGEr to be further improved in the future. Since the pre-trained data mainly contains photo-based images, TIGEr primarily focuses on the caption evaluation in this image domain. For other domains, we can retrain the SCAN model using the ground-truth image-caption pairs, where the process is similar to applying a learning-based metric. In our future work, we plan to extend the metric to other visual-text generation tasks such as storytelling.
Acknowledgments
We appreciate anonymous reviewers for their constructive comments and insightful suggestions. This work was mostly done when Ming Jiang was interning at Microsoft Research.
References
- Aditya et al. (2015a) Somak Aditya, Yezhou Yang, Chitta Baral, Cornelia Fermuller, and Yiannis Aloimonos. 2015a. From images to sentences through scene description graphs using commonsense reasoning and knowledge. arXiv preprint arXiv:1511.03292.
- Aditya et al. (2015b) Somak Aditya, Yezhou Yang, Chitta Baral, Cornelia Fermuller, and Yiannis Aloimonos. 2015b. From images to sentences through scene description graphs using commonsense reasoning and knowledge. arXiv preprint arXiv:1511.03292.
- Anderson et al. (2016) Peter Anderson, Basura Fernando, Mark Johnson, and Stephen Gould. 2016. Spice: Semantic propositional image caption evaluation. In ECCV.
- Anderson et al. (2018) Peter Anderson, Xiaodong He, Chris Buehler, Damien Teney, Mark Johnson, Stephen Gould, and Lei Zhang. 2018. Bottom-up and top-down attention for image captioning and vqa. In CVPR.
- Bahdanau et al. (2015) Dzmitry Bahdanau, Kyunghyun Cho, and Yoshua Bengio. 2015. Neural machine translation by jointly learning to align and translate. In ICLR.
- Banerjee and Lavie (2005) Satanjeev Banerjee and Alon Lavie. 2005. Meteor: An automatic metric for mt evaluation with improved correlation with human judgments. In Proceedings of the ACL workshop.
- Bernardi et al. (2016) Raffaella Bernardi, Ruket Cakici, Desmond Elliott, Aykut Erdem, Erkut Erdem, Nazli Ikizler-Cinbis, Frank Keller, Adrian Muscat, and Barbara Plank. 2016. Automatic description generation from images: A survey of models, datasets, and evaluation measures. Journal of Artificial Intelligence Research.
- Chen et al. (2018) Hongge Chen, Huan Zhang, Pin-Yu Chen, Jinfeng Yi, and Cho-Jui Hsieh. 2018. Attacking visual language grounding with adversarial examples: A case study on neural image captioning. In ACL.
- Corston-Oliver et al. (2001) Simon Corston-Oliver, Michael Gamon, and Chris Brockett. 2001. A machine learning approach to the automatic evaluation of machine translation. In ACL.
- Cui et al. (2018) Yin Cui, Guandao Yang, Andreas Veit, Xun Huang, and Serge Belongie. 2018. Learning to evaluate image captioning. In CVPR.
- Dai et al. (2017) Bo Dai, Sanja Fidler, Raquel Urtasun, and Dahua Lin. 2017. Towards diverse and natural image descriptions via a conditional gan. In ICCV.
- Elliott and Keller (2014) Desmond Elliott and Frank Keller. 2014. Comparing automatic evaluation measures for image description. In ACL.
- Fang et al. (2015) Hao Fang, Saurabh Gupta, Forrest Iandola, Rupesh K Srivastava, Li Deng, Piotr Dollár, Jianfeng Gao, Xiaodong He, Margaret Mitchell, John C Platt, et al. 2015. From captions to visual concepts and back. In CVPR.
- Frome et al. (2013) Andrea Frome, Greg S Corrado, Jon Shlens, Samy Bengio, Jeff Dean, Tomas Mikolov, et al. 2013. Devise: A deep visual-semantic embedding model. In NeurIPS.
- Fukui et al. (2016) Akira Fukui, Dong Huk Park, Daylen Yang, Anna Rohrbach, Trevor Darrell, and Marcus Rohrbach. 2016. Multimodal compact bilinear pooling for visual question answering and visual grounding. In EMNLP.
- Gan et al. (2017) Zhe Gan, Chuang Gan, Xiaodong He, Yunchen Pu, Kenneth Tran, Jianfeng Gao, Lawrence Carin, and Li Deng. 2017. Semantic compositional networks for visual captioning. In CVPR.
- Gao et al. (2019) Jianfeng Gao, Michel Galley, and Lihong Li. 2019. Neural approaches to conversational ai. Foundations and Trends in Information Retrieval.
- Hodosh et al. (2013) Micah Hodosh, Peter Young, and Julia Hockenmaier. 2013. Framing image description as a ranking task: Data, models and evaluation metrics. Journal of Artificial Intelligence Research.
- Huang et al. (2019) Qiuyuan Huang, Zhe Gan, Asli Celikyilmaz, Dapeng Wu, Jianfeng Wang, and Xiaodong He. 2019. Hierarchically structured reinforcement learning for topically coherent visual story generation. In AAAI.
- Jabri et al. (2016) Allan Jabri, Armand Joulin, and Laurens van der Maaten. 2016. Revisiting visual question answering baselines. In ECCV.
- Järvelin and Kekäläinen (2002) Kalervo Järvelin and Jaana Kekäläinen. 2002. Cumulated gain-based evaluation of ir techniques. ACM Transactions on Information Systems.
- Karpathy and Fei-Fei (2015) Andrej Karpathy and Li Fei-Fei. 2015. Deep visual-semantic alignments for generating image descriptions. In CVPR.
- Karpathy et al. (2014) Andrej Karpathy, Armand Joulin, and Li F Fei-Fei. 2014. Deep fragment embeddings for bidirectional image sentence mapping. In NeurIPS.
- Karpathy and Li (2015) Andrej Karpathy and Fei-Fei Li. 2015. Deep visual-semantic alignments for generating image descriptions. In CVPR.
- Kiros et al. (2014) Ryan Kiros, Ruslan Salakhutdinov, and Richard S. Zemel. 2014. Unifying visual-semantic embeddings with multimodal neural language models. arXiv preprint arXiv:1411.2539.
- Kulesza and Shieber (2004) Alex Kulesza and Stuart M Shieber. 2004. A learning approach to improving sentence-level mt evaluation. In Proceedings of the 10th International Conference on Theoretical and Methodological Issues in Machine Translation.
- Kullback and Leibler (1951) Solomon Kullback and Richard A Leibler. 1951. On information and sufficiency. The annals of mathematical statistics.
- Lee et al. (2018) Kuang-Huei Lee, Xi Chen, Gang Hua, Houdong Hu, and Xiaodong He. 2018. Stacked cross attention for image-text matching. In ECCV.
- Lin (2004) Chin-Yew Lin. 2004. Rouge: A package for automatic evaluation of summaries. Text Summarization Branches Out.
- Lin et al. (2014) Tsung-Yi Lin, Michael Maire, Serge Belongie, James Hays, Pietro Perona, Deva Ramanan, Piotr Dollár, and C Lawrence Zitnick. 2014. Microsoft coco: Common objects in context. In ECCV.
- Lowe et al. (2017) Ryan Lowe, Michael Noseworthy, Iulian Vlad Serban, Nicolas Angelard-Gontier, Yoshua Bengio, and Joelle Pineau. 2017. Towards an automatic Turing test: Learning to evaluate dialogue responses. In ACL.
- Papineni et al. (2002) Kishore Papineni, Salim Roukos, Todd Ward, and Wei-Jing Zhu. 2002. Bleu: a method for automatic evaluation of machine translation. In ACL.
- Vedantam et al. (2015) Ramakrishna Vedantam, C Lawrence Zitnick, and Devi Parikh. 2015. Cider: Consensus-based image description evaluation. In CVPR.
- Wang et al. (2018a) Liwei Wang, Yin Li, Jing Huang, and Svetlana Lazebnik. 2018a. Learning two-branch neural networks for image-text matching tasks. PAMI.
- Wang et al. (2018b) Xin Wang, Wenhu Chen, Yuan-Fang Wang, and William Yang Wang. 2018b. No metrics are perfect: Adversarial reward learning for visual storytelling. In ACL.
![[Uncaptioned image]](https://cdn.awesomepapers.org/papers/c6cfa043-c1b5-476f-a6d6-366598657cc8/try_exp.png) |
Appendix A Appendices
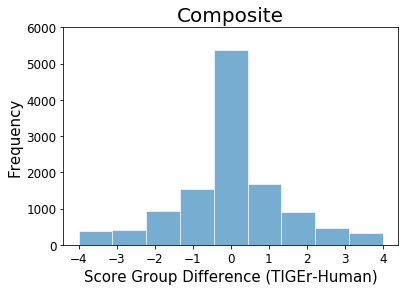
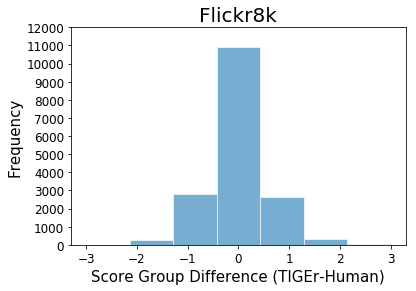
A.1 Error Analysis
To have a better understanding of inconsistent score ranks between TIGEr and human evaluation assigned to candidates in the Composite and Flick8k datasets, we further conducted an error analysis. Considering the score of TIGEr is continuous [0, 1], while human scoring is done on an n-point scale, we map our metric score onto the n-point scale by sorting instances according to TIGEr results, and assigning a score group per instance based on the distribution of human scores. Figure 8 shows the distribution of score group differences between TIGEr and human evaluation for both datasets. We observe that true positives (i.e., the score group of TIGEr is equal to the human score for a given caption) achieve higher frequency than each error group. On the other hand, inconsistent cases with the small differences of assigned scores (e.g., TIGEr assigns 3, while human assigns 4 to a testing caption) get a higher frequency than the notable difference between two metric scores, especially for the test cases from the Flickr8k dataset. Our finding suggests that captions with subtle quality difference are more difficult to be discriminated than instances with significant gaps.
A.2 Qualitative Analysis
To illustrate some characteristics of TIGEr more in depth, we show human and TIGEr scores for a set of caption examples in Table 3. In order to make the result of two metrics comparable, both the score group and actual grading value of TIGEr are displayed. Note that we provide an equal number of examples for each type of comparison result (i.e., either human or TIGEr score is higher than the other one & both scores are equal) in Table 3.
We find that TIGEr is able to measure a caption quality by considering the semantic information of image contents. For example, human-written references in case (e) primarily provide an overall description of all people shown in the image, while the candidate caption specifically describes two walking women in the image. Despite such difference at the text-level, TIGEr assigns a high score to this sentence - just like human evaluators. Case (b) also supports this finding to some extent. Unlike the references that specially described a baseball payer in the game, the candidate caption in this example provides a general description that is matching with the image content (e.g., “baseball game”, “at night”). This observation may help to explain why TIGEr gave this sentence a high score.
Besides, we find two challenges for caption evaluation based on TIGEr. First, though our metric improved evaluation performance by considering semantic information from both images and references, objects with closed semantic meaning such as ”laptop” and ”computer” in example (a) is limited to differentiate. Second, human interpretation inspired by the image is hard to be judged by an automatic evaluation metric. For example, in the case (d), “makes a wish as he blows the little pinwheels into the air” is a reasonable imagination of an human annotator, which cannot be explicitly observed from the image.