Topological time-series analysis with delay-variant embedding
Abstract
Identifying the qualitative changes in time-series data provides insights into the dynamics associated with such data. Such qualitative changes can be detected through topological approaches, which first embed the data into a high-dimensional space using a time-delay parameter and subsequently extract topological features describing the shape of the data from the embedded points. However, the essential topological features that are extracted using a single time delay are considered to be insufficient for evaluating the aforementioned qualitative changes, even when a well-selected time delay is used. We therefore propose a delay-variant embedding method that constructs the extended topological features by considering the time delay as a variable parameter instead of considering it as a single fixed value. This delay-variant embedding method reveals multiple-time-scale patterns in a time series by allowing the observation of the variations in topological features, with the time delay serving as an additional dimension in the topological feature space. We theoretically prove that the constructed topological features are robust when the time series is perturbed by noise. Furthermore, we combine these features with the kernel technique in machine learning algorithms to classify the general time-series data. We demonstrate the effectiveness of our method for classifying the synthetic noisy biological and real time-series data. Our method outperforms a method that is based on a single time delay and, surprisingly, achieves the highest classification accuracy on an average among the standard time-series analysis techniques.
pacs:
Valid PACS appear hereI Introduction
Time-series data can undergo qualitative changes such as transitioning from the quiescent state to oscillatory dynamics through a bifurcation. Identifying such changes enables deep understanding of the underlying dynamics; however, this is challenging when the data are subject to noise. In material science, topological features, which indicate the “shape” of the data, can be used to detect the qualitative changes, i.e., phase transitions Donato et al. (2016); Kusano et al. (2016) or transitions in morphological and hierarchical structures Ardanza-Trevijano et al. (2014); Nakamura et al. (2015); Hiraoka et al. (2016); Ichinomiya et al. (2017). Because topology is a qualitative property that is stable under the influence of noise, the topological features of time-series data are expected to reflect the qualitative changes in dynamics. These features are constructed through delay embedding, in which a time series is mapped to -dimensional points using delay coordinates on the embedded space, where denotes the predefined time delay and denotes the embedding dimension. Further, the embedded points form geometric features, such as clusters and loops, and the topological features, which monitor the emergence and disappearance of geometric features, can be used to characterize the dynamics of the system Maletić et al. (2016); Mittal and Gupta (2017).
Theoretically, for a noise-free time series of unlimited length, embeddings with the same value of but different values of time delay are considered to be equivalent in terms of “optimal” reconstruction Takens (1981). Herein, the reconstruction that preserves the invariants of dynamics, such as the fractal dimension and the Lyapunov exponent, when the time series is embedded can be referred to as optimal reconstruction. However, because a real time series is noisy and because of finite length, the selection of is considered to be an inherently difficult problem. Instead of being based on mathematically rigorous criteria, majority of the methods that are required for the selection of are observed to be based on heuristics, i.e., they involve a tradeoff between redundance and irrelevance in case of successive delay coordinates Casdagli et al. (1991). Traditional methods determine as the first time scale that maximizes the indices of independence such as linear independence and nonlinear independent information Fraser and Swinney (1986), and the correlation sum Liebert and Schuster (1989). Meanwhile, the geometry-based strategies that are used for estimating examine the measures that are required for expanding the attractor in the reconstructed phase space Buzug and Pfister (1992a, b); Rosenstein et al. (1994). However, the optimal value of exhibits no definite theoretical properties because has no theoretical relevance in the mathematical framework of delay embedding Kantz and Schreiber (2003). Furthermore, there is no universal strategy for selecting , and the value of that works well for one application may not work well for another application even though the same data may be used Bradley and Kantz (2015). Therefore, the optimal selection of depends on the objective of the analysis and is obtained by trial and error without using any systematic method. This defect limits the power of topological features in time-series data analysis.
Herein, we propose a delay-variant embedding method in which the topological features are constructed by considering as the variable parameter; using this method, the topological changes are monitored in the embedded space. Embedding with a single value of is sensitive to noise; further, considering a range of can provide useful information with which the dynamics can be understood. We theoretically prove the stability of constructed features against noise and apply these features to classification of several time-series datasets. We demonstrate that our method outperforms a method that is based on a single value of in classifying the oscillatory activity of synthetic noisy biological data. Surprisingly, in classifying real time-series data, our approach demonstrates a higher accuracy on an average when compared to several standard techniques that are used for performing time-series analysis.
II Method
II.1 Topological features from time-series data with delay-variant embedding
To qualitatively evaluate the characteristics of the time series, we apply topological data analysis Carlsson (2009), which is a computational method that can be used for characterizing the topological features of high-dimensional data. We construct a simplicial-complex model Edelsbrunner and Harer (2010) from the points in the embedded space and obtain the topological information as the number, position, and size of single- or multi-dimensional clusters and loops. We build a complex over a set of points if the pairwise distances between them are less than or equal to , where is a given non-negative scale parameter. Different values of result in different complexes and different topological information. If is considerably small, no connections are created; further, the resulting simplicial complex is not different when compared to the original points. As we gradually increase , connections appear between the points; however, if becomes considerably large, all the points are connected with each other, and no useful information can be conveyed. If we increase as , we obtain a sequence of embedded simplicial complexes that can be referred to as filtration (see Appendix A).
We use persistent homology theory Edelsbrunner et al. (2002); Zomorodian and Carlsson (2005) to study the topological features across filtration. A practical way to visualize the results of persistent homology is through multi-set points in the two-dimensional persistence diagram. In this diagram, each point represents an -dimensional hole (i.e., the connected components are zero-dimensional, loops and tunnels are one-dimensional holes, and voids are two-dimensional holes) that appears at (known as the birth scale) and disappears at (known as the death scale) across the filtration (see Appendix A). This information encapsulates the topological features of the time series after embedding and provides valuable insights into the behavior of a dynamical system; for instance, the emergence of an oscillation in a time series can be attributed to the birth of a loop in the embedded space. Using these features, the qualitative properties of the time series can be captured in a robust and efficient manner.
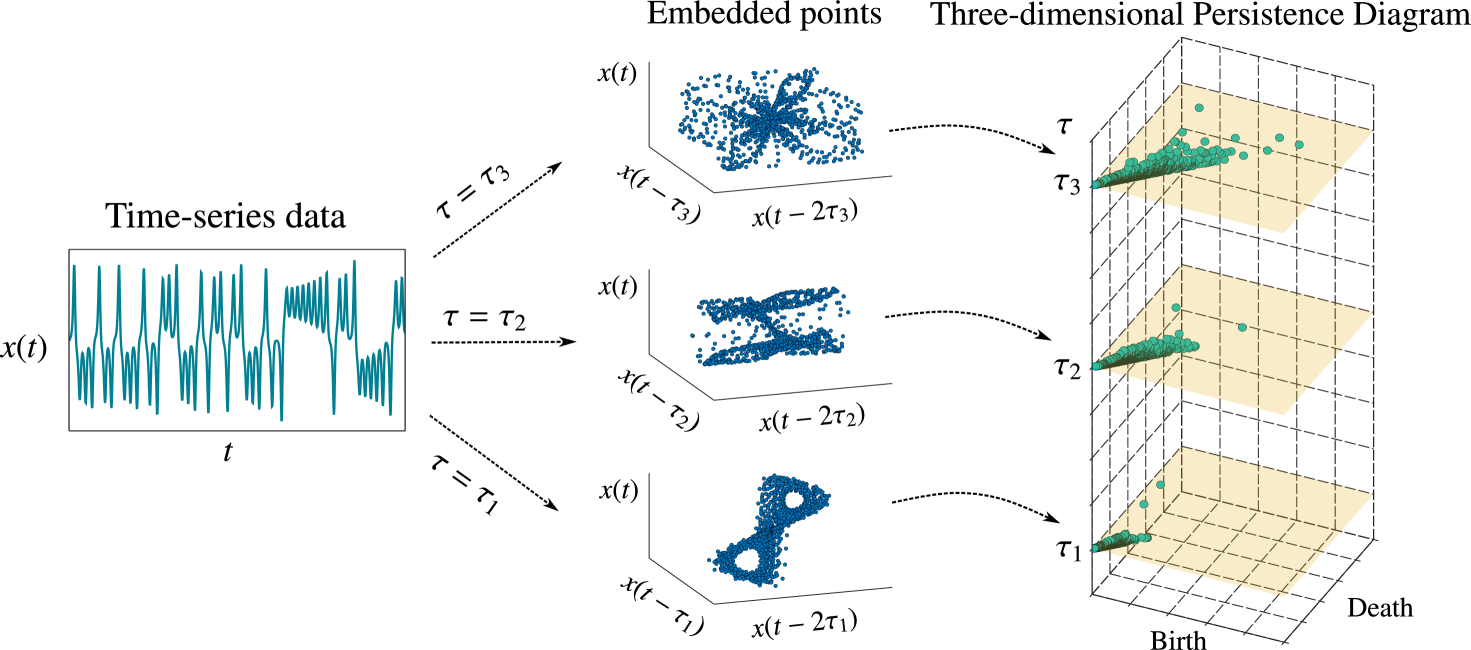
For the observed time series , we use to denote the two-dimensional persistence diagram calculated for -dimensional holes from the embedded points with time delay . We consider in a predefined set , where ( denotes the size of the set). The three-dimensional persistence diagram for time series can be defined as
| (1) |
Figure 1 shows a schematic of the three-dimensional persistence diagram for loops and tunnels (one-dimensional holes), wherein the embedded points exhibit different shapes and topological features for different values of . In the middle panel of Fig. 1, there are two big loops for , whereas loops survive for short times with different distributions of birth and death scales (right panel) for and . This information cannot be obtained using a single value of in the embedding.
II.2 Stability of topological features
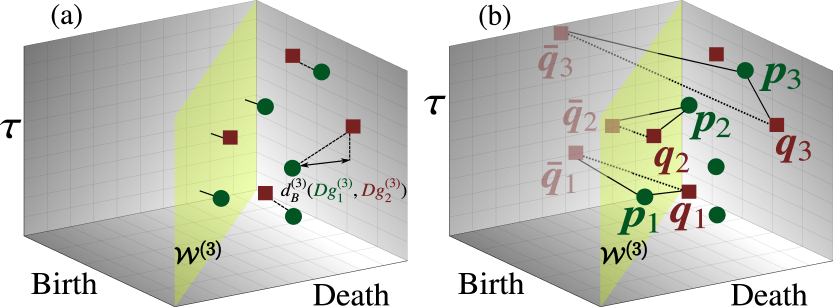
Time-series data tend to be considerably noisy, which is a feature that can be considered to be either a measurement artifact or an inherent part of the dynamics themselves. Therefore, the persistence diagram should be stable with respect to the data being perturbed by noise. To evaluate the stability of the persistence diagram, we introduce the concept of bottleneck distance as a metric structure for comparing the persistence diagrams. Given two three-dimensional persistence diagrams and , consider all matchings such that a point on one diagram can be matched either to a point on the other diagram or to its projection on the diagonal plane (Fig. 2(a)). For each pair for which and , we define the relative infinity-norm distance between and as , where is a positive rescaling coefficient introduced to adjust the scale difference between the point-wise distance and time. The bottleneck distance can be defined as the infimum of the longest matched relative infinity-norm distance over all matchings :
| (2) |
We show that three-dimensional persistence diagrams are stable with respect to the bottleneck distance under perturbation applied to the time series. Given two time series and of the same length, let and be their three-dimensional persistence diagrams respectively, as calculated for the embedding dimension . Based on the stability properties of two-dimensional persistence diagrams Chazal et al. (2014), we can prove the following stability property of three-dimensional pesistence diagrams (see Appendix B):
| (3) |
for an arbitrary positive . If we identify as the perturbed data obtained by adding noise to , Eq. (3) shows that the upper limit of the bottleneck distance between and is governed by the magnitude of the noise. Thus, the inequality of Eq. (3) states that our three-dimensional persistence diagrams are robust with respect to the time-series data being perturbed by noise. Therefore, these diagrams can be used as discriminating features for characterizing the time series.
II.3 Kernel method for the topological features
To use the persistence diagrams as features for performing the statistical learning tasks, such as classification, we must define a similarity measure, such as kernel mapping, for such diagrams Reininghaus et al. (2015); Kusano et al. (2016); Carrière et al. (2017). Because the points that are close to can be considered to be insignificant topological features, they should not influence the computed value of this kernel. Given the positive bandwidth and the positive rescaling parameter , the kernel between two three-dimensional persistence diagrams and can be defined as
| (4) |
where is a symmetric point of with respect to and , , with and . If or is near , i.e., or , then and the pair will have a minor influence on the value of the kernel (Fig. 2(b)). Based on Ref. Reininghaus et al. (2015), we can prove that is a positive-definite kernel (see Appendix C). When we apply to time-series classification, the parameters and are observed to affect the classification performance and can be chosen either by cross-validation or in a heuristic manner Gretton et al. (2008) (see Appendix C). In our classification tasks, we use the normalized version of the kernel, which can be calculated as where and denote two persistence diagrams. The source code that has been used to calculate the persistence diagrams and kernels can be found on GitHub Tran and Hasegawa .
III Results
III.1 Classification of the synthetic oscillatory and non-oscillatory data
Initially, the proposed method is applied to classify periodic and aperiodic time series using synthetic single-cell data. This is challenging because of the difficulty associated with discriminating between an oscillation containing noise and a mere noisy fluctuation Phillips et al. (2017). We generate synthetic mRNA and protein time-series data from a stochastic model of the Hes1 genetic oscillator Monk (2003); Galla (2009) exhibiting negative autoregulation with delay. We use the delayed version of the Gillespie algorithm Gillespie (1977); Anderson (2007) to generate data from 1,000 cells in both the oscillatory and non-oscillatory parameter regimes Galla (2009); Brett and Galla (2013). We measure the protein levels after every (= 64, 32, 16, 8) min for 4,096 min. We normalize the time series to have zero mean and unit variance; further, we add Gaussian white noise with variance to assess the robustness of the method.
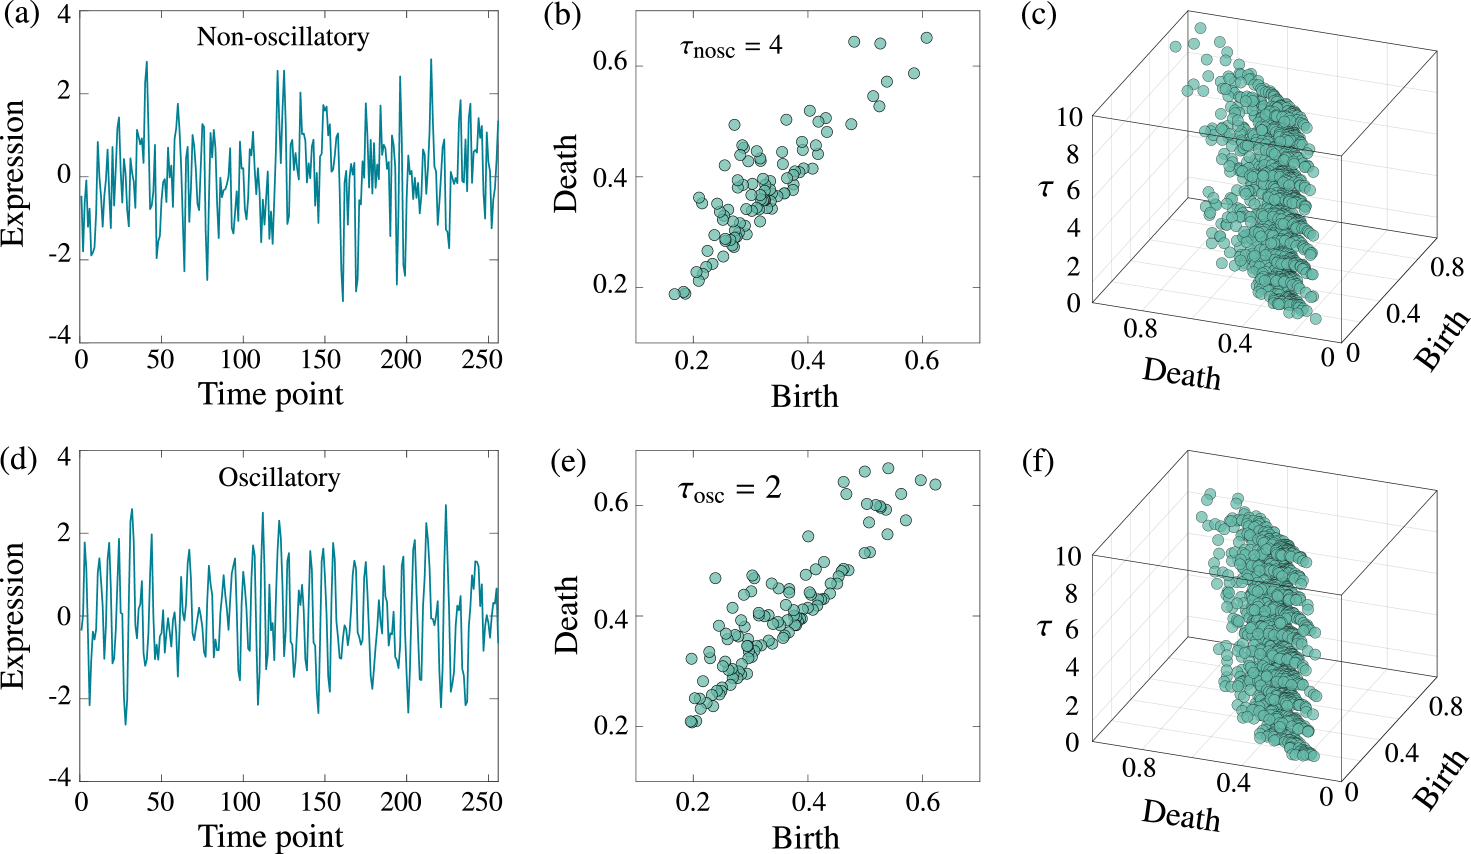
Figure 3 depicts the examples of the time series and persistence diagrams for the two regimes with an embedding dimension of . Figures 3(a) and (d) show the time series generated by the measurements in the non-oscillatory and oscillatory regimes, respectively, after every min, and Figs. 3(b) and (e) denote their respective two-dimensional persistence diagrams computed from the single-delay embedding. In Figs. 3(b) and (e), is selected by the mutual-information method to maximize the statistical measure of nonlinear independence in the delay coordinates of the embedded points Fraser and Swinney (1986). Figures 3(c) and (f) depict the three-dimensional persistence diagrams obtained using Fig. 3(a) and (d), respectively, with time-delay values as . In these examples, it is difficult to distinguish between the two regimes using either the original time series or the two-dimensional diagrams, whereas there is a distinct pattern in the three-dimensional diagrams because all the topological variations are considered when changes. In the three-dimensional diagram of the non-oscillatory data, the points, which represent the loops in the embedded space, are extensively distributed along the birth and death scales, corresponding to the random fluctuation in the time series. In contrast, in the oscillatory data, points are densely distributed along the birth and death scales; this manifests the appearance of repeated loop patterns in the embedded space, thereby indicating periodic patterns in the time series.
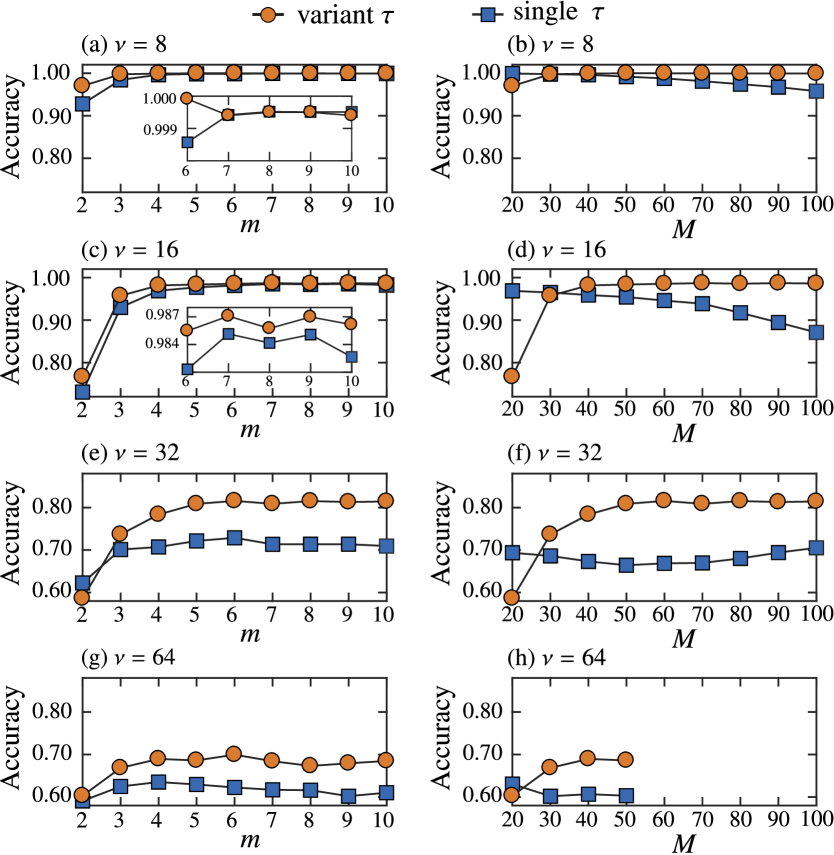
Further, we assess the effectiveness of the proposed topological features by classifying the data obtained from the Hes1 model, which can be randomly split with equal probability to belong to the training and test sets. We use the support vector machine Bishop (2006) to perform classification in the kernel space. In the delay-variant method, we consider time-delay values as . In the single-delay method, we choose a single value of for each value from . For each embedding dimension of the single-delay method, we use the maximum accuracy in the test dataset over all the values of for performing comparison with the delay-variant method. Figure 4 depicts the average classification accuracy obtained using 100 random splits at different embedding dimensions and different measurement intervals (Fig. 4(a)), (Fig. 4(c)), (Fig. 4(e)), and (Fig. 4(g)). When the same embedding dimension is being used, the total dimension for the delay-variant method () is observed to be higher than that for the single-delay method (). In the classification task, the high-dimensional features tend to achieve high classification accuracies. Therefore, to ensure that a fair comparison between the single-delay method and the delay-variant method can be performed, we define the effective embedding dimension as and further compare the accuracy for different values of with (Fig. 4(b)), (Fig. 4(d)), (Fig. 4(f)), and (Fig. 4(h)). For (Fig. 4(h)), we do not consider embeddings with because the length of the time series is 64.
When the comparison is performed over the embedding dimension , Fig. 4 depicts that both the methods will achieve almost the same accuracy when the time series is long enough () at . In the single-delay method, should be selected by cross-validation for performing a fair comparison; however, even with trial and error to obtain the maximum accuracy in the test dataset in the single-delay method, our delay-variant method still performs better. When is increased, the time series is reduced, thereby increasing the difficulty of classification; regardless, the delay-variant method attains a higher accuracy than the single-delay method. For , the delay-variant method outperforms the single-delay method over a wide range of () in terms of the accuracy. This observation indicates that the single-delay method degrades quickly with a shorter time series because it is highly sensitive to the choice of . However, by considering a range of with delay embedding, this sensitivity can be reduced, thereby achieving stable performance.
While performing the comparison over the effective embedding dimension , the accuracy of the delay-variant method does not change over a wide range of (), indicating that this method is more reliable than the single-delay method (Fig. 4(b), (d), (f), and (h)). For a given effective dimension, the embedded points of single-delay method become highly folded and excessively sparse in a high-dimensional space because the embedding dimension that is used in the single-delay method is considerably higher than that used in the delay-variant method. Furthermore, selecting a considerably high embedding dimension increases the computational complexity of the embedding and causes the high impact of noise acting in a high proportion of elements in delay coordinates. Therefore, selecting a considerably high embedding dimension makes it disadvantageous to use topological features for characterizing the time series, thereby degrading the classification performance.
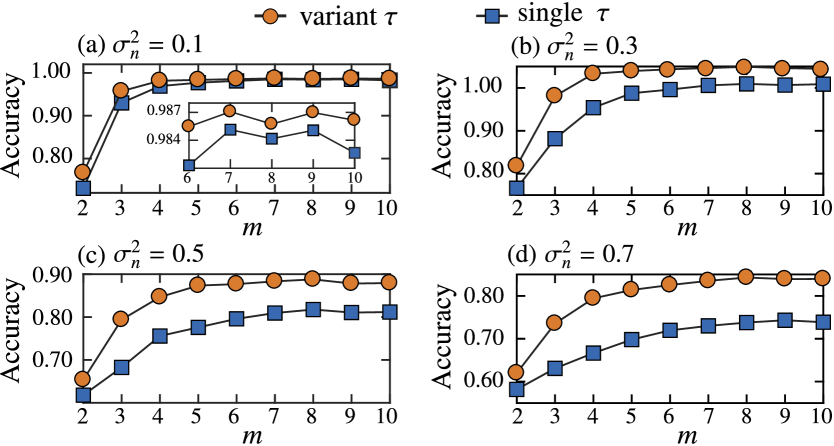
To demonstrate that the delay-variant method is more robust than the single-delay method when the time series is being perturbed by noise, we compare the two aforementioned methods based on the values of the noise variance of 0.1, 0.3, 0.5, and 0.7. Figure 5 depicts the average classification accuracy versus the embedding dimension over 100 random splits at a measurement interval of min when the noise variance (Fig. 5(a)), (Fig. 5(b)), (Fig. 5(c)), and (Fig. 5(d)). As is increased, the classification becomes more difficult because the time-series data become noisier. Even so, the delay-variant method still outperforms the single-delay method over . Furthermore, the single-delay method degrades more quickly as is increased, thereby indicating that our delay-variant method is more robust and stable in noisy conditions than the single-delay method.
III.2 Classification of the real time-series data
Further, we evaluate the performance of the delay-variant method in classifying different heartbeat-signal patterns based on six real electrocardiogram (ECG) datasets in Chen et al. (2015), namely ECG200 (separate normal and myocardial infarction heartbeats; 200 time series of length 96), ECG5000 (separate five levels of congestive heart failure; 5,000 time series of length 140), ECGFiveDays (separate records from two different days for the same patient; 884 time series of length 136), TwoLeadECG (separate records from two different leads; 1,162 time series of length 82), and Non-InvasiveFetalECGThorax1 and Non-InvasiveFetalECGThorax2 (separate records from the left and right thorax with expert labeling of 42 classes of non-invasive fetal ECG; 3,765 time series of length 750 in each dataset). We use the delay-variant method to classify the Caenorhabditis elegans roundworms from EigenWorms dataset as either wild or mutant based on their movements Brown et al. (2013); Yemini et al. (2013). The movement trajectories are processed as 259 time series of length 900. Finally, we denote that our method can be used to diagnose whether a certain symptom can be observed in an automotive subsystem using the time-series data associated with the engine noise with the FordB dataset for 4,446 time series of length 500 Chen et al. (2015). Here, the training data in the FordB dataset were collected under typical operating conditions, whereas the test data were collected under noisy conditions. For these datasets, we employ the train-test split provided in Chen et al. (2015). For the Non-InvasiveFetalECGThorax1, Non-InvasiveFetalECGThorax2, EigenWorms, and FordB datasets, we downsampled the time series with sampling rates as 2, 2, 3, and 2, respectively, before computing the persistence diagrams.
In the delay-variant method, we use time-delay values of with embedding dimensions of . In the single-delay method, we choose single for each value from . For each embedding dimension of the single-delay method, we use the maximum accuracy in the test dataset over all values of to compare with the delay-variant method. In both the methods, we use a linear combination of normalized kernels for the zero-dimensional and one-dimensional holes. The combination weights and the embedding dimension are selected by cross-validation (see Appendix C). Further, we compare the delay-variant and single-delay methods along with some alternative standard approaches. Most of the previous research on time-series classification focused on finding appropriate similarity measures for the -nearest neighbor (NN) classifier. For ensuring similarity in the time domain, we consider either the Euclidean (E) or dynamic time warping (D) distance. For ensuring similarity in the frequency domain and for similarity in the autocorrelation, we consider the power spectrum (PS) and the autocorrelation function (AC). We also examine the elastic ensemble (EE) Lines and Bagnall (2014) as a combination of nearest neighbor classifiers using multiple distance measures in the time domain. Finally, we perform the learned-shapelets (LS) method, which classifies time series by learning the representative shapelets (i.e., short discriminant time-series subsequences) Grabocka et al. (2014). Instead of implementing these standard algorithms, we use the results from Ref. Bagnall et al. (2016, ). The test results are presented in Table 1, wherein the best and second-best accuracy scores of each dataset are colored in dark pink and light pink, respectively. The delay-variant method shows better results than the single-delay method for all the datasets and outperforms all the other algorithms on an average. Further, the delay-variant method offers the best results for four of the eight datasets and the second-best results for the remaining four, suggesting that our method is an effective mechanism to classify the time series.
| Data | Delay variant | Single delay | NN (E) | NN (D) | NN (AC) | NN (PS) | EE | LS |
|---|---|---|---|---|---|---|---|---|
| ECG200 | 90.0 | 87.0 | 88.0 | 88.0 | 82.0 | 86.0 | 88.0 | 88.0 |
| ECG5000 | 93.6 | 92.1 | 92.5 | 92.5 | 91.0 | 93.6 | 93.9 | 93.2 |
| Thorax1 | 91.8 | 78.2 | 82.9 | 82.9 | 72.1 | 87.5 | 84.6 | 25.9 |
| Thorax2 | 93.0 | 83.6 | 88.0 | 87.0 | 75.2 | 88.4 | 91.4 | 77.0 |
| FiveDays | 99.9 | 92.0 | 79.7 | 79.7 | 98.1 | 100.0 | 82.0 | 100.0 |
| TwoLead | 99.4 | 94.0 | 74.7 | 86.8 | 80.4 | 96.1 | 97.1 | 99.6 |
| Worms | 83.1 | 83.1 | 61.0 | 58.4 | 76.6 | 81.8 | 68.8 | 72.7 |
| FordB | 90.8 | 78.2 | 60.6 | 59.9 | 78.0 | 79.0 | 66.2 | 91.7 |
III.3 Multiple-time-scale patterns captured by delay-variant embedding
Subsequently, we investigate the types of features that can be effectively captured using the delay-variant method. Because the time scale of the extracted pattern is partially dependent on the time delay, the delay-variant method should be able to extract the patterns that comprise multiple different time scales. To better understand this ability, we analyze the synthetic noisy time series obtained from a frequency-modulated model. Given the original signal with a carrier signal , we consider the modulated signal to be , where , , , and . Further, we consider the frequency to be with to represent patterns with multiple time scales in the modulated signal. For each value of , we generate 20 noisy discrete time series , where , , and denote the Gaussian white noise with a variance of 0.1.
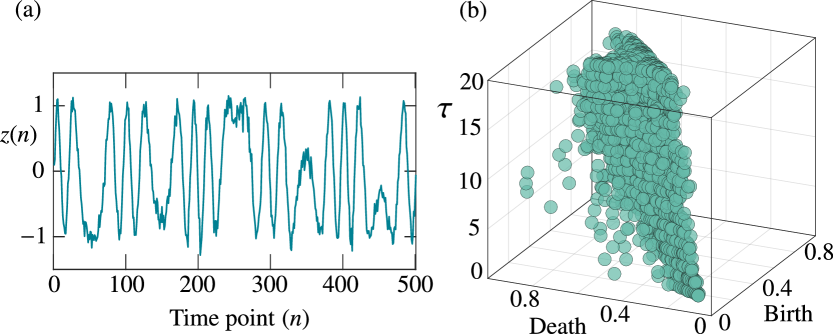
In the delay-variant method, we use time-delay values of . Figure 6 depicts a time series with and its three-dimensional persistence diagram for the loops or cycles at an embedding dimension of . In the persistence diagram, the points near the diagonal plane represent the noise in the time series, whereas the points that are away from represent significant cycles in the embedded space. Therefore, the points in the diagram that has been plotted for different values of reveal the multiple-time-scale components in the time series corresponding to the limit-cycle oscillations of the dynamics.
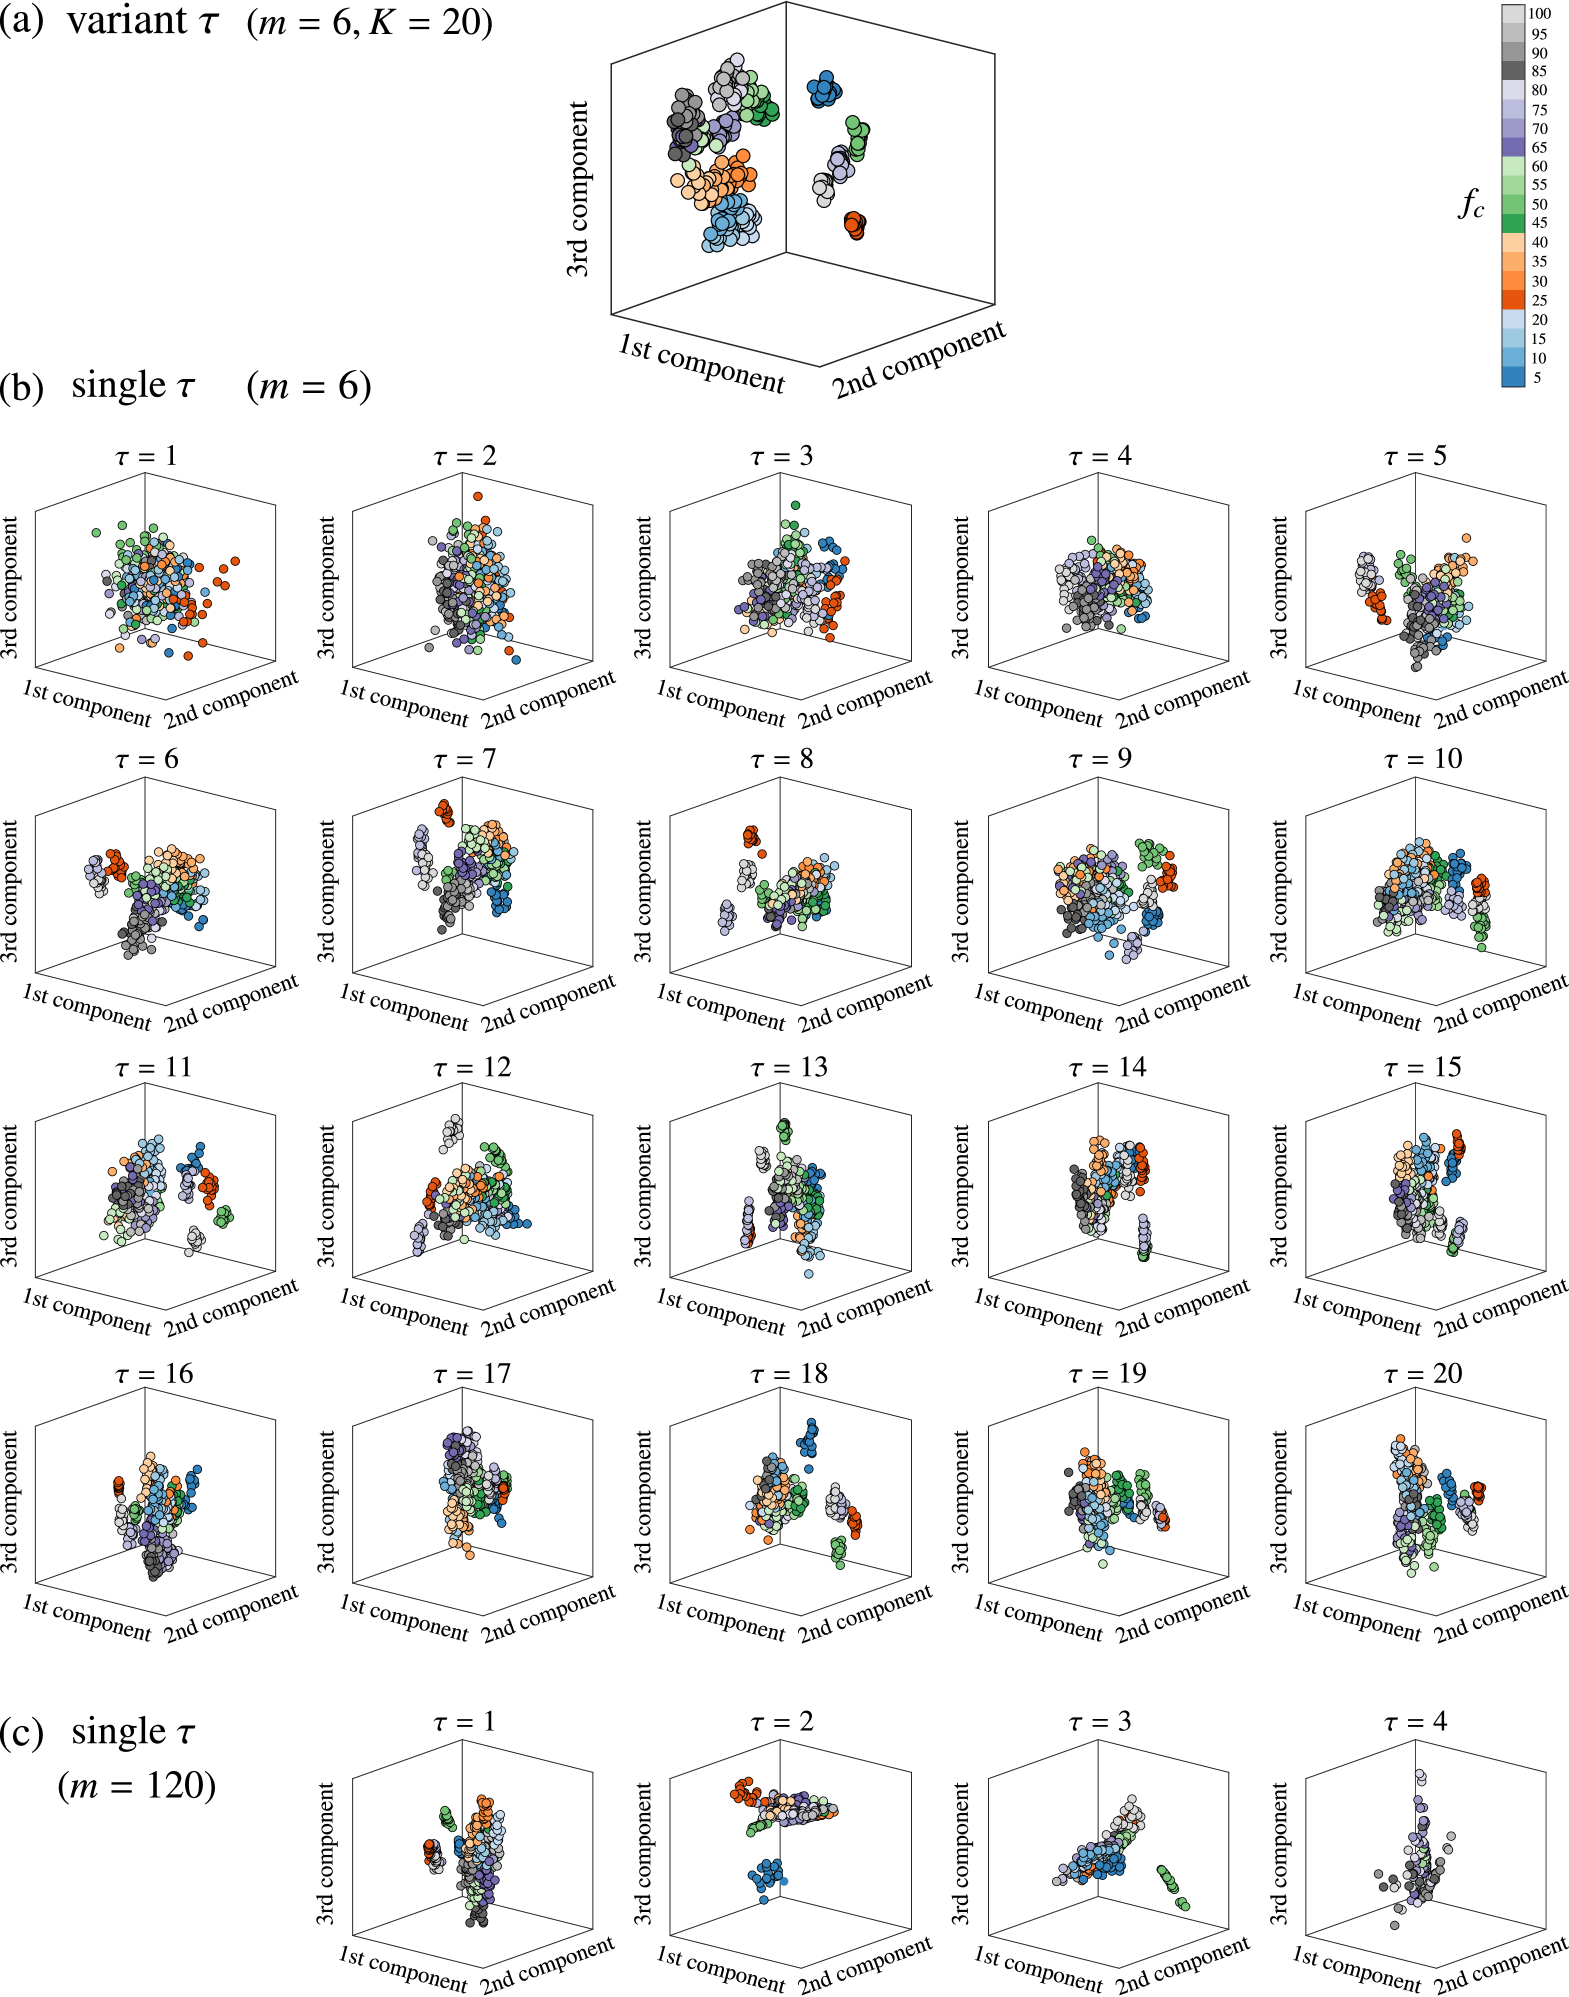
An example of the principal component projection from the kernel space is depicted in Fig. 7 for (a) the delay-variant method with embedding dimension , (b) the single-delay method with and , and (c) the single-delay method with (to compare with the delay-variant method at the same effective embedding dimension ). Because the length of the time series is 501, in the single-delay approach, can only take values from when . Different colors represent the data generated using different values of . Figure 7 depicts that the delay-variant method results in more distinct regions corresponding to different values of than that obtained using the single-delay method. Note that the points obtained using the single-delay method cannot be distinct, regardless of the angle. These results denote that the delay-variant method is superior to the single-delay method with respect to the ability to identify changes in the multiple-time-scale patterns in time series.
IV Concluding remarks
We have demonstrated that the topological features that are constructed using delay-variant embedding can capture the topological variation in a time series when the time-delay value changes. Therefore, these features can be used to discriminate between different time series. Theoretically, we have mathematically denoted that these features are robust when the time series is being perturbed by noise. Our method outperformed the standard time-series analysis techniques while classifying both synthetic and real time-series data. These results indicate that the topological features that are deduced with delay-variant embedding can be used to reveal the representative features of the original time series.
In general, the mathematical model of a time series denotes a stochastic process. It is important to understand the factor that distinguishes this model from other models with respect to the dynamics. Recent powerful deep learning methods have focused on accurately classifying time series with predefined labels without identifying the essential behavior of the model. Unfortunately, these approaches could fail when the input is slightly but deliberately perturbed, resulting in misclassification by a neural network. Such perturbed examples can be referred to as adversarial examples and have gained considerable attention recently in the discussion about the robustness of deep learning Szegedy et al. (2014). Machine learning tools, such as deep learning methods, find it difficult to understand why adversarial examples are misclassified because of the black-box nature of the causality between the input data and their underlying model. From another viewpoint, topological data analysis provides a systematic methodology for understanding the true behavior of the data, which will eventually become significant in characterizing the behavior of the model.
We expect that our study will lead to a unified analysis mechanism of the time-series data. This study paves several opportunities for the application of topological tools to produce effective algorithms for analyzing the time-series data. For instance, given a time series, we could use delay-variant embedding to predict its future values or to detect anomalous values or outliers therein.
Appendix A Topological features obtained from data
To extract the topological features from a set of points in the Euclideand space , we build a -scale Vietoris–Rips complex (denoted as ) from a union of -dimensional hyperspheres of radius centered at each point in . Every collection of affinely independent points in forms an -simplex in if the pairwise distance between points is less than or equal to . The complex gives us the topological information from associated with radius . For example, in Fig. 8(d), there are two loops (called one-dimensional holes) and one connected component (called a zero-dimensional hole). However, this information depends on how to choose the radius . If is too small, the complex created by union hyperspheres (Fig. 8(b)) remains almost the same as the discrete points (Fig. 8(a)). If is too large, we obtain a trivially connected and overlapped complex without any hole inside it (Fig. 8(f)).
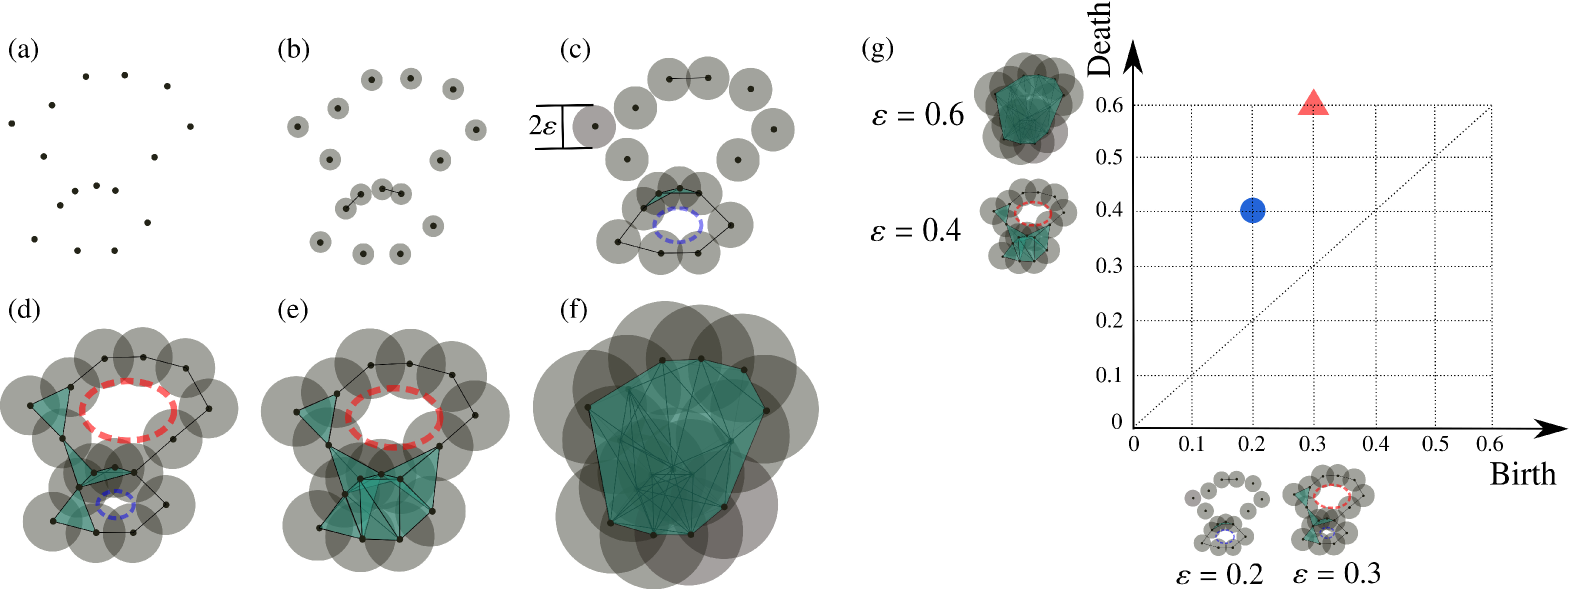
The problem above can be solved by considering not only a single radius, but all choices of radius . This yields a filtration, which is a sequence of simplicial complexes used to monitor the appearance of holes such as clusters and loops over changing . For example, in Fig. 8, we start from (Fig. 8(a)); then we increase gradually to see whether the holes appear or disappear. When a hole appears and disappears at radii and , respectively, the hole is characterized by a pair , where , , and are referred to as the birth scale, death scale, and persistence pair, respectively.
The persistence pairs, which we use as topological features, are displayed in the Cartesian plane as a two-dimensional persistence diagram where the birth and death scales appear as the horizontal and vertical coordinates, respectively. In the two-dimensional persistence diagram, points far from the diagonal generally correspond to robust features, which are persistent over a long time, whereas those near the diagonal are regarded as noise in the data. We provide an exemplary two-dimensional persistence diagram in Fig. 8(g), where we consider the appearance and disappearance of loops in a filtration of the Vietoris–Rips complex constructed from points when takes the discrete values from the set .
Appendix B Proof of the stability of the three-dimensional persistence diagrams
We prove the result in Eq. (3). First, we define the bottleneck distance between two two-dimensional persistence diagrams and as
| (5) |
where is a matching between and such that a point on a diagram is matched to a point on the other or to its projection on the diagonal line . Here the distance is defined as for .
The bottleneck distance between the two-dimensional persistence diagrams satisfies the following property Chazal et al. (2014):
Proposition A1
Let and be finite sets of points embedded in the Euclidean space . Denote their two-dimensional persistent diagrams as and , respectively. Then,
| (6) |
where is the Hausdorff distance given by
Here, is the Euclidean distance between .
For each , we denote and are the embedded points of and , respectively, in an embedding space with dimension and time delay . Consider two two-dimensional persistence diagrams and calculated from and , respectively. Let be the set of matchings defined in Eq. (5) between and . For each collection , we construct a matching between two three-dimensional persistence diagrams and , such that, for each , then , , and , where , , and . Let be the set of all matchings constructed this way. From the definition of bottleneck distance, we have the following inequality:
| (7) |
For , we have
| (8) | ||||
| (9) | ||||
| (10) |
and Eq. (7) becomes
| (11) | ||||
| (12) |
From Eq. (12) and Proposition A1, we have
| (13) |
At each time point , we consider and . From the definition of Euclidean distance, we have
| (14) |
Appendix C Kernel of the three-dimensional persistence diagrams
C.1 Proof of the positive-definite property
We prove that the proposed kernel for the three-dimensional persistence diagrams is positive-definite. We prove for the case when the positive rescaling coefficient . The proof is straightforward for other positive values of .
For each parameter and a three-dimensional persistence diagram , we define the following feature mapping , where is the space of three-dimensional persistence diagrams, and is the Hilbert space of square-integrable -functions defined on the domain :
| (16) |
where is a symmetric point of with respect to diagonal plane on and is a positive value depending on , which we will show later.
We show that the kernel defined in Eq. (II.3) is the inner product of on as
| (17) | ||||
| (18) |
We extend the domain of function from to to obtain a function that is symmetric with respect to the diagonal plane (because and ). Then we have
| (19) |
where is defined as
| (20) |
Here, . Since , and from Eqs. (19) and (20) we have the closed form of the kernel where .
The kernel is positive-definite due to the inner-product nature of the feature mapping. Consider the three-dimensional persistence diagrams of the -dimensional holes that are needed to compute the kernel. The Gram matrix for these diagrams is defined as , whose element is with and .
C.2 Selection of the kernel parameters
In time-series classification experiments, we compute the kernel by taking time-delay values as discrete values with sampling interval 1 and set the rescaling coefficient to . The selection of kernel bandwidth can be chosen by cross-validation; however, as proposed in Gretton et al. (2008), we present here a heuristic way to select . Consider the three-dimensional persistence diagrams that are required to compute the kernel. We denote with . is set as , such that takes values close to many values.
C.3 Using kernels with holes of multiple dimensions
For all -dimensional holes, we obtain the persistence diagrams and compute their kernels as , where is the bandwidth of this kernel and is the positive rescaling coefficient corresponding with -dimensional holes. To use persistence diagrams for different dimensions of holes, we can combine the kernels at various dimensions through linear combinations. In our time-series classification experiments, we only consider the topological features of zero-dimensional holes (connected components) and one-dimensional holes (loops). Thus, the combined Gram matrix of data can be defined as
| (21) |
where , and and are the Gram matrices of persistence diagrams at the zero-dimensional and one-dimensional holes, respectively. In our time-series classification experiments, we choose from 0, 0.0001, 0.0002, 0.0005, 0.001, 0.002, 0.005, 0.01, 0.02, 0.05, 0.1, 0.2, 0.5, 1.0 by cross-validation.
Appendix D Synthetic data
We generate data from Hes1 regulatory model, which is a stochastic model of the Hes1 genetic oscillator exhibiting negative autoregulation with delay Monk (2003); Galla (2009). The model describes the concentrations and interactions of two types of particles: hes1 mRNA molecules, denoted by M, and Hes1 protein molecules, denoted by P. The stochastic dynamics are defined by the following reactions:
| (22) | |||||
| (23) | |||||
| (24) | |||||
| (25) |
The degradations of mRNA and protein are described in reactions (22) and (23), respectively, where the rates of these degradation are and , respectively. mRNA molecules are translated into protein via reaction (24) by the translation-rate parameter . The final reaction, (25) with a double arrow describes the transcription process for producing mRNA which is accompanied by time delay. The rate of hes1 mRNA production depends on the concentration of Hes1 protein molecules through a negative-feedback mechanism, as described by the function . Here, is the number of protein molecules in the system, , , and are constants, and is the size of the system. This transcription process is associated with a time delay drawn from a distribution ; that is, the protein concentration at time only affects the production of mRNA at time .
In the simulations, the protein levels were measured after every (= 64, 32, 16, 8) min for 4,096 min. The measurements start at min for the system to equilibrate. The parameters for the oscillatory regime are , and for the non-oscillatory regime are .
References
- Donato et al. (2016) I. Donato, M. Gori, M. Pettini, G. Petri, S. De Nigris, R. Franzosi, and F. Vaccarino, Phys. Rev. E 93, 052138 (2016).
- Kusano et al. (2016) G. Kusano, K. Fukumizu, and Y. Hiraoka, in Proc. 33th Int. Conf. Machine Learning (ICML), Vol. 48 (2016).
- Ardanza-Trevijano et al. (2014) S. Ardanza-Trevijano, I. Zuriguel, R. Arévalo, and D. Maza, Phys. Rev. E 89, 052212 (2014).
- Nakamura et al. (2015) T. Nakamura, Y. Hiraoka, A. Hirata, E. G. Escolar, and Y. Nishiura, Nanotechnology 26, 304001 (2015).
- Hiraoka et al. (2016) Y. Hiraoka, T. Nakamura, A. Hirata, E. G. Escolar, K. Matsue, and Y. Nishiura, Proc. Natl. Acad. Sci. U.S.A. (2016).
- Ichinomiya et al. (2017) T. Ichinomiya, I. Obayashi, and Y. Hiraoka, Phys. Rev. E 95, 012504 (2017).
- Maletić et al. (2016) S. Maletić, Y. Zhao, and M. Rajković, Chaos 26, 053105 (2016).
- Mittal and Gupta (2017) K. Mittal and S. Gupta, Chaos 27, 051102 (2017).
- Takens (1981) F. Takens, in Dynamical Systems and Turbulence, Lecture Notes in Mathematics, Vol. 898 (Springer-Verlag, Berlin, 1981) pp. 366–381.
- Casdagli et al. (1991) M. Casdagli, S. Eubank, J. D. Farmer, and J. Gibson, Physica D 51, 52 (1991).
- Fraser and Swinney (1986) A. M. Fraser and H. L. Swinney, Phys. Rev. A 33, 1134 (1986).
- Liebert and Schuster (1989) W. Liebert and H. Schuster, Phys. Lett. A 142, 107 (1989).
- Buzug and Pfister (1992a) T. Buzug and G. Pfister, Phys. Rev. A 45, 7073 (1992a).
- Buzug and Pfister (1992b) T. Buzug and G. Pfister, Physica D 58, 127 (1992b).
- Rosenstein et al. (1994) M. T. Rosenstein, J. J. Collins, and C. J. De Luca, Physica D 73, 82 (1994).
- Kantz and Schreiber (2003) H. Kantz and T. Schreiber, Nonlinear Time Series Analysis, 2nd ed. (Cambridge Univ. Press, 2003).
- Bradley and Kantz (2015) E. Bradley and H. Kantz, Chaos 25, 097610 (2015).
- Carlsson (2009) G. Carlsson, Bull. Amer. Math. Soc. 46, 255 (2009).
- Edelsbrunner and Harer (2010) H. Edelsbrunner and J. Harer, Computational Topology. An Introduction. (Amer. Math. Soc., 2010).
- Edelsbrunner et al. (2002) H. Edelsbrunner, D. Letscher, and A. Zomorodian, Discrete Comput. Geom. 28, 511 (2002).
- Zomorodian and Carlsson (2005) A. Zomorodian and G. Carlsson, Discrete Comput. Geom. 33, 249 (2005).
- Chazal et al. (2014) F. Chazal, V. de Silva, and S. Oudot, Geom. Dedicata 173, 193 (2014).
- Reininghaus et al. (2015) J. Reininghaus, S. Huber, U. Bauer, and R. Kwitt, in Proc. 28th IEEE Conf. Computer Vision and Pattern Recognition (CVPR) (2015).
- Carrière et al. (2017) M. Carrière, M. Cuturi, and S. Oudot, in Proc. 34th Int. Conf. Machine Learning (ICML), Vol. 70 (2017).
- Gretton et al. (2008) A. Gretton, K. Fukumizu, C. H. Teo, L. Song, B. Schölkopf, and A. J. Smola, in Adv. Neural Inf. Process. Syst. 20 (NIPS) (2008).
- (26) Q. H. Tran and Y. Hasegawa, “Delay-variant embedding,” https://github.com/OminiaVincit/delay-variant-embed, GitHub Repository.
- Phillips et al. (2017) N. E. Phillips, C. Manning, N. Papalopulu, and M. Rattray, PLOS Comp. Biol. 13, 1 (2017).
- Monk (2003) N. A. Monk, Curr. Biol. 13, 1409 (2003).
- Galla (2009) T. Galla, Phys. Rev. E 80, 021909 (2009).
- Gillespie (1977) D. T. Gillespie, J. Phys. Chem. 81, 2340 (1977).
- Anderson (2007) D. F. Anderson, J. Phys. Chem. 127, 214107 (2007).
- Brett and Galla (2013) T. Brett and T. Galla, Phys. Rev. Lett. 110, 250601 (2013).
- Bishop (2006) C. M. Bishop, Pattern Recognition and Machine Learning (Springer, 2006).
- Chen et al. (2015) Y. Chen, E. Keogh, B. Hu, N. Begum, A. Bagnall, A. Mueen, and G. Batista, “The UCR Time Series Classification Archive,” (2015), www.cs.ucr.edu/~eamonn/time_series_data/.
- Brown et al. (2013) A. E. X. Brown, E. I. Yemini, L. J. Grundy, T. Jucikas, and W. R. Schafer, Proc. Natl. Acad. Sci. U.S.A. 110, 791 (2013).
- Yemini et al. (2013) E. Yemini, T. Jucikas, L. J. Grundy, A. E. Brown, and W. R. Schafer, Nat. Methods 10, 877 (2013).
- Lines and Bagnall (2014) J. Lines and A. Bagnall, Data Min. Knowl. Disc. 29, 565 (2014).
- Grabocka et al. (2014) J. Grabocka, N. Schilling, M. Wistuba, and L. Schmidt-Thieme, in Proc. 20th ACM SIGKDD Int. Conf. Knowledge Discovery and Data Mining (2014).
- Bagnall et al. (2016) A. Bagnall, J. Lines, A. Bostrom, J. Large, and E. Keogh, Data Min. Knowl. Disc. 31, 606 (2016).
- (40) A. Bagnall, J. Lines, W. Vickers, and E. Keogh, “The UEA & UCR Time Series Classification Repository,” www.timeseriesclassification.com.
- Szegedy et al. (2014) C. Szegedy, W. Zaremba, I. Sutskever, J. Bruna, D. Erhan, I. Goodfellow, and R. Fergus, in Proc. 2nd Int. Conf. Learning Representations (ICLR) (2014).