Towards More Efficient Depression Risk Recognition via Gait
Abstract
Depression, a highly prevalent mental illness, affects over 280 million individuals worldwide. Early detection and timely intervention are crucial for promoting remission, preventing relapse, and alleviating the emotional and financial burdens associated with depression. However, patients with depression often go undiagnosed in the primary care setting. Unlike many physiological illnesses, depression lacks objective indicators for recognizing depression risk, and existing methods for depression risk recognition are time-consuming and often encounter a shortage of trained medical professionals. The correlation between gait and depression risk has been empirically established. Gait can serve as a promising objective biomarker, offering the advantage of efficient and convenient data collection. However, current methods for recognizing depression risk based on gait have only been validated on small, private datasets, lacking large-scale publicly available datasets for research purposes. Additionally, these methods are primarily limited to hand-crafted approaches. Gait is a complex form of motion, and hand-crafted gait features often only capture a fraction of the intricate associations between gait and depression risk. Therefore, this study first constructs a large-scale gait database, encompassing over 1,200 individuals, 40,000 gait sequences, and covering six perspectives and three types of attire. Two commonly used psychological scales are provided as depression risk annotations. Subsequently, a deep learning-based depression risk recognition model is proposed, overcoming the limitations of hand-crafted approaches. Through experiments conducted on the constructed large-scale database, the effectiveness of the proposed method is validated, and numerous instructive insights are presented in the paper, highlighting the significant potential of gait-based depression risk recognition.
Depression Risk, Gait Analysis, Deep Learning, Dynamic Features
1 Introduction
Depression is recognized by the World Health Organization (WHO) as one of the primary contributors to the global disease burden[1]. Within the clinical framework, the American Psychiatric Association’s Diagnostic Statistical Manual of Mental Disorders- Fifth Edition (DSM-5) classifies depression as persistent depressive mood or loss of interest and pleasure in activities. It affects approximately 280 million individuals worldwide, comprising approximately 3.8% of the global population[2]. Depression profoundly impacts individuals across multiple domains, including a decline in their overall quality of life[3, 4], compromised social functioning[5, 6], detrimental effects on physical health[7, 8], and an elevated susceptibility to suicide[9, 10].
Recognizing the significance of early detection and timely intervention is crucial for promoting remission, preventing relapse, and mitigating the emotional and financial burdens associated with this condition[11, 12, 13]. However, depression is notably underdiagnosed[11, 14, 15]. A survey involving 33,653 physician-patient interactions reveal that in the primary care setting, less than 5% of adults are screened for depression[16]. And it has been reported that at least 25% of patients go undiagnosed[17], with a significant majority of those seeking assistance from primary care physicians not receiving suitable treatment, particularly in low-income and middle-income countries[18, 19].
The main challenge in screening depression in the primary care is the absence of objective indicators to recognize depression risk[20]. Unlike many physiological illnesses, depression lacks precise biomarkers, clinicians primarily rely on clinical criteria such as psychological questionnaires and patients’ self-reports[21]. This introduces potential issues: Individuals may provide biassed or inaccurate information due to personal inclinations, social expectations or difficulties in recalling past experiences[22, 23, 24]. Approximately 50% of patients have been observed to negate experiencing depressive feelings[20]. Besides, variability in linguistic expression can hinder accurate communication of emotions or experiences[25, 26, 27, 28]. These issues can lead to incorrect depression risk recognition, and missing the optimal window for further treatment[29, 30, 31].
Another primary issue with questionnaire-based approaches for depression risk recognition pertains to inefficiency. Psychological assessments are time-consuming and often encounter a shortage of trained medical professionals, resulting in prolonged referral processes. Consequently, this may hinder timely psychological intervention, potentially exacerbating mental health issues[32, 33]. In addition, psychological questionnaires are typically intended for periodic, rather than frequent, evaluations, often yielding only one or two measurements annually. This limited frequency may not effectively capture long-term condition trends in a timely manner, in light of the high relapse rates associated with depression: 21% at 12 months, 30% at 2 years, and 42% at 5 years[34].
Gait has been shown to be an essential manifestation of depression risk[35, 36, 37]. In particular, gait is modulated by the advanced neural center[38], which is also implicated with the pathophysiology of depression[39]. Many researches have demonstrate the association between depression risk and gait characteristics. Notably, specific abnormalities in gait, such as decreased vertical head movement[40], reduced range of motion in limbs, and a decelerated pace[41], are stable indications of depression. Hence, the gait-based depression risk recognition offers advantages compared to traditional psychological assessment methods:
-
•
Objective biomarker: Gait serves as an objective biomarker for recognizing the risk of depression within the primary care setting, thereby mitigating the influence of subjective biases, societal expectations, or challenges in recollecting past experiences, which often lead to inaccurate information.
-
•
High efficiency: Gathering gait data through cameras proves to be a highly efficient method, surpassing the time-consuming process of administering psychological questionnaires. This approach eliminates the requirement for trained professionals to collect data, thereby reducing both time and manpower costs.
Despite preliminary investigations into the relationship between gait and depression risk, as well as attempts to recognize depression risk based on gait features, existing research suffers from two significant limitations. Firstly, these studies are often constrained by limited and homogeneous gait data, typically lacking the inclusion of gait data captured from different perspectives and with varying attire. Consequently, the generalizability of these research findings remains to be established, as the conclusions drawn may not necessarily apply to more diverse gait data. Furthermore, the accessibility of these datasets is severely restricted, impeding research reproducibility and hindering progress in the field. This limitation not only undermines the ability to validate previous research but also hampers advancements in this domain. Secondly, these studies commonly rely on hand-crafted gait features for analysis. However, human gait is a complex form of motion, and hand-crafted gait features often provide a limited representation, only capturing a fraction of the intricate associations between gait and depression risk.
To address these limitations, we have established the largest gait-based dataset for depression risk recognition to date, encompassing over 1,200 subjects and more than 40,000 gait sequences. This dataset incorporates diverse perspectives and attire variations, providing a comprehensive representation of gait data. The depression risk of the participants was annotated using two commonly used depression risk assessment scales in the primary care.
Leveraging this rich dataset, we propose a novel data-driven approach for depression risk recognition based on deep learning in this paper. The proposed method overcomes the problems associated with hand-crafted features by autonomously learning gait features that are relevant to depression risk. There are two notable characteristics in depression risk related gait features: Firstly, the main features associated with depression risk are dynamic features, which refer to the temporal aspects of gait during the walking process. Secondly, gait features that are associated with depression risk can manifest as either local details or involve the entire body. Based on these two characteristics, this paper proposes a deep learning model with dynamic feature modeling as its core. In the feature extraction process, both local dynamic features and global dynamic features are effectively integrated. This innovative methodology offers a fresh perspective for investigating the association between gait and depression risk.
The contributions of this paper can be summarized as follows:
-
•
We build a large-scale dataset for gait-based depression risk recognition. This dataset serves as a benchmark, propelling advancements in the field of depression risk recognition. Ultimately, it aims to enhance the efficiency of depression screening in the primary care, ensuring that more individuals receive the assistance they need.
-
•
Based on the insights on depression-related gait features, we introduce a deep learning model with dynamic feature modeling at its essence. This model adeptly merges local and global features, yielding a comprehensive integration.
-
•
A plethora of experiments are conducted to delve deeper into the aberrant gait patterns that are associated with the risk of depression. These experiments offer enlightening perspectives that contribute to the field of depression research.
The remainder of this paper is organized as follows: Section 2 presents a brief literature review of the related work. Section 3 introduce the gait-based dataset for depression risk recognition. The proposed recognition model are described in detail in Section 4. The configurations and results of experiments are presented in Section 5. Finally, the conclusion of this paper is summarized in Section 6.
2 Related Work
2.1 Machine Learning based Depression Risk Recognition
Due to the significant harm caused by depression, researchers have conducted numerous studies in the field of depression risk recognition. The application of machine learning methods has propelled advancements in this field. Machine learning-based approaches for recognizing depression risk encompass various modalities of data.
Physiological signals such as electroencephalogram (EEG) and electrocardiogram (ECG) can be utilized for the recognition of depression risk. Depression is associated with abnormal brain activity, which can be reflected through EEG signals. Additionally, due to disruptions in the autonomic nervous system, depressive episodes may be accompanied by symptoms such as nausea, vomiting, chest tightness, and sweating[42], which can be observed in ECG signals. Common machine learning methods, including principal component analysis (PCA), support vector machines (SVM), random forests, and long short-term memory (LSTM), have been employed to analyze the relationship between these physiological signals and depression risk[43, 44, 45].
Brain imaging techniques are also among the means used for recognizing depression risk. This primarily includes magnetic resonance imaging (MRI), functional near-infrared spectroscopy (fNIRS), and positron emission tomography (PET), among others. Depression can potentially lead to structural and functional abnormalities in the brain, such as hippocampal atrophy, neurotransmitter changes, and chronic inflammation. Brain imaging techniques can assess the condition of patients by detecting these symptoms. In order to achieve automated processing and analysis of brain images, image processing methods from the field of machine learning have been introduced in this domain[46, 47, 48, 49].
Furthermore, depression can potentially lead to changes in facial expression patterns and speech patterns of patients. Researchers have proposed the use of facial expression analysis techniques[50] and speech analysis techniques[51] for the recognition of depression risk.
The aforementioned exploration of depression risk recognition through machine learning methods has explored various approaches. However, the data modalities used by these methods require participants to undergo data collection in specific scenarios and with specific devices, demanding a high level of cooperation from the participants. As a result, these methods incur higher time and manpower costs, ultimately making them no more efficient than traditional psychological questionnaires in practice.
2.2 Gait Analysis
Gait analysis can be broadly categorized into two main streams of research methods: model-based gait analysis and appearance-based gait analysis. In the realm of model-based gait analysis research, a pioneering study by Wang et al.[52] proposed a method that combines static and dynamic human body information. Subsequently, Li et al.[53] introduced an end-to-end model-based gait analysis and recognition method. Given an RGB gait sequence, it first extracts pose and shape features by fitting the SMPL model, and then provides these features to a deep learning model for analysis. The model-based approach in gait analysis research aims to model the structure of the human body, resulting in extracted features that possess better invariance. These approaches demonstrate good performance even in the presence of occlusion, noise, scale variations, and rotations.
In contrast, appearance-based gait analysis methods analyze human gait based on the appearance of the human body. Early representative research includes the work of Kusakunnira et al.[54], who proposed a support vector regression-based view transformation model to address the view variation problem. Bashir et al.[55] estimated the view of each gait sequence using Gaussian processes and used correlation analysis to model gait sequences from different view, enabling cross-view gait analysis. With the rise of deep learning, methods based on deep neural networks for appearance analysis have gradually become mainstream in the field of gait analysis. Wu et al.[56] implemented gait recognition by learning the similarity between two input samples using deep convolutional networks. Their research found that deep neural networks can effectively extract gait features. Subsequent gait analysis studies have focused primarily on overcoming the challenges posed by view and attire variations. Yu et al.[57] employed generative adversarial networks as regressors to generate gait images, addressing gait analysis under different views, attire variations, and carrying objects. Chao et al.[58] proposed the GaitSet model, which treats gait data as an unordered set of gait silhouettes and models them accordingly. Song et al.[59] proposed a fully end-to-end gait analysis model, greatly streamlining the process of gait analysis. Fan et al.[60] proposed dividing the human body into patches to extract features separately, addressing the variations caused by different perspectives and attire through a divide-and-conquer approach. In response to the issue of high dimensionality in gait features, Hou et al.[61] presented a method for compressing gait features. To better model global and local information, Lin et al.[62] proposed a global-local feature extractor.
While there has been rapid development in general gait analysis methods in recent years, most current approaches primarily focus on identity recognition tasks. They lack the exploration of fine-grained information contained in human gait, such as emotions, psychological states, and health conditions. Therefore, there is a need for systematic integration of relevant domain knowledge to further research in this area.
2.3 Gait based Depression Risk Recognition
Several researchers have explored the relationship between gait and depression. For instance, Sloman et al.[63] conducted an analysis of photograms capturing a single stride during a natural walk and observed that individuals with depression exhibited slower walks with a lifting motion of the leg. Another study utilized electronic walkways and photogrammetry to demonstrate that depressed patients had shorter strides and slower gait velocity compared to healthy controls[41]. Michalak et al.[40] utilized 3D motion capture and showed that individuals with depression displayed reduced vertical head movements, a more slumped posture, and lower gait velocity compared to controls.
Some researchers have also attempted to recognize depression risk through the recognition of gait features. For example, Wang et al.[64] utilized Support Vector Machines (SVM) to construct a machine learning model that could recognize depression risk by extracting spatio-temporal, time-domain, and frequency-domain features. Lu et al.[65] proposed a model based on human body skeleton, aiming to extract gait features related to depression risk through Fast Fourier Transforms (FFT). Fang et al.[66], on the other hand, employed Random Forests in an attempt to recognize depression risk.
However, the existing studies suffer from two noteworthy limitations: Firstly, these studies are often constrained by a dearth of heterogeneous gait data, which frequently fails to incorporate varying perspectives and attire. Consequently, the generalizability of their findings remains uncertain, as the conclusions drawn may not be readily applicable to a broader range of gait data. Secondly, these studies commonly rely on hand-crafted gait features for analysis. Nevertheless, human gait is an intricate and multifaceted form of motion, and such manually constructed features often offer a limited portrayal, capturing only a fraction of the intricate correlations between gait and the risk of depression.
3 Dataset
To embark upon the exploration of gait-based depression risk recognition method, we establish a novel dataset. In this section, we present the construction of the dataset, the preprocessing of the data, and provide an overview of the statistical information pertaining to the dataset.
3.1 Gait Collection
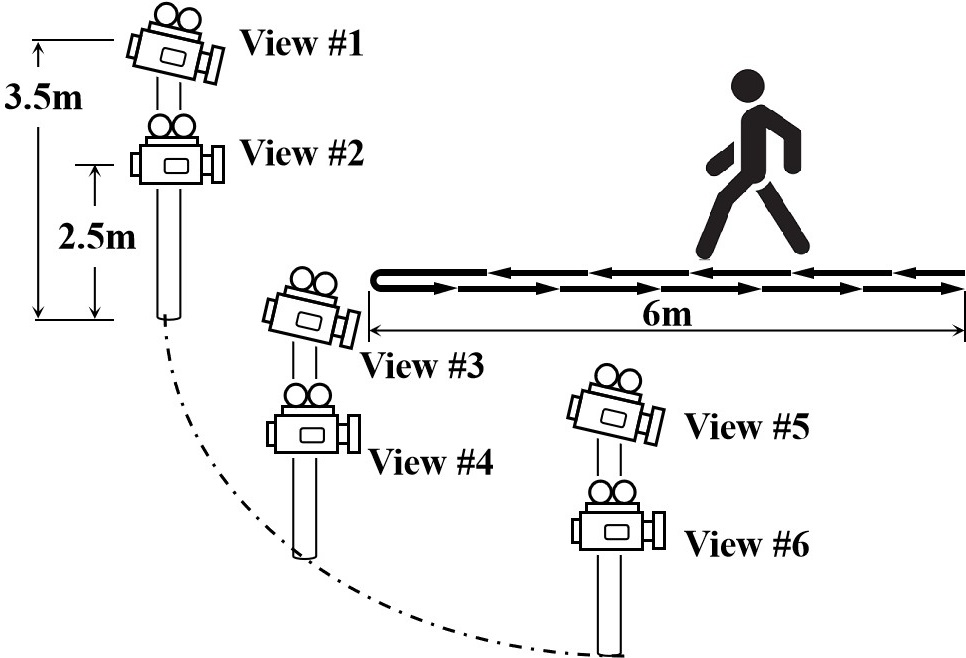
The subjects chosen for the collection of gait data are consenting adult volunteers who have been informed about the nature of our research endeavors. These volunteers are instructed to traverse a predetermined walking route while being recorded by six cameras placed strategically from distinct views, as shown in Fig. 1. The six cameras are divided into three groups, each consisting of one high and one low camera. The two cameras of each group are positioned at heights of 2.5 meters and 3.5 meters above the ground, respectively, in order to capture data from different vertical views. These three groups of cameras are evenly distributed along an arc ranging from the front to the side, enabling the capture of gait videos from various horizontal views. The designated walking route spans a length of six meters, requiring the participants to traverse from one end to the other and subsequently return to the starting point. Each volunteer is required to undergo three data collection sessions, with each session involving a distinct attire. Each volunteer is required to undergo three sessions of data collection, with each session involving different attire, including wearing a coat, not wearing a coat, and carrying a backpack. This is done to obtain gait videos under varied dressing conditions.
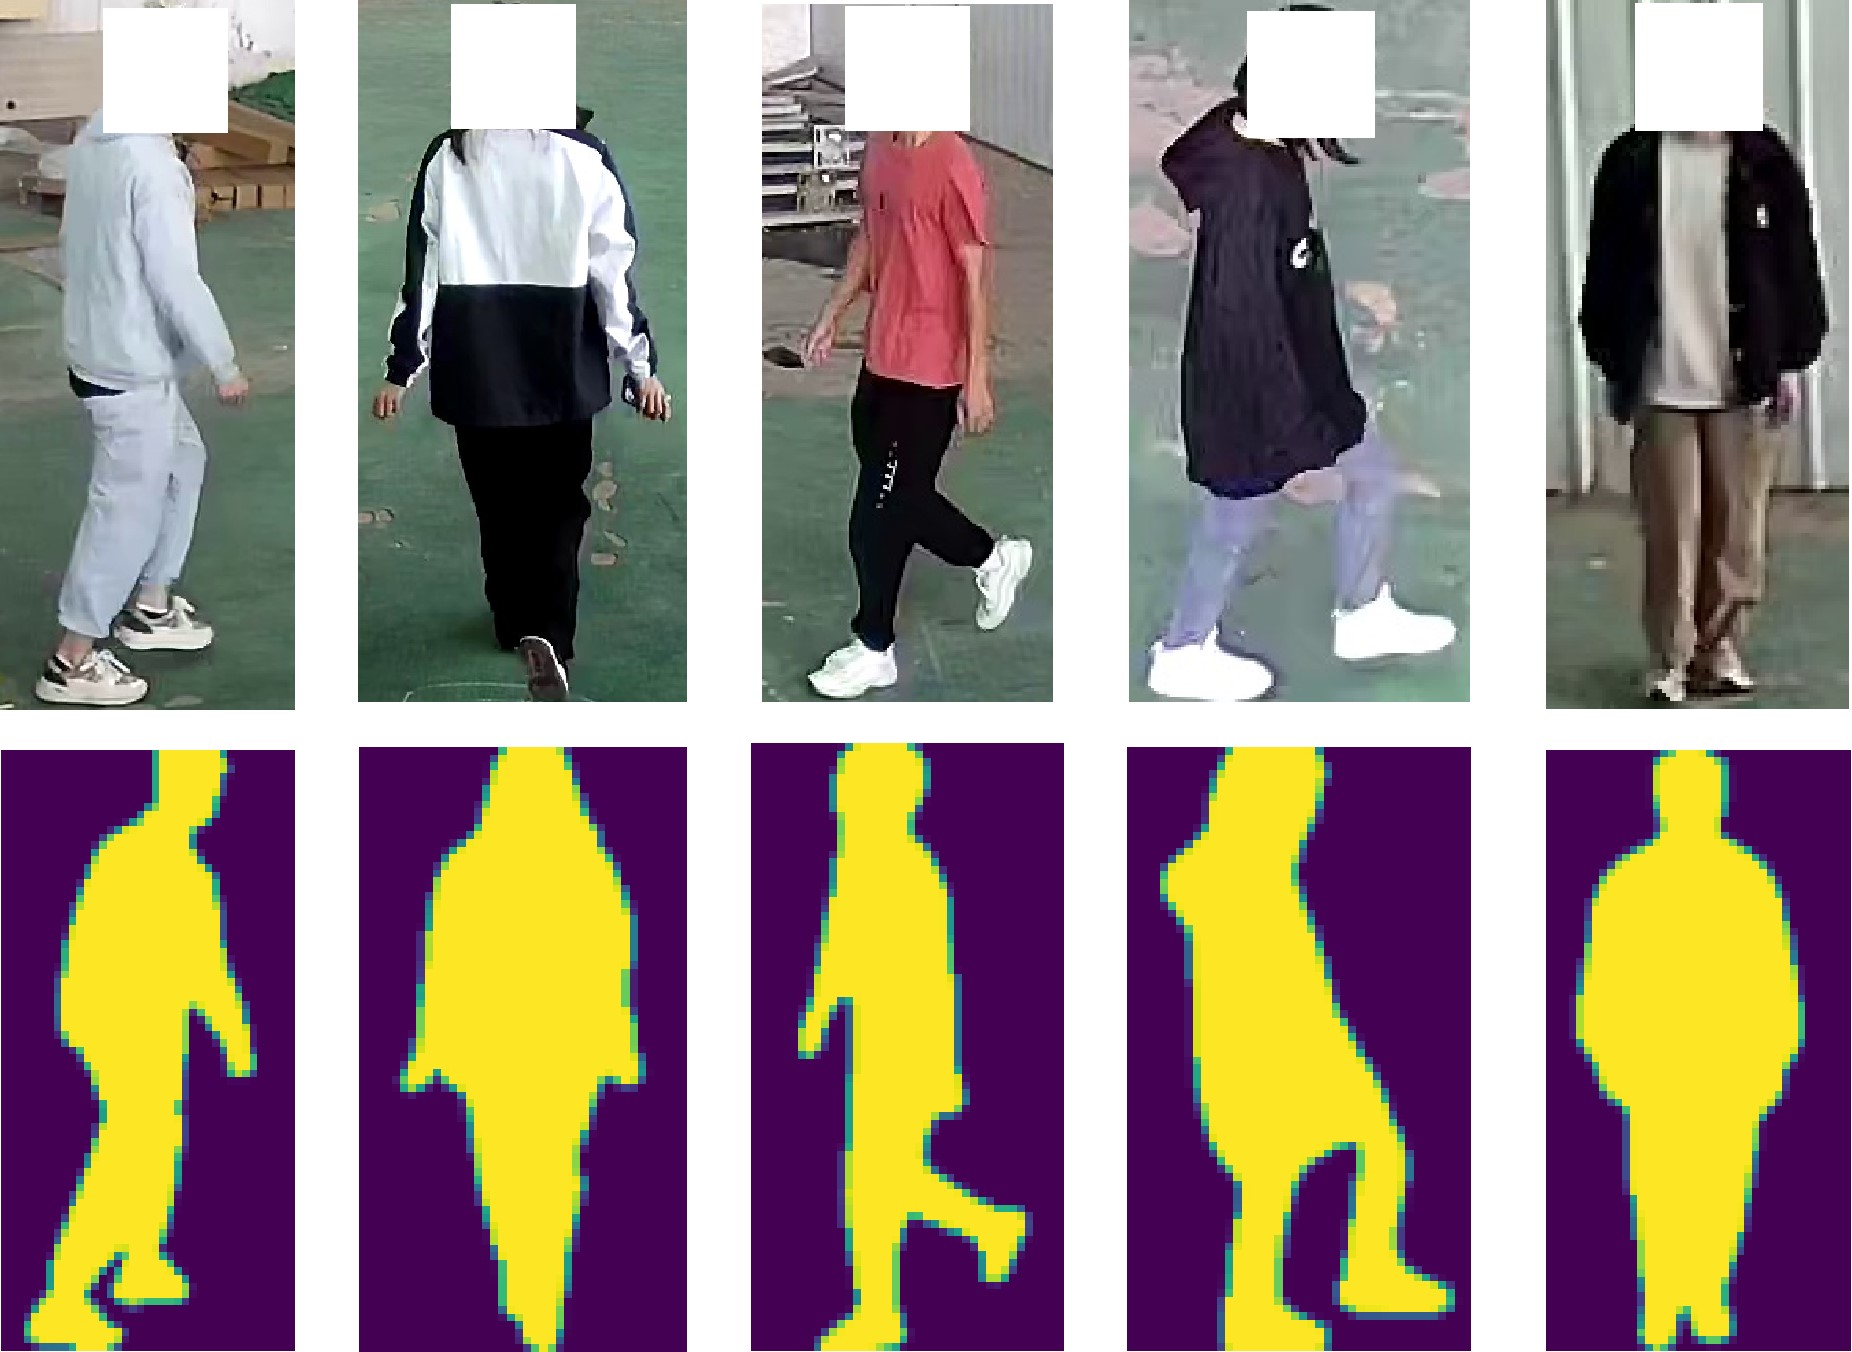
The pre-processing of the video gait data primarily involves two steps: Firstly, tracking the subjects in the videos. Subsequently, in order to preserve the privacy of the individuals being captured, we perform human segmentation on the tracked tracklets, retaining only the silhouettes that encompass the contour information of the human body, as shown in Fig. 2. The private information is eliminated during data pre-processing, and the original data is permanently removed. Through the aforementioned process, the privacy of the subjects involved has been effectively safeguarded.
3.2 Depression Risk Annotation
Two widely used psychological scales are used to assess the depression risk of the participants:
-
•
The Self-Rating Depression Scale (SDS): SDS is one of the most renowned self-report measures for depression. It is recommended by the U.S. Department of Health and Human Services for research in psychopharmacology. It is widely utilized for screening and assessing depression due to its ease of use and ability to reflect the subjective experience of patients. The SDS consists of 20 items and provides a quick assessment of an individual’s risk of depression.
-
•
The 9-question Patient Health Questionnaire (PHQ-9): PHQ-9 is a commonly used scale in outpatient settings for the rapid preliminary screening of depression risk in individuals.
During the depression risk identification experiment, participants are classified into an experimental group, indicating the presence of depression risk, and a control group, indicating the absence of depression risk, based on their scores on these scales. Participants who meet both of the following criteria are assigned to the experimental group: SDS score greater than 58 and PHQ-9 score greater than 8. Participants who meet both of the following criteria are assigned to the control group: SDS score less than 47 and PHQ-9 score less than 2.
3.3 Dataset Statistics
| Depression | Control | |
|---|---|---|
| Gender (M:F) | 306:300 | 431:190 |
| Age | 18-25 | 18-25 |
| SDS (Mean SD) | 63.51 6.87 | 34.42 4.45 |
| PHQ-9 (Mean SD) | 0.55 0.42 | 12.75 4.12 |
| Depression | Control | View | Attire | Sequence | |
|---|---|---|---|---|---|
| Fang[66] | 43 | 52 | 1 | 1 | - |
| Yuan[67] | 54 | 47 | 1 | 1 | - |
| Wang[64] | 126 | 121 | 1 | 1 | - |
| Lu[65] | 86 | 114 | 4 | 1 | - |
| Ours | 606 | 621 | 6 | 3 | 40281 |
The statistical information of the dataset proposed in this paper is presented in Table 1. A comparison with existing datasets is illustrated in Table 2. In the existing dataset, the proposed dataset has the largest number of participants and gait sequences. It also includes the highest number of camera views and attires conditions. Due to privacy concerns, the majority of existing datasets cannot be openly accessed, which significantly impedes the progress in this field. To address this issue, we have implemented effective privacy protection measures during the data preprocessing stage. We will release gait silhouette data along with corresponding annotations of depression risk, but only with the informed consent of the volunteers. This study aims to facilitate the advancement of research in this field while ensuring the protection of participants’ privacy.
4 Depression Risk Recognition
4.1 Overview
Compared to general gait analysis tasks, there are two notable characteristics in depression risk recognition based on gait analysis: Firstly, the main features associated with depression risk are dynamic features, which refer to the temporal aspects of gait during the walking process[63, 41, 40, 64]. Static features of the human body have less correlation with the depression risk, e.g., shape. Secondly, gait features that are associated with depression risk can manifest as either local details or involve the entire body[63, 41, 40]. Based on these two characteristics, this paper proposes a deep learning model with dynamic feature modeling as its core. In the feature extraction process, both local dynamic features and global dynamic features are effectively integrated.
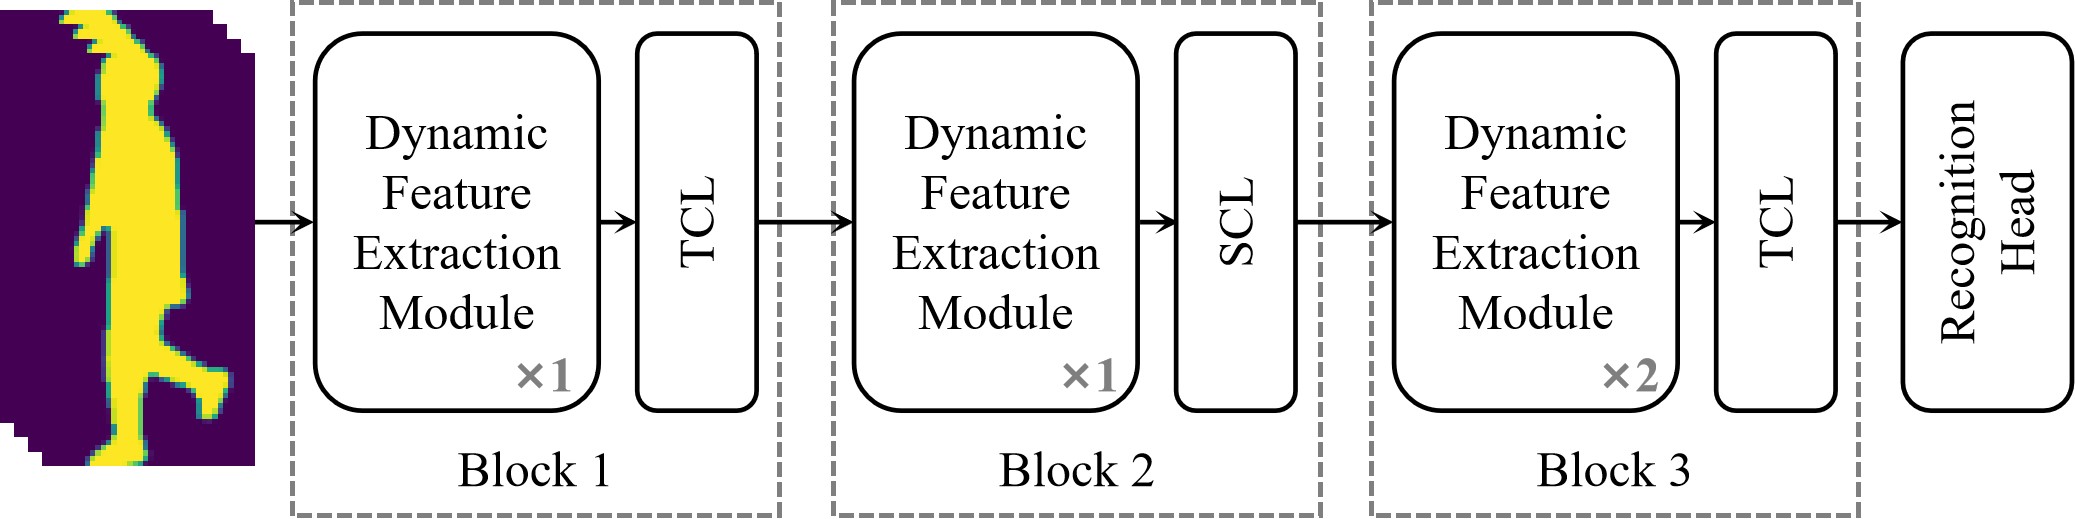
This deep learning model consists of three kinds of modules: the dynamic feature extraction module, the feature compression module, and the recognition head, as shown in Fig 3. The dynamic feature extraction module is designed to extract the dynamic features of gait, and it consists of two branches: local dynamic feature branch and global dynamic feature branch. The feature compression module compresses the dynamic features to obtain a more compact and effective representation. The recognition head maps the final features to the task space of depression risk recognition. The following subsections will provide a detailed description to each of these modules.
4.2 Dynamic Feature Extraction
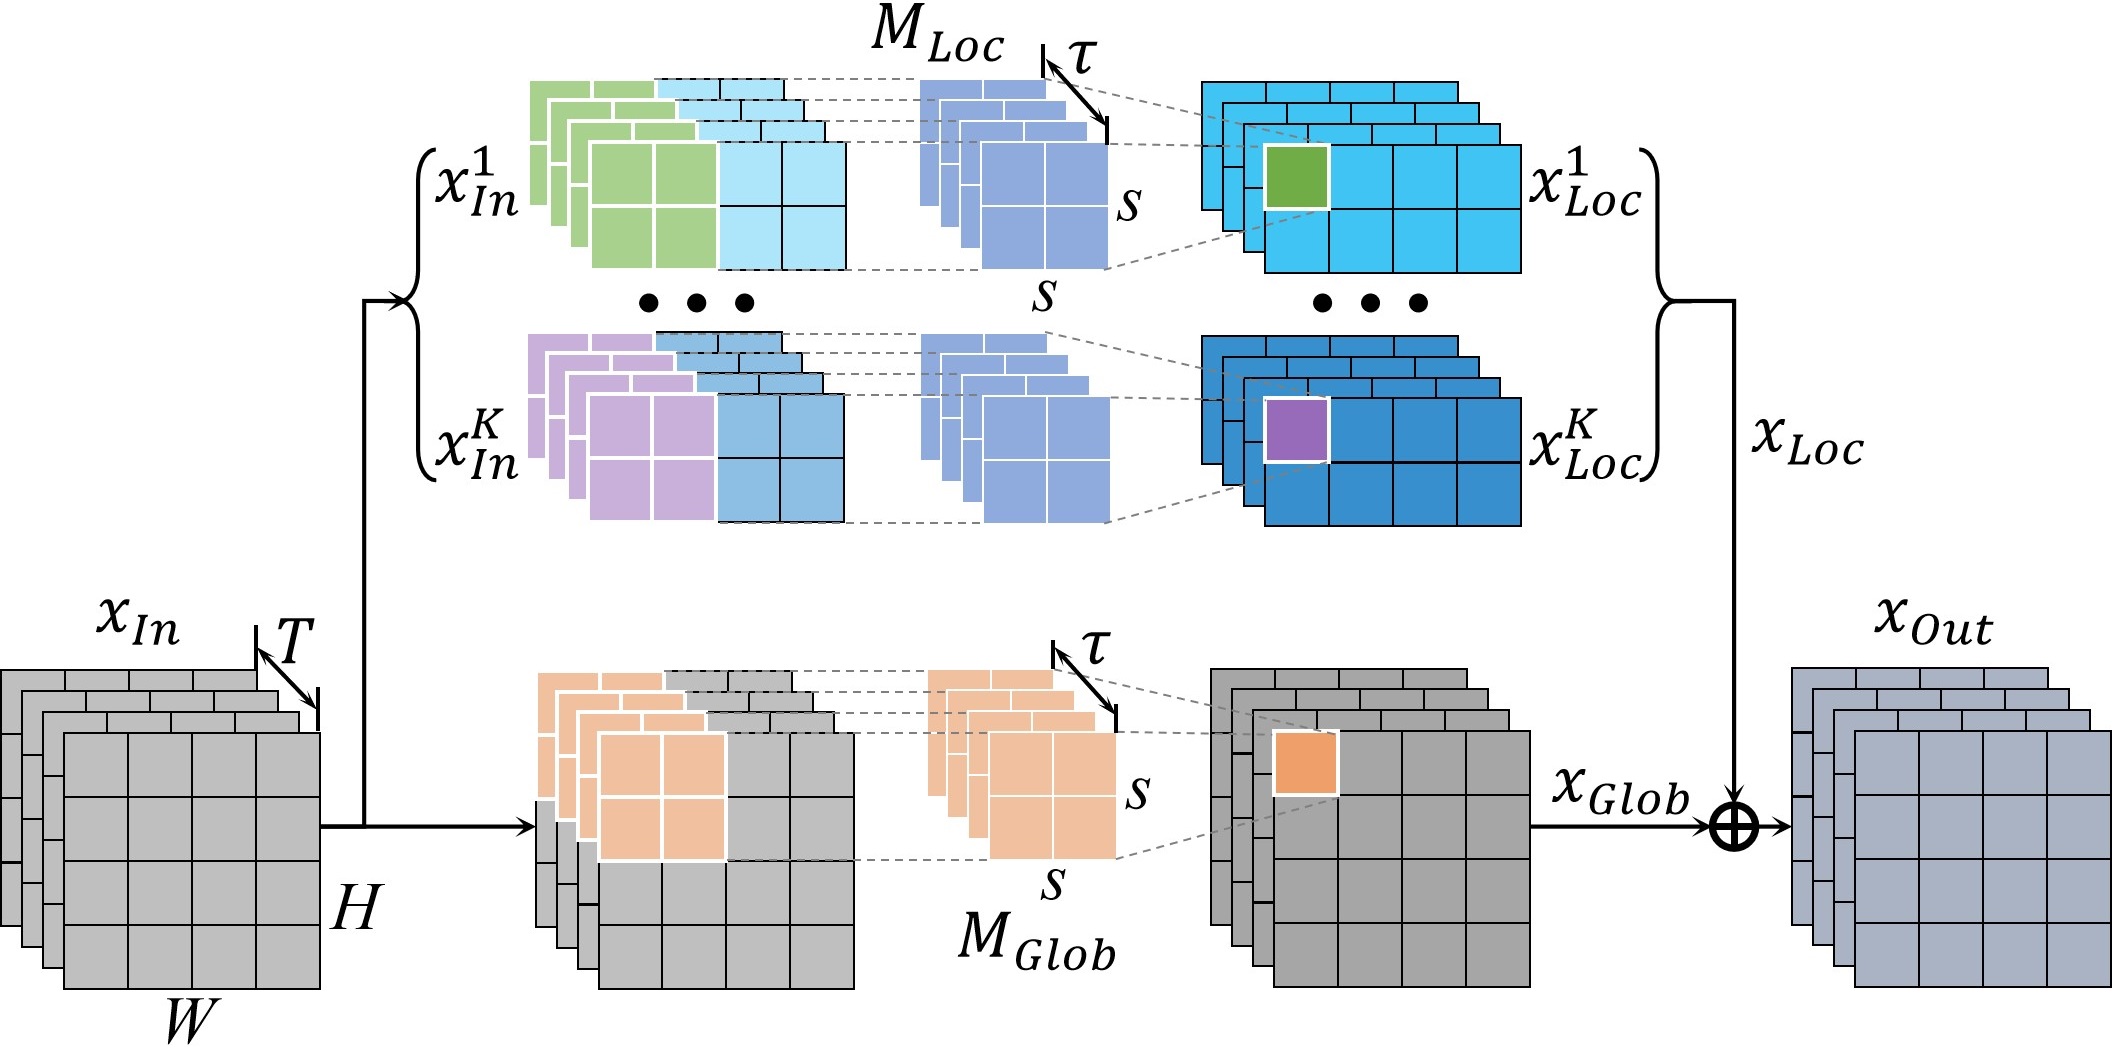
Existing research on the association between depression and gait suggests that the correlation between depression risk and gait primarily manifests in the dynamic characteristics of gait. Therefore, it is crucial to effectively extract and model the dynamic features of gait for the purpose of depression risk recognition based on gait. To achieve this, we propose a novel dynamic feature extraction module. Furthermore, the manifestation of gait features associated with depression risk varies, encompassing both the entire body and specific local movements. Therefore, the dynamic feature extraction module consists of two branches: the local feature branch and the global feature branch, which are dedicated to extracting local and global features, respectively.
When given input , where is the number of channels, is temporal scale of , i.e., the length of the sequence, and are the spatial scale, the local feature branch initially divides it into parts in the vertical direction. is the -th part, . Subsequently, a local 3D convolutional layer is employed to extract dynamic features from each part:
| (1) |
where is the local 3D convolutional layer, is the spatial kernel size of the 3D convolution operation, is the temporal kernel size.
Most existing studies on gait analysis primarily employ 2D convolutions for the process of low-level feature extraction. However, considering the significance of dynamic features in depression risk recognition, we have opted for 3D convolutions, enabling the model to directly capture gait patterns in the temporal dimension. The parameter is used to regulate the temporal range during dynamic feature extraction. When is set to a higher value, the model tends to capture longer-term gait patterns, whereas a smaller value favors the capture of gait patterns within shorter time intervals.
By partitioning the input into K parts, we ensure that the feature extraction process between each part is independent, allowing the model to focus on a part, i.e., a local region of the input, for dynamic feature extraction. This enables the local feature branch to concentrate on the localized features associated with depression risk. After local feature extraction, the local feature maps of different parts are concatenated:
| (2) |
The global feature branch also employs 3D convolutions for dynamic feature extraction, without the need to partition the input into parts.
| (3) |
where is the global 3D convolutional layer, is the spatial kernel size, is the temporal kernel size. is also to regulate the temporal range during dynamic feature extraction.
The output of the dynamic feature extraction module is obtained by merging local features and global features:
| (4) |
By integrating local and global features, the dynamic feature extraction process is accomplished ultimately.
From the aforementioned description, it can be found that the dynamic feature extraction module achieves efficient extraction of dynamic features through the application of 3D convolution. Additionally, the local and global branches model the local and global features separately. These targeted designs tailor the feature extraction model to the characteristics of depression risk recognition task.
4.3 Feature Compression
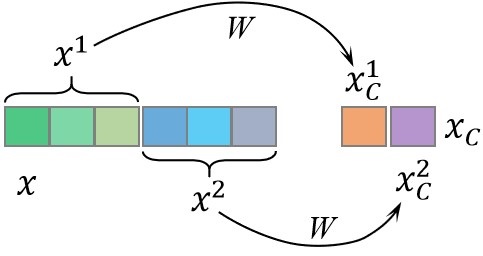
Due to the typically high dimensionality of gait data and the presence of significant information redundancy, it is necessary to perform feature compression during the feature extraction process to mitigate the curse of dimensionality and enhance the effectiveness of feature representation. Information redundancy in gait silhouette data primarily stems from two aspects. Firstly, there is temporal redundancy as gait data is collected at a rate of 30 frames per second, resulting in short time intervals between adjacent frames and a substantial amount of repeated information. Secondly, there is spatial redundancy. Silhouette data only captures the contour information of the human body, which has lower information density compared to RGB data. However, the dimensionality of silhouette data remains the same as RGB data, leading to a significant amount of spatial information redundancy. Building upon the above insights, we propose two types of feature compression layers in this paper: one for temporal compression and the other for spatial compression of features.
Temporal Compression Layer (TCL) is proposed to accomplish feature compression in the temporal dimension, as shown in Fig. 5. For the feature map , dimensions other than the temporal dimension are omitted for the sake of simplicity: . A straightforward method for feature compression is linear compression:
| (5) |
where is the compressed feature, is the temporal dimension after compression, is the compression parameter. However, this approach would result in a significant increase in the number of model parameters, which is not conducive to model training and efficiency. To address this issue, we propose to partition the input along the temporal dimension and perform separate compression for each group:
| (6) |
where is the -th group, , is the compression parameter, is the -th compressed feature. Furthermore, we adopt a weight sharing strategy: :
| (7) |
Finally, the compressed features are concatenated along the temporal dimension to obtain the compressed feature:
| (8) |
where . The rationale behind the aforementioned method of compressing temporal features is derived from insights into gait data and related features associated with depression risk. Specifically, it is observed that gait is continuous over time and there is minimal variation between adjacent frames. Hence, we partition the inputs that are temporally adjacent into the same group for compression. Compared to directly performing linear compression, the proposed method significantly reduces the number of parameters, decreasing it from to .
Spatial Compression Layer (SCL) is employed to accomplish feature compression in the spatial dimensions. Spatial feature compression is a common operation in deep learning models, and max pooling is the most commonly used spatial compression method. Therefore, in the proposed model, max pooling is utilized to implement spatial compression.
4.4 Recognition Head
Upon completion of feature extraction, the extracted feature is fed into the recognition head for the depression risk recognition. The recognition head initially performs classification to determine the presence of depression risk:
| (9) |
where is a fully connected layer, is the output of . During the training process, the model is trained using the cross-entropy loss function:
| (10) |
where is the number of classes and , is the depression risk label, when a sample is at risk of depression , and when a sample is not at risk of depression .
Meanwhile, the depression risk recognition cannot be simply generalized as a binary classification problem. This is due to the uniqueness of individuals’ psychological states, where even for two participants both at risk of depression, their psychological states may vary significantly. Hence, in addition to the aforementioned classification loss, we employ triplet loss to constrain the features extracted by the model:
| (11) |
where represents the distance metric function in the feature space, denotes the anchor, denotes the feature of the same subject as , and denotes the feature of a different subject than , is the distance margin. This loss function requires that for the same individual, the extracted depression risk features by the model should remain relatively stable and consistent, while features of different individuals should exhibit distinctiveness.
The training objective of the model is composed of the aforementioned two loss functions:
| (12) |
4.5 Implementation details
This subsection introduces the implementation details of the proposed depression risk recognition model, as well as the training and testing configurations.
The spatial dimensions of the silhouette data are normalized to . During the training process, a random sequence of 60 consecutive frames is extracted as the input sequence. If the sequence is less than 60 frames, it is padded by repeating the sequence until it reaches 60 frames. During testing, all frames of the test data are inputted into the model for testing. For training, the Adam optimizer is used with an initial learning rate of 10-4 and a weight decay of 5e-4. The batch size is set to 64, and a total of 80,000 steps are performed. The learning rate is decayed to one-tenth of the original value at the 70,000th step.
The channel of the three blocks are set as 32, 64, and 128 respectively. In the dynamic feature extraction module, the local feature branch divides the input into 16 parts. Both the spatial kernel size of the local and global 3D convolutional layers are set to 3, and the temporal kernel size are set to 5. In block 1, the temporal feature compression layer divides the features into 20 groups for compression in the temporal dimension. In block 3, the time feature compression layer divides the features into one group for compression. Euclidean distance is utilized as the distance metric function in Eq.11, with set to 0.2.
5 Experiments
In order to validate the effectiveness of the proposed depression risk recognition model, we conducted quantitative experiments on the collected gait dataset. This section first introduces the experimental protocols, and then quantitatively validates the effectiveness of the proposed model for depression risk recognition. Subsequently, we provide a quantitative analysis on the impact of views on the model’s predictions, as well as the relationship between grading of depression risk and the model’s predictions. Finally, we conducted ablation experiments on the dynamic feature modeling and loss functions.
5.1 Protocols
During the experiment, the collected gait dataset is divided into a training set and a test set. The training set consisted of 831 subjects, while the test set consisted of 396 subjects. The training set and test set do not have any overlapping subjects. The proposed depression risk recognition model is trained on the training set and its recognition performance is quantitatively validated on the test set. Each subject’s gait data is divided into two sequences: walking towards the cameras and walking away from the cameras during training and testing. During the testing process, the probability of the class with depression risk, as outputted by the recognition model, is considered as the probability of having depression risk.
The model’s performance is evaluated using the following performance metrics:
| (13) |
where is the number of true positive samples, is the number of true negative samples, is the number of false positive samples, is the false negative samples. Accuracy () is an intuitive evaluation metric that directly calculates the proportion of correctly recognized samples.
| (14) |
When the cost of incorrectly predicting negative samples as positive ones () is high, precision () becomes a crucial metric.
| (15) |
Conversely, when the cost of predicting positive samples as negative ones () is high, recall rate () becomes an important metric.
| (16) |
score is an evaluation metric that combines both precision and recall rate, providing a comprehensive assessment of a model’s recognition performance.
In addition, the area under the curve (AUC) of the Receiver Operating Characteristics (ROC) curve is also used to quantitatively evaluate the recognition performance of the model. This metric is comprehensive and has the advantage of being unaffected by threshold selection.
5.2 Depression Risk Recognition
The performance of the proposed depression risk recognition model on the collected dataset is shown in Table 3. As can be observed, the metrics of the proposed model are distributed around 80%, indicating that the model is able to distinguish between most positive and negative samples, resulting in a passable outcome. These experimental results further validate the feasibility of depression risk recognition based on gait and also confirm the effectiveness of the proposed deep learning model.
| Acc | Prec | Recall | F1 | AUC |
| 79.41% | 76.71% | 82.94% | 79.70% | 0.8019 |
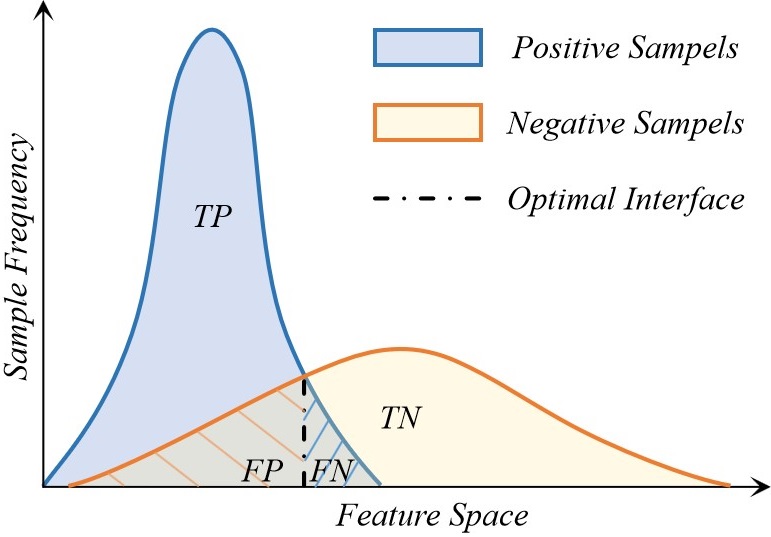
From the experimental results, it can be observed that the recall of positive samples in the depression risk recognition is significantly higher than the precision. This phenomenon indicates that the features extracted by the model are more adept at clustering positive samples with depression risk together, while negative samples without depression risk are relatively scattered. This is intuitive as positive samples with depression-related characteristics exhibit common feature representations, resulting in strong similarities between them. On the other hand, negative samples without depression risk may not have the same set of features. The similarities among negative samples are much less pronounced compared to positive samples, resulting in a more dispersed distribution in the feature space.
As depicted in Fig. 6, positive samples tend to cluster together in the feature space, while negative samples are more dispersed. Consequently, the optimal classification interface that the model can learn in this scenario would result in a larger number of false positive samples () compared to false negative samples (), leading to a higher recall rate than precision rate.
5.3 Influence of Views
In general gait analysis tasks, the view of camera plays a crucial role as an influencing factor. This is because there can be significant differences in the observed gait patterns across different views. Certain gait features may be easily observable from specific views, while they may be challenging to capture from other views. Therefore, it is necessary to further explore the impact of views on depression risk recognition.
| View | Acc | Prec | Recall | F1 | AUC |
|---|---|---|---|---|---|
| # 1 | 77.65% | 74.57% | 82.07% | 78.14% | 0.7989 |
| # 2 | 78.18% | 76.69% | 82.70% | 79.58% | 0.8008 |
| # 3 | 77.70% | 75.84% | 80.60% | 78.15% | 0.7810 |
| # 4 | 78.86% | 76.31% | 82.69% | 79.37% | 0.7920 |
| # 5 | 77.82% | 75.19% | 80.21% | 77.62% | 0.7937 |
| # 6 | 79.07% | 76.38% | 81.72% | 78.96% | 0.8013 |
| All | 79.41% | 76.71% | 82.94% | 79.70% | 0.8019 |
To accomplish this, we divide the training and testing datasets into six subsets based on views of camera. Each subset exclusively contains gait data captured from a specific view. We then proceed to train and test the proposed depression risk recognition model on these six subsets independently. The experimental results are presented in Table 4, with the angle numbering consistent with Fig. 1.
From these results, we can observe that the performance of the recognition models based on each separate view of camera is inferior to the performance achieved with all views combined. This indicates that the features related to depression risk captured by each individual view are not as comprehensive as those captured by the complete set of views. Different angles provide complementary information of gait features related to depression risk. However, it is important to note that the difference in performance between the individual views of camera and the overall views is not significant. This suggests that the effective complementary information between different views is limited for the task of depression risk identification. Most of the depression-related features can be observed in all views. Static features in the spatial dimension, such as arm swing angles, are more influenced by view of camera, while dynamic features in the temporal dimension can be captured in multi-views, such as arm swing frequency. This further verifies that the gait features related to depression risk are primarily manifested in dynamic features in the temporal dimension rather than static features in the spatial dimension.
Additionally, we can also observe that the performance of the models captured from higher views (# 1, # 3, # 5) is inferior compared to the corresponding lower views (# 2, # 4, # 6). This indicates that lower views of camera are more favorable for capturing depression-related features. This is because higher views of camera contribute to a more severe self-occlusion phenomenon in the human body, particularly impeding the observation of leg movements.
5.4 Relationship between Grading of Depression Risk and Model Predictions
The grading of depression is an integral aspect of depression research. This subsection explores the relationship between the predictions made by the proposed model and the grading of depression risk. To achieve this, the participants’ depression risk is classified based on the scores obtained from the SDS and PHQ-9 scales. For the SDS, a score of 70 or above indicates a severe risk of depression, while a score below 70 but above 58 indicates a moderate risk of depression. As for the PHQ-9, a score of 15 or above indicates a severe risk of depression, while a score below 15 but above 8 indicates a moderate risk of depression.
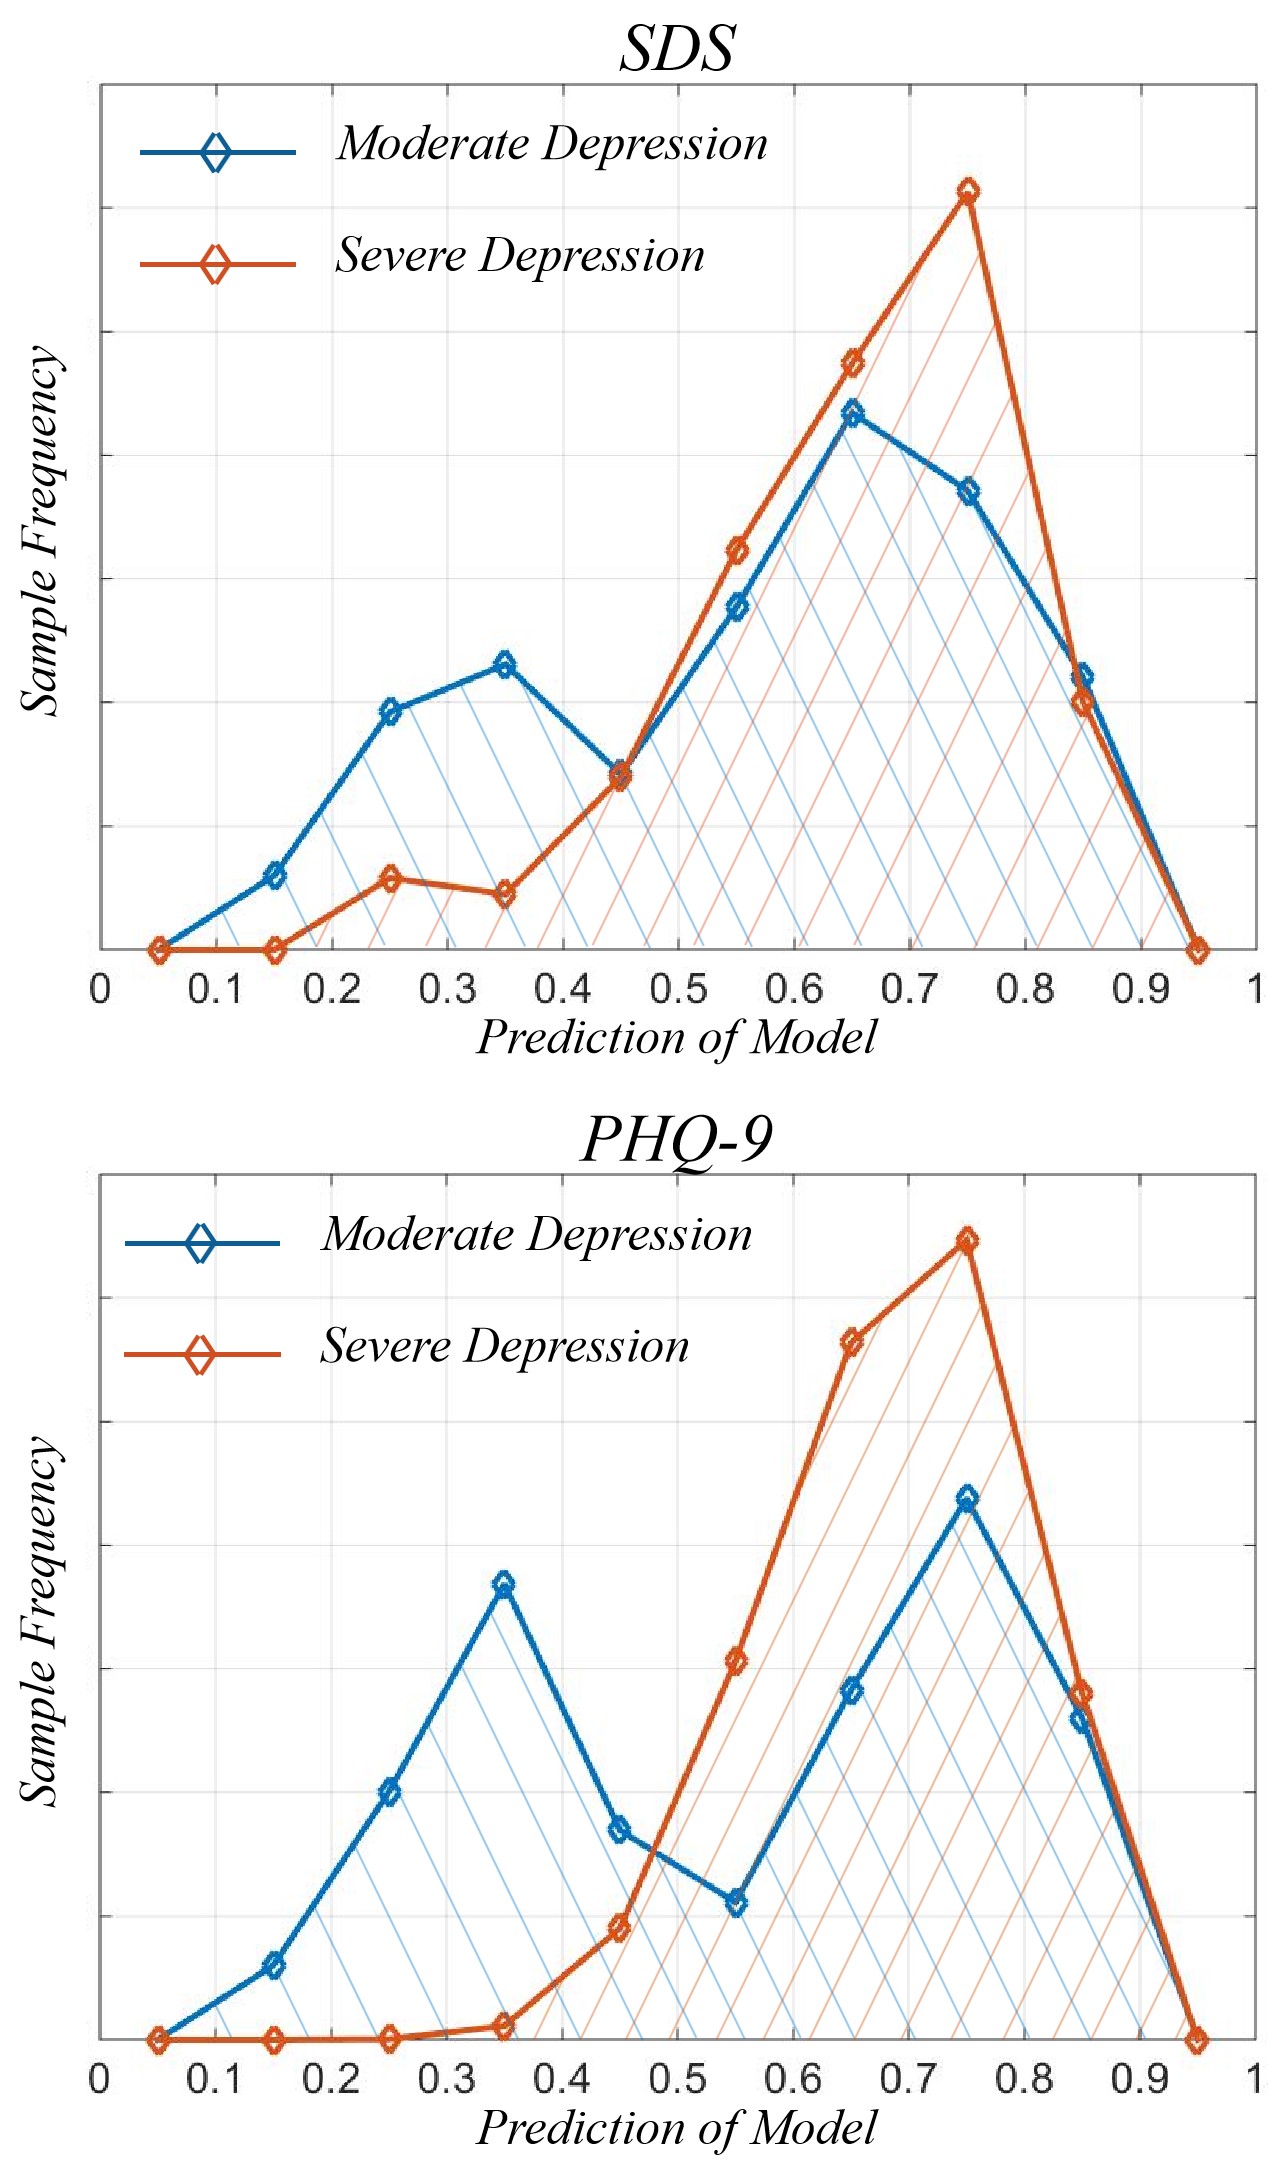
The predictions made by the proposed model for samples with moderate and severe depression risks were separately analyzed. The depression probabilities predicted by the model are categorized into 10 intervals, as shown in Fig. 7. From the figures, it can be observed that samples with a severe depression risk exhibit a more concentrated distribution around 0.7 in the model predictions. In contrast, samples with a moderate depression risk show a bimodal distribution. One part of the distribution closely resembles that of samples with severe depression risk, while the other part is centered around lower probabilities. Since the proposed deep learning model was not explicitly trained to consider the grading of depression during its training process, this phenomenon suggests that only a portion of the features related to severe and moderate depression risks are shared in the proposed deep learning model. As a result, samples with moderate risk that lack these shared features exhibit differences in the predictions compared to samples with these features, leading to the observed bimodal distribution in the model’s predictions for samples with moderate depression risk.
5.5 Ablation Study
5.5.1 Dynamic Feature Modeling
The crux of the proposed model for depression risk recognition lies in effectively modeling the dynamic features in the temporal dimension. In order to achieve this, we employed the 3D convolutional operation that enables us to capture temporal patterns as the fundamental building block of our deep learning architecture. Throughout the construction process of our model, the selection of the temporal kernel size (t) for the 3D convolution operation emerged as a crucial hyperparameter. It is necessary to investigate the influence of different temporal kernel sizes on the performance of the proposed depression risk recognition model. In light of this, we conducted experiments employing three distinct temporal kernel sizes: 3, 5, and 7.
| Acc | Prec | Recall | F1 | AUC | |
|---|---|---|---|---|---|
| =3 | 79.17% | 76.72% | 82.22% | 78.37% | 0.8018 |
| =5 | 79.41% | 76.71% | 82.94% | 79.70% | 0.8019 |
| =7 | 79.51% | 76.69% | 83.33% | 78.84% | 0.8037 |
The experimental results are shown in Table 5. Upon analysis of the experimental outcomes, a conspicuous pattern emerges: an escalating temporal kernel size propels an ascendant trajectory in the overall efficacy of the model. This salient observation is corroborated by the holistic evaluation metrics of Accuracy, F1 score, and AUC. Furthermore, probing into the precision and recall rates divulges an inconsequential variance in precision, indicating that the performance enhancement engendered by the temporal kernel size alteration principally stems from the augmentation of recall rates. This indicates that increasing the temporal kernel size predominantly enhances the representation of positive samples associated with depression risk, effectively reducing the number of false negative (FN) samples. This can be attributed to the fact that, under the constraint of unchanged model depth, increasing the temporal kernel size expands the receptive field of neurons in the temporal dimension. Consequently, the model can more effectively capture the depression-related dynamic features, resulting in better discrimination of positive samples with depression risk and an overall improvement in recall rate.
5.5.2 Triplet Loss
During the process of model training, triplet loss, in Eq. 11, is employed to constrain the dynamic features extracted by the model, aiming to shape the distribution of samples in the feature space to be more conducive to depression risk identification. In order to validate the effect of triplet loss, we conducted training without the constraint of triplet loss as a comparison.
| Acc | Prec | Recall | F1 | AUC | |
|---|---|---|---|---|---|
| w/o | 50.02% | 48.72% | 51.18% | 49.36% | 0.5001 |
| with | 79.41% | 76.71% | 82.94% | 79.70% | 0.8019 |
The experimental results are shown in Table 6. The experiments indicate that the absence of triplet loss leads to significant performance degradation in the model. Relying solely on the classification loss function for training, the model struggles to converge on the training set and almost loses its ability to recognize depression risk on the test set. This phenomenon suggests that depression risk recognition is not a simple binary classification problem, and the straightforward use of a classification loss function is not viable.
The purpose of incorporating triplet loss is to minimize the inter-sequence distance within the feature space for samples originating from the same subject. This approach is justified by the expectation that different sequences from the same subject should exhibit consistent levels of depression risk. In contrast, the absence of triplet loss impedes model convergence, indicating substantial disparities in the manifestation of depression risk across distinct sequences from the same subject. Consequently, the model struggles to train effectively in the absence of explicit guidance. These discrepancies primarily arise from the distinctive nature of gait data, characterized by notable variations in feature expression due to dissimilar views and attire. Addressing this critical challenge becomes imperative when harnessing gait for depression risk recognition.
6 Conclusion
To provide an efficient and implementable solution for recognizing depression risks in the primary care setting, this study establishes the largest gait-based depression risk identification database to date. Additionally, a depression risk recognition model focused on dynamic feature modeling is designed based on deep learning methodology. Through experiments conducted on the constructed large-scale dataset, the correlation between depression risk and gait is validated, further demonstrating the feasibility of utilizing gait for depression risk recognition. This study analyzes the gait features related to depression risk and verifies that these features primarily manifest as dynamic characteristics in the temporal dimension. Furthermore, an analysis is conducted to examine the impact of different perspectives and the severity grading of depression risk on the features related to depression risk.
This paper represents an attempt to explore depression risk recognition through gait analysis, providing a foundational dataset for future researchers and validating the feasibility of this task. Preliminary investigations into gait features associated with depression risk are conducted, and some basic conclusions are drawn. These findings can assist subsequent researchers in understanding the characteristics of this field and conducting further studies. Every advancement in this field ultimately contributes to aiding individuals who are undergoing distress.
References
References
- [1] W. H. Organization, “Mental health,” https://www.who.int/health-topics/mental-health#tab=tab_1, Mar. 2023.
- [2] I. of Health Metrics and Evaluation, “Global health data exchange (ghdx),” https://vizhub.healthdata.org/gbd-results/, Mar. 2023.
- [3] S. H. Kennedy, B. S. Eisfeld, and R. G. Cooke, “Quality of life: an important dimension in assessing the treatment of depression?” Journal of psychiatry & neuroscience: JPN, vol. 26, no. Suppl, p. S23, 2001.
- [4] B. N. Gaynes, B. J. Burns, D. L. Tweed, and P. Erickson, “Depression and health-related quality of life,” The Journal of nervous and mental disease, vol. 190, no. 12, pp. 799–806, 2002.
- [5] R. Hirschfeld, S. A. Montgomery, M. B. Keller, S. Kasper, A. F. Schatzberg, M. Hans-Jurgen, D. Healy, D. Baldwin, M. Humble, and M. Versiani, “Social functioning in depression: a review,” Journal of Clinical Psychiatry, vol. 61, no. 4, pp. 268–275, 2000.
- [6] L. Hansson, “Quality of life in depression and anxiety,” International Review of Psychiatry, vol. 14, no. 3, pp. 185–189, 2002.
- [7] K. J. Bourassa, M. Memel, C. Woolverton, and D. A. Sbarra, “Social participation predicts cognitive functioning in aging adults over time: comparisons with physical health, depression, and physical activity,” Aging & mental health, vol. 21, no. 2, pp. 133–146, 2017.
- [8] B. Roshanaei-Moghaddam, W. J. Katon, and J. Russo, “The longitudinal effects of depression on physical activity,” General hospital psychiatry, vol. 31, no. 4, pp. 306–315, 2009.
- [9] K. Hawton, C. C. i Comabella, C. Haw, and K. Saunders, “Risk factors for suicide in individuals with depression: a systematic review,” Journal of affective disorders, vol. 147, no. 1-3, pp. 17–28, 2013.
- [10] C. Center, M. Davis, T. Detre, D. E. Ford, W. Hansbrough, H. Hendin, J. Laszlo, D. A. Litts, J. Mann, P. A. Mansky et al., “Confronting depression and suicide in physicians: a consensus statement,” Jama, vol. 289, no. 23, pp. 3161–3166, 2003.
- [11] J. L. Coulehan, H. C. Schulberg, M. R. Block, M. J. Madonia, and E. Rodriguez, “Treating depressed primary care patients improves their physical, mental, and social functioning,” Archives of Internal Medicine, vol. 157, no. 10, pp. 1113–1120, 1997.
- [12] J. C. Coyne, S. Fechner-Bates, and T. L. Schwenk, “Prevalence, nature, and comorbidity of depressive disorders in primary care,” General hospital psychiatry, vol. 16, no. 4, pp. 267–276, 1994.
- [13] A. Halfin, “Depression: the benefits of early and appropriate treatment,” American Journal of Managed Care, vol. 13, no. 4, p. S92, 2007.
- [14] S. Weich, L. Morgan, M. King, and I. Nazareth, “Attitudes to depression and its treatment in primary care,” Psychological medicine, vol. 37, no. 9, pp. 1239–1248, 2007.
- [15] D. Souery, P. Oswald, I. Massat, U. Bailer, J. Bollen, K. Demyttenaere, S. Kasper, Y. Lecrubier, S. Montgomery, A. Serretti et al., “Clinical factors associated with treatment resistance in major depressive disorder: results from a european multicenter study.” Journal of Clinical Psychiatry, vol. 68, no. 7, pp. 1062–1070, 2007.
- [16] A. Akincigil and E. B. Matthews, “National rates and patterns of depression screening in primary care: results from 2012 and 2013,” Psychiatric services, vol. 68, no. 7, pp. 660–666, 2017.
- [17] C. Barbui and M. Tansella, “Identification and management of depression in primary care settings. a meta-review of evidence,” Epidemiology and Psychiatric Sciences, vol. 15, no. 4, pp. 276–283, 2006.
- [18] A. S. Young, R. Klap, C. D. Sherbourne, and K. B. Wells, “The quality of care for depressive and anxiety disorders in the united states,” Archives of general psychiatry, vol. 58, no. 1, pp. 55–61, 2001.
- [19] R. C. Kessler, O. Demler, R. G. Frank, M. Olfson, H. A. Pincus, E. E. Walters, P. Wang, K. B. Wells, and A. M. Zaslavsky, “Prevalence and treatment of mental disorders, 1990 to 2003,” New England Journal of Medicine, vol. 352, no. 24, pp. 2515–2523, 2005.
- [20] R. H. Belmaker and G. Agam, “Major depressive disorder,” New England Journal of Medicine, vol. 358, no. 1, pp. 55–68, 2008.
- [21] J. F. Greden, “The burden of recurrent depression: causes, consequences, and future prospects,” Journal of Clinical Psychiatry, vol. 62, pp. 5–9, 2001.
- [22] D. C. Mohr, S. L. Hart, I. Howard, L. Julian, L. Vella, C. Catledge, and M. D. Feldman, “Barriers to psychotherapy among depressed and nondepressed primary care patients,” Annals of Behavioral Medicine, vol. 32, no. 3, pp. 254–258, 2006.
- [23] R. L. Kravitz, D. A. Paterniti, R. M. Epstein, A. B. Rochlen, R. A. Bell, C. Cipri, E. F. y Garcia, M. D. Feldman, and P. Duberstein, “Relational barriers to depression help-seeking in primary care,” Patient education and counseling, vol. 82, no. 2, pp. 207–213, 2011.
- [24] P. Cassano and M. Fava, “Depression and public health: an overview,” Journal of psychosomatic research, vol. 53, no. 4, pp. 849–857, 2002.
- [25] R. A. Bell, P. Franks, P. R. Duberstein, R. M. Epstein, M. D. Feldman, E. F. y Garcia, and R. L. Kravitz, “Suffering in silence: reasons for not disclosing depression in primary care,” The Annals of Family Medicine, vol. 9, no. 5, pp. 439–446, 2011.
- [26] M.-J. Johnstone, “Stigma, social justice and the rights of the mentally ill: Challenging the status quo,” Australian and New Zealand Journal of Mental Health Nursing, vol. 10, no. 4, pp. 200–209, 2001.
- [27] W. Moyle, “Unstructured interviews: challenges when participants have a major depressive illness,” Journal of advanced nursing, vol. 39, no. 3, pp. 266–273, 2002.
- [28] K. Delbaere, J. C. Close, H. Brodaty, P. Sachdev, and S. R. Lord, “Determinants of disparities between perceived and physiological risk of falling among elderly people: cohort study,” Bmj, vol. 341, 2010.
- [29] K. Rost, J. L. Smith, and M. Dickinson, “The effect of improving primary care depression management on employee absenteeism and productivity a randomized trial,” Medical care, vol. 42, no. 12, p. 1202, 2004.
- [30] J. P. Docherty, “Barriers to the diagnosis of depression in primary care,” Journal of clinical psychiatry, vol. 58, no. 1, pp. 5–10, 1997.
- [31] C. Dowrick and A. Frances, “Medicalising unhappiness: new classification of depression risks more patients being put on drug treatment from which they will not benefit,” bmj, vol. 347, 2013.
- [32] N. Cheng and S. Mohiuddin, “Addressing the nationwide shortage of child and adolescent psychiatrists: determining factors that influence the decision for psychiatry residents to pursue child and adolescent psychiatry training,” Academic psychiatry, pp. 1–7, 2021.
- [33] T. Butryn, L. Bryant, C. Marchionni, and F. Sholevar, “The shortage of psychiatrists and other mental health providers: causes, current state, and potential solutions,” International Journal of Academic Medicine, vol. 3, no. 1, pp. 5–9, 2017.
- [34] T. Kanai, H. Takeuchi, T. A. Furukawa, R. Yoshimura, T. Imaizumi, T. Kitamura, and K. Takahashi, “Time to recurrence after recovery from major depressive episodes and its predictors,” Psychological Medicine, vol. 33, no. 5, pp. 839–845, 2003.
- [35] C. Sobin and H. A. Sackeim, “Psychomotor symptoms of depression,” American Journal of Psychiatry, vol. 154, no. 1, pp. 4–17, 1997.
- [36] D. Schrijvers, W. Hulstijn, and B. G. Sabbe, “Psychomotor symptoms in depression: a diagnostic, pathophysiological and therapeutic tool,” Journal of affective disorders, vol. 109, no. 1-2, pp. 1–20, 2008.
- [37] E. I. Fried and R. M. Nesse, “The impact of individual depressive symptoms on impairment of psychosocial functioning,” PloS one, vol. 9, no. 2, p. e90311, 2014.
- [38] K. Takakusaki, “Functional neuroanatomy for posture and gait control,” Journal of movement disorders, vol. 10, no. 1, p. 1, 2017.
- [39] S. Walther, J. Bernard, V. Mittal, and S. Shankman, “The utility of an rdoc motor domain to understand psychomotor symptoms in depression,” Psychological medicine, vol. 49, no. 2, pp. 212–216, 2019.
- [40] J. Michalak, N. F. Troje, J. Fischer, P. Vollmar, T. Heidenreich, and D. Schulte, “Embodiment of sadness and depression—gait patterns associated with dysphoric mood,” Psychosomatic medicine, vol. 71, no. 5, pp. 580–587, 2009.
- [41] M. R. Lemke, T. Wendorff, B. Mieth, K. Buhl, and M. Linnemann, “Spatiotemporal gait patterns during over ground locomotion in major depression compared with healthy controls,” Journal of psychiatric research, vol. 34, no. 4-5, pp. 277–283, 2000.
- [42] G. Nilsonne and F. E. Harrell Jr, “Eeg-based model and antidepressant response,” Nature Biotechnology, vol. 39, no. 1, pp. 27–27, 2021.
- [43] D. M. Schnyer, P. C. Clasen, C. Gonzalez, and C. G. Beevers, “Evaluating the diagnostic utility of applying a machine learning algorithm to diffusion tensor mri measures in individuals with major depressive disorder,” Psychiatry Research: Neuroimaging, vol. 264, pp. 1–9, 2017.
- [44] R. Ramasubbu, M. R. Brown, F. Cortese, I. Gaxiola, B. Goodyear, A. J. Greenshaw, S. M. Dursun, and R. Greiner, “Accuracy of automated classification of major depressive disorder as a function of symptom severity,” NeuroImage: Clinical, vol. 12, pp. 320–331, 2016.
- [45] B. Vai, L. Parenti, I. Bollettini, C. Cara, C. Verga, E. Melloni, E. Mazza, S. Poletti, C. Colombo, and F. Benedetti, “Predicting differential diagnosis between bipolar and unipolar depression with multiple kernel learning on multimodal structural neuroimaging,” European Neuropsychopharmacology, vol. 34, pp. 28–38, 2020.
- [46] M. Shim, M. J. Jin, C.-H. Im, and S.-H. Lee, “Machine-learning-based classification between post-traumatic stress disorder and major depressive disorder using p300 features,” NeuroImage: Clinical, vol. 24, p. 102001, 2019.
- [47] H. Jiang, T. Popov, P. Jylänki, K. Bi, Z. Yao, Q. Lu, O. Jensen, and M. Van Gerven, “Predictability of depression severity based on posterior alpha oscillations,” Clinical Neurophysiology, vol. 127, no. 4, pp. 2108–2114, 2016.
- [48] J. R. Sato, J. Moll, S. Green, J. F. Deakin, C. E. Thomaz, and R. Zahn, “Machine learning algorithm accurately detects fmri signature of vulnerability to major depression,” Psychiatry Research: Neuroimaging, vol. 233, no. 2, pp. 289–291, 2015.
- [49] Y. Wei, Q. Chen, A. Curtin, L. Tu, X. Tang, Y. Tang, L. Xu, Z. Qian, J. Zhou, C. Zhu et al., “Functional near-infrared spectroscopy (fnirs) as a tool to assist the diagnosis of major psychiatric disorders in a chinese population,” European archives of psychiatry and clinical neuroscience, vol. 271, pp. 745–757, 2021.
- [50] X. Zhou, K. Jin, Y. Shang, and G. Guo, “Visually interpretable representation learning for depression recognition from facial images,” IEEE transactions on affective computing, vol. 11, no. 3, pp. 542–552, 2018.
- [51] X. Ma, H. Yang, Q. Chen, D. Huang, and Y. Wang, “Depaudionet: An efficient deep model for audio based depression classification,” in Proceedings of the 6th international workshop on audio/visual emotion challenge, 2016, pp. 35–42.
- [52] L. Wang, H. Ning, T. Tan, and W. Hu, “Fusion of static and dynamic body biometrics for gait recognition,” IEEE Transactions on circuits and systems for video technology, vol. 14, no. 2, pp. 149–158, 2004.
- [53] X. Li, Y. Makihara, C. Xu, Y. Yagi, S. Yu, and M. Ren, “End-to-end model-based gait recognition,” in Proceedings of the Asian conference on computer vision, 2020.
- [54] W. Kusakunniran, Q. Wu, J. Zhang, and H. Li, “Support vector regression for multi-view gait recognition based on local motion feature selection,” in 2010 IEEE Computer society conference on computer vision and pattern recognition. IEEE, 2010, pp. 974–981.
- [55] K. Bashir, T. Xiang, and S. Gong, “Cross view gait recognition using correlation strength.” in Bmvc, 2010, pp. 1–11.
- [56] Z. Wu, Y. Huang, L. Wang, X. Wang, and T. Tan, “A comprehensive study on cross-view gait based human identification with deep cnns,” IEEE transactions on pattern analysis and machine intelligence, vol. 39, no. 2, pp. 209–226, 2016.
- [57] S. Yu, H. Chen, E. B. Garcia Reyes, and N. Poh, “Gaitgan: Invariant gait feature extraction using generative adversarial networks,” in Proceedings of the IEEE conference on computer vision and pattern recognition workshops, 2017, pp. 30–37.
- [58] H. Chao, Y. He, J. Zhang, and J. Feng, “Gaitset: Regarding gait as a set for cross-view gait recognition,” in Proceedings of the AAAI conference on artificial intelligence, vol. 33, no. 01, 2019, pp. 8126–8133.
- [59] C. Song, Y. Huang, Y. Huang, N. Jia, and L. Wang, “Gaitnet: An end-to-end network for gait based human identification,” Pattern recognition, vol. 96, p. 106988, 2019.
- [60] C. Fan, Y. Peng, C. Cao, X. Liu, S. Hou, J. Chi, Y. Huang, Q. Li, and Z. He, “Gaitpart: Temporal part-based model for gait recognition,” in Proceedings of the IEEE/CVF conference on computer vision and pattern recognition, 2020, pp. 14 225–14 233.
- [61] S. Hou, C. Cao, X. Liu, and Y. Huang, “Gait lateral network: Learning discriminative and compact representations for gait recognition,” in European conference on computer vision. Springer, 2020, pp. 382–398.
- [62] B. Lin, S. Zhang, and X. Yu, “Gait recognition via effective global-local feature representation and local temporal aggregation,” in Proceedings of the IEEE/CVF International Conference on Computer Vision, 2021, pp. 14 648–14 656.
- [63] L. Sloman, M. Berridge, S. Homatidis, D. Hunter, and T. Duck, “Gait patterns of depressed patients and normal subjects.” The American journal of psychiatry, vol. 139, no. 1, pp. 94–97, 1982.
- [64] T. Wang, C. Li, C. Wu, C. Zhao, J. Sun, H. Peng, X. Hu, and B. Hu, “A gait assessment framework for depression detection using kinect sensors,” IEEE Sensors Journal, vol. 21, no. 3, pp. 3260–3270, 2020.
- [65] H. Lu, W. Shao, E. Ngai, X. Hu, and B. Hu, “A new skeletal representation based on gait for depression detection,” in 2020 IEEE International Conference on E-health Networking, Application & Services (HEALTHCOM). IEEE, 2021, pp. 1–6.
- [66] J. Fang, T. Wang, C. Li, X. Hu, E. Ngai, B.-C. Seet, J. Cheng, Y. Guo, and X. Jiang, “Depression prevalence in postgraduate students and its association with gait abnormality,” IEEE Access, vol. 7, pp. 174 425–174 437, 2019.
- [67] Y. Yuan, B. Li, N. Wang, Q. Ye, Y. Liu, and T. Zhu, “Depression identification from gait spectrum features based on hilbert-huang transform,” in Human Centered Computing: 4th International Conference, HCC 2018, Mérida, Mexico, December, 5–7, 2018, Revised Selected Papers 4. Springer, 2019, pp. 503–515.