11email: riquelme@iram.es 22institutetext: Centro de Astrobiología (CSIC/INTA), Ctra. de Torrejón a Ajalvir km 4, E-28850, Torrejón de Ardoz, Madrid, Spain 33institutetext: Joint ALMA Observatory, Av. El Golf 40, Piso 18, Las Condes, Santiago de Chile, Chile 44institutetext: European Southern Observarory, Alonso de Córdova 3107, Vitacura, Casilla 19001, Santiago, Chile 55institutetext: Departamento de Astronomía, Universidad de Chile, Casilla 36-D, Santiago, Chile
Tracing gas accretion in the Galactic center using isotopic ratios††thanks: Based on observations carried out with the IRAM 30m telescope. IRAM is supported by INSU/CNRS (France), MPG (Germany) and IGN (Spain).
Abstract
Aims. We study the 12C/13C isotopic ratio in the disk of the central molecular zone and in the halo to trace gas accretion toward the Galactic center region in the Milky Way.
Methods. Using the IRAM 30m telescope, we observe the rotational transition of HCO+, HCN, HNC and their 13C isotopic substitutions in order to measure the 12C/13C isotopic ratio. We observe 9 positions selected throughout the Galactic center region, including clouds at high latitude; locations where the X1 and X2 orbits associated with the barred potential are expected to intersect; and typical Galactic center molecular clouds.
Results. We find a systematically higher 12C/13C isotopic ratio (40) toward the halo and the X1 orbits than for the Galactic center molecular clouds (20-25). Our results point out to molecular gas which has undergone a different degree of nuclear processing than that observed in the gas towards the inner Galactic center region.
Conclusions. The high isotopic ratios are consistent with the accretion of the gas from the halo and from the outskirts of the Galactic disk.
Key Words.:
Galaxy: center - ISM: clouds - ISM: molecules1 Introduction
Many galaxies including our Milky Way contain huge amounts of gas in their central few 100 pc (Mauersberger & Henkel 1993; Morris & Serabyn 1996). This gas can be the fuel reservoir to feed star formation events and in many cases the central object activity (Usero et al. 2004; García-Burillo et al. 2005). Both processes can occur in bursts. For example, the central region of our Galaxy, which harbors the nearest massive black hole ( M⊙; Ghez et al. 2005), may have been much more active in the past than it is now (Morris et al. 1999). It is obvious that such a high activity, even if intermittent, can only be maintained if there is a supply of gas from other regions of the Galaxy, e.g. a disk or halo, or from intergalactic space.
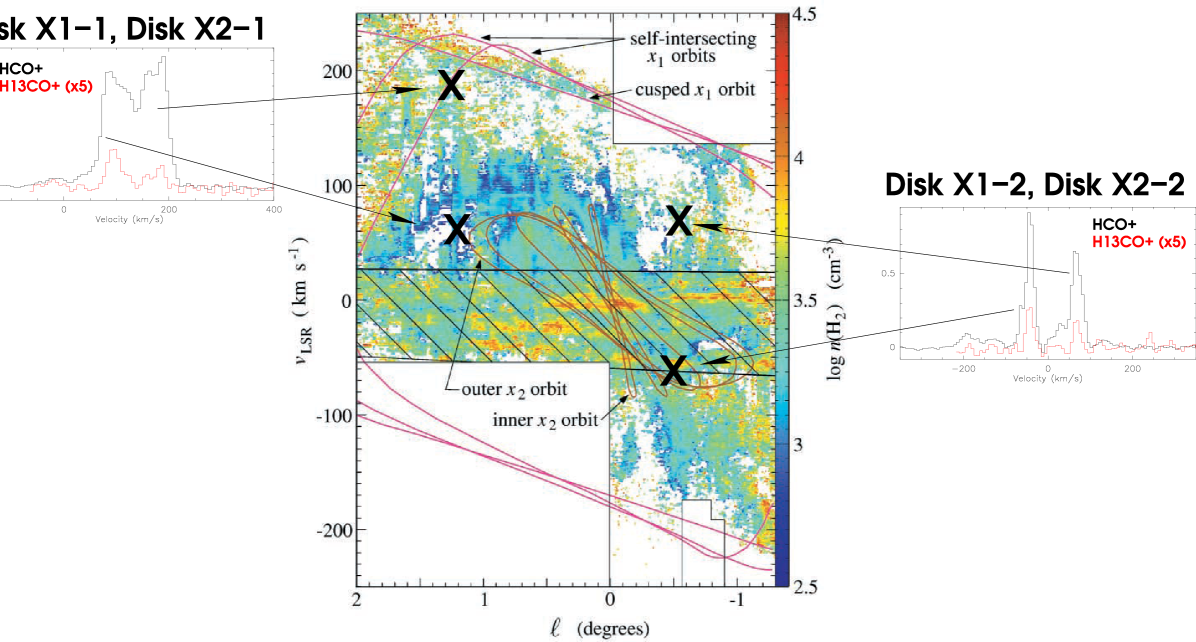
Modeling of the kinematics of the inner regions of galaxies been successful in explaining inward motion, matching the observations: Binney et al. (1991) showed that the large-scale gas kinematics in the Galactic center (GC) can be accounted for by a barred galactic potential. In the dynamical model with a barred potential there are two major families of stable prograde periodic orbits inside the bar: the X1 orbits parallel to the bar, and the X2 orbits orthogonal to it (Contopoulos & Papayannopoulos 1980). In the outer parts of the bar, gas tends to follow the X1 orbits. Further inwards, these orbits develop cusps and loops, where matter on self-intersecting orbits gets shocked and falls toward the center, plugging to orbits of the X2 family (Maciejewski & Sparke 2000). Another mechanism for gas accretion toward the central region of galaxies is the disk-halo interaction. A clear example of these interactions has been recently shown by Fukui et al. (2006), who found huge loop structures (known as “giant molecular loops”; GMLs) that connect gas at the Galactic plane with that at higher latitudes.
However, so far there is no clear observational evidence that gas at the outer disk (in X1 orbits) and/or at high latitudes (in the GMLs) flows toward the central regions. Gas at the GMLs could also be ejected to higher latitudes by winds, originated in past massive star-formation events (the GC harbors giant molecular clouds with ongoing massive star formation, e.g. in Sgr B and the 1.3 complex).
Observations of gas kinematics tell us what is happening now, but do not allow to look into the past. However, studies of the isotope trace the flow since different regions in a galaxy may have their very characteristic isotopic fingerprints. This approach has the potential to reconstruct the migration history to the central part of the galaxy.
Carbon, nitrogen and oxygen (CNO) isotopic ratios diagnostic tools for probing models of Galactic
chemical evolution (see e.g. Audouze 1985). In particular,
the 12C/13C isotopic ratio reflects the history of
the gas proccesing by stars, because this ratio shows the
relative degree of primary to secondary processing in stars. While
12C is predicted to be formed in first generation, metal-poor
massive stars, on rapid timescales, 13C is thought to be produced
primarily via CNO processing of 12C seeds from earlier stellar
generations, in a slower timescale in low and intermediate-mass stars
or novae (Meyer 1994; Wilson & Matteucci 1992; Prantzos et al. 1996). The 12C/13C
isotopic ratio is one of the best-established in the GC. It presents a
clear gradient with galactocentric distance (e.g., Wilson 1999),
decreasing from 8090 in the solar neighborhood to 20-25 in the
inner Galaxy (toward Sgr A and Sgr B, see e.g., Wannier 1980). However, this ratio is, so far, unknown in the galactic halo and in the X1 orbits.
In this paper we present observations of the rotational transition of HCO+, H13CO+, HCN, H13CN, HNC and HN13C to derive the 12C/13C isotopic ratio toward the gas in the halo, the disk and at the kinematic components associated with the X1 and X2 orbits in the nucleus of our Galaxy. We found very different 12C/13C isotopic ratios in the X1 orbits and in the halo than those in the disk and in the X2 orbits. Our findings are consistent with the scenario of less processed gas in the halo and in the X1 orbits, supporting the idea of gas flowing toward the nucleus of the Milky Way.
2 Observations
Observations were carried out with the IRAM-30m telescope at
Pico Veleta (Spain) in June and December 2009. We used the E090 band of the new EMIR receiver, which provide a bandwidth of GHz (from 83.7 to 91.1 GHz)
simultaneously in both polarizations. For the backend, we used the WILMA
autocorrelator, providing a resolution of 2 MHz or 6.8
km/s. Observations were performed in position switching mode where the reference off-positions were checked to be free of emission (Table 1 list the emission-free positions). The
pointing was checked every 2 hours against the source 1757-240
providing an accuracy better than . Data were calibrated using
the standard dual load system. In this work, we use the antenna
temperature scale . Main beam temperatures, , can
be obtained using , where the forward efficiency is and the main
beam efficiency is at GHz. All positions
were observed for no less than 30 min providing an rms noise antenna
temperature of about 6 mK in the weakest lines (e.g. H13CO+).
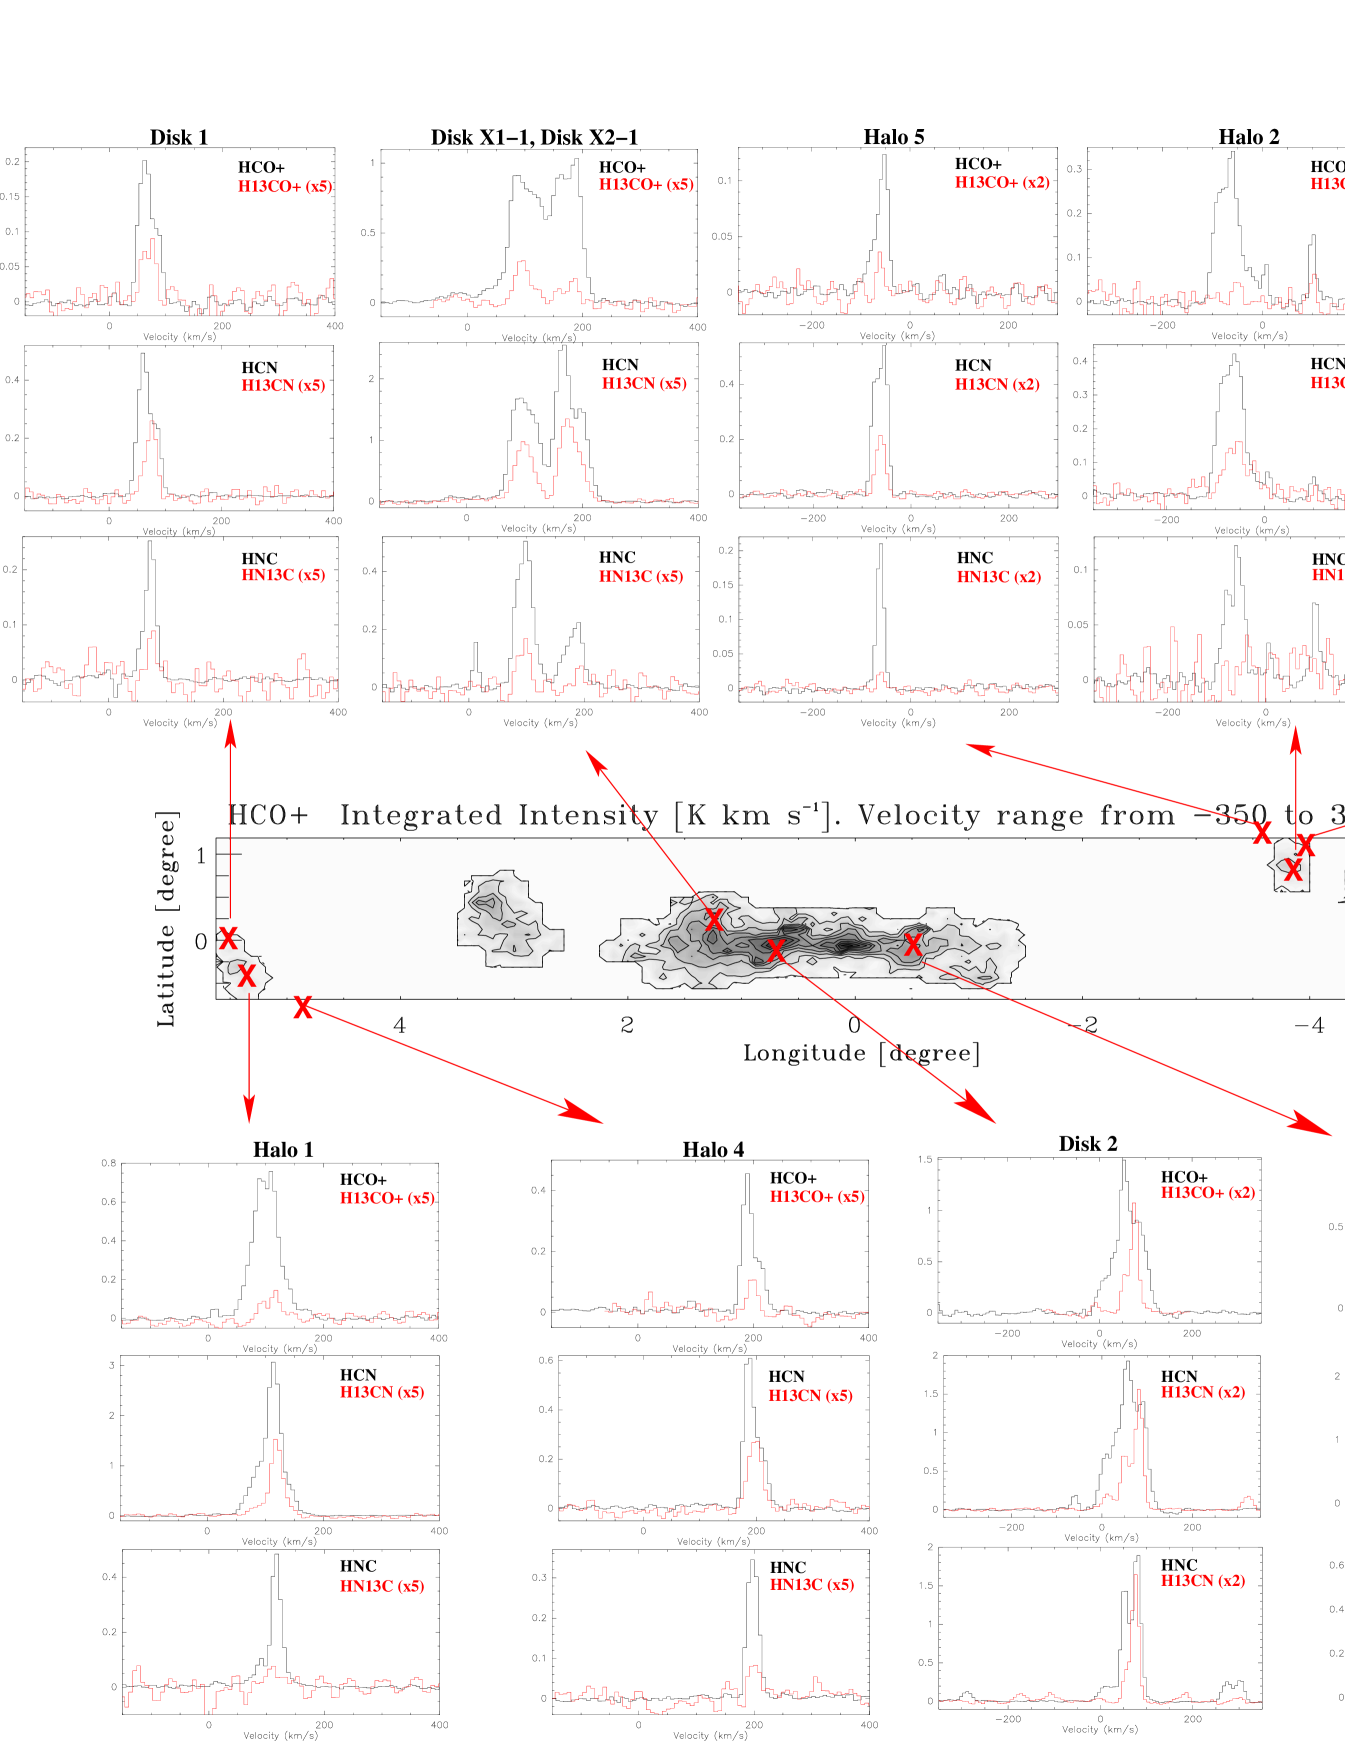
We observed the nine positions shown in Table 2 displayed in the
large scale map of the HCO+ emission shown in Fig. 1. Five of the observed
positions are located in the GMLs (Halo in Table 2, Table 3 and
Fig. 1): Three of them are located at the foot points and two
at the top of the loops. Two positions are in the disk toward the locations
of the expected interactions between the X1 and X2 orbits
(Disk X1 and Disk X2 in Table 2, Table 3 and Fig. 1). A
pair of positions toward the Galactic plane (Disk in Table 2, Table 3 and Fig. 1) have been used as
reference measurements. The positions at the foot points of the GMLs
were selected from the intensity peaks of the SiO maps of Riquelme et al. (2010) and previous results from higher angular resolution mapping
with the Mopra-22m telescope (Riquelme et al., in prep.). The Fukui et al. (2006) maps of the GMLs were used to select the
position at the top of the loop. The positions in the 1∘.3 and
in Sgr C complexes correspond to the locations where interactions
between the X1 and X2 orbits are expected (see,
Binney et al. 1991; Stark et al. 2004). CO and
SiO(2-1) maps of these regions (Tanaka et al. 2007, Amo-Baladrón et al., in prep.) were used for final selection of the positions. The control points in the disk are located in Sgr B2 and in the l=5∘.7 complex selected from Martín et al. (2008) and Fukui et al. (2006), respectively.
| Galactic coordinates | Equatorial coordinates | ||
|---|---|---|---|
| [∘] | [∘] | ||
| 5.75 | 1.0 | 17:54:56.6 | 23:29:13 |
| 4.5 | 18:00:57.3 | 25:43:12 | |
| 356.375 | 1.5 | 17:30:48.0 | 31:11:48 |
| 359.75 | 17:46:00.1 | 29:16:47 | |
| 1.0 | 17:51:52.9 | 28:35:41 | |
| 0.65 | 0.2 | 17:46:23.0 | 28:16:37 |
| Associated | Galactic coordinates | Equatorial coordinates | this work | ||
|---|---|---|---|---|---|
| object | [∘] | [∘] | |||
| M | Halo 1 | ||||
| M | Halo 2 | ||||
| M | Halo 3 | ||||
| Top Loop | Halo 4 | ||||
| Top Loop | Halo 5 | ||||
| 1.3 complex | Disk X1-1, Disk X2-1 | ||||
| Sgr C | Disk X1-2, Disk X2-2 | ||||
| Galactic plane at | Disk 1 | ||||
| Sgr B2 | Disk 2 | ||||
3 Results
Fig. 1 shows the spectra taken in all the observed positions in the J=10 transition of the main isotope of HCO+, HCN and HNC and their 13C isotopologues. All the species have been clearly detected in all our sources, except HN13C, with tentative detections in “Halo 1” and “Halo 3”, and a non detection in “Halo 2”.
Table 3 shows the integrated line intensity ratios between the different isotopologues derived for all positions and velocity components. To distinguish between the different kinematical components, the line intensity ratios were obtained by integrating the line profiles in the velocity ranges given in Table 3. We derived line intensity ratios from three different species, obtained the largest values from HCO+.
| Source | Velocity Component | Velocity Range | HCO+/H13CO+ | HCN/H13CN | HNC/HN13C |
|---|---|---|---|---|---|
| LSR [km s-1] | [km s-1] | ratio of | ratio of | ratio of | |
| Halo 1 | 100 | [50, 190] | 45.5 5.4 | 13.50.2 | 25.6 |
| 87 | [50, 97] | 73.9 | 25.82.0 | 7.5 | |
| 117 | [97,135] | 32 3.7 | 11.30.1 | 37.5 | |
| 144 | [135,190] | 39.124.7 | 16.71.8 | 2.7 | |
| Halo 2 | [,] | 73.136.5 | 14.6 1.0 | 15.4 | |
| left wing | [,] | 34.4 | 21.2 3.3 | 8 | |
| right wing | [, ] | 53.226.1 | 11.6 0.9 | 13.6 | |
| Halo 3 | [,] | 38 5.0 | 13 0.3 | 40.1 | |
| left wing | [,] | 54.2 37.7 | 19.2 1.9 | 10.4 | |
| central peak | [, ] | 35.7 4.0 | 12 0.2 | 48.3 21.8 | |
| Halo 4 | 200 | [150, 250] | 28.3 5.4 | 11.8 0.9 | 14.9 3.1 |
| peak | [150, 210] | 29.2 7.5 | 11.7 0.8 | 17.9 3.9 | |
| right wing | [210, 250] | 10.6 | 12.4 4.0 | 7.1 3.4 | |
| Halo 5 | [,] | 13.8 5.0 | 6.9 0.3 | 22.8 12 | |
| Disk X1-1 | 180 | [140,230] | 56 6.4 | 10.8 0.1 | 25.5 7.5 |
| left wing | [140,180] | 57.2 7.5 | 11.6 0.1 | 8 | |
| right wing | [180,230] | 54.4 11 | 9.9 0.2 | 15.7 4.4 | |
| Disk X2-1 | 95 | [50,140] | 29 1.6 | 12.1 0.2 | 22.1 2.7 |
| left wing | [50,92] | 32.4 3.7 | 13.9 0.4 | 22.8 4.0 | |
| right wing | [92,140] | 27.3 1.7 | 11.3 0.2 | 21.7 8.6 | |
| Disk X1-2 | 67 | [0,100] | 42.1 8.6 | 9.4 0.1 | 9.9 1.3 |
| Disk X2-2 | [,] | 21.7 1.9 | 6.6 0.1 | 13.1 1.0 | |
| Disk 1 | 66 | [35,105] | 14.0 2.8 | 13.1 1.0 | 15.8 3.6 |
| central peak | [35,70] | 16.4 4.6 | 23.1 3.8 | 11.4 | |
| right wing | [70,105] | 11.6 3.4 | 7.8 0.7 | 11.7 2.7 | |
| Disk 2 | left wing | [0, 43] | 29.1 | 9.1 0.2 | 21.9 |
| 55 | [43, 97] | 4.1 0.1 | 3.5 0.1 | 3.7 0.1 | |
| right wing | [97,135] | 16.1 2.3 | 13.8 1.3 | 2.6 |
4 The 12C/13C isotopic ratios
The isotopologues that we observed in this work have very similar rotational constant and Einstein coefficients. Therefore the beam size is very similar and for optically thin emission, one would expect that line intensity ratios would be directly converted into column density ratis, i.e.,
In general, the molecular isotopologue ratios (see Table 3) do not translate directly into 12C/13C isotopic ratios. Opacity, chemical fractionation and selective photodissociation effects must be considered to derive the isotopic ratios from molecular line intensity ratios. In the following, we will discuss the importance of these effects on the 12C/13C isotopic ratios that we derive from our integrated intensity ratio of the isotopologues.
4.1 Opacity effects, isotopic fractionation and selective photodissociation
In our case, it is not possible to estimate the line optical depth from the emission of just one single transition. Since optical depth effects will saturate the emission from the most abundant isotopologue, our derived molecular isotopic ratios must be considered to be lower limits to the actual 12C/13C isotopic ratios. In almost all cases, the HCO+/H13CO+ intensity ratios or their limits are higher than those derived from the HCN and HNC isotopomers. This may be interpreted as HCO+ being the least optically thick among the three molecular line emission used in this work. Therefore, HCO+/H13CO+ intensity ratios give the most stringent limits to the 12C/13C isotopic ratios. We still cannot exclude that also HCO+ are affected by opacity effects. Hence 12C/13C isotopic ratios are even higher than inferred from the HCO+/H13CO+ intensity ratios. In the following we will therefore only consider the isotopologue ratios derived from HCO+.
Another important effect may be the chemical fractionation (Wilson 1999, and references therein). Langer et al. (1984) have studied the fractionation of carbon and oxygen isotopes with a time-dependent chemical model. Their model considers a cloud lifetime of years, temperatures from 6 to 80 K, H2 densities from to cm-3, and a wide range of metal abundances. Fractionation in HCO+ was also studied by Woods & Willacy (2009) for protoplanetary disks, which can have a larger impact in the 12C/13C ratio, but with temperatures and densities different from that of the GC. Langer et al. (1984) found that the behavior of the carbon isotope ratios can be split into three groups: CO, HCO+, and “carbon-isotope pool” (which includes the remaining carbon species, such as C+, H2CO, CS, etc). They found that the 13C is enhanced in the CO (specially at low temperature, low density, and high metal abundance), the 12C is enhanced in the “carbon isotope pool” group, and the HCO+ could present both fractionation effects, depending on the physical condition. The behavior of HCO+ is related to the formation of this molecule from both CO and from the “carbon pool isotopes”. The formation of HCO+ has been explained by the ion-molecule chemistry (Wilson et al. 2009), where the reaction:
| (1) |
likely leads the production of HCO+. H13CO+ is more tightly bound than HCO+ by 0.8 meV (9 K). The reactions that have the potential to produce isotopic fractionation occurs by proton-switching reactions between formyl ions and carbon monoxide by (Langer et al. 1984, 1978)
| (2) |
As it is shown in Fig. 1 of Langer et al. (1984), the isotopic ratio derived from HCO+ presents only moderate fractionation. The H12CO+/H13CO+ ratio is slightly enhanced at low density and moderate temperature, and decreases at low temperatures and certain densities (n(H and n(H). In this model, Langer et al. (1984) considered the formation paths of HCO+ shown in the Table 2 of Graedel et al. (1982). Hüttemeister et al. (1998) and Rodríguez-Fernández et al. (2002) have found that the gas in the GC has temperatures ranging from 20 to 200 K. For this temperature range, the predicted fractionation of HCO+ is negligible and the fractionation of 13CO cannot occur. In the worst case, the isotopic ratio throughout the GC should not increase selectively one of the molecular isotopologue against the other by more than 20.
For molecular clouds affected by UV radiation, selective photodissociation can take place, which would increase the 12C/13C isotopic ratio. The more abundant molecules (the main isotopologues) are less affected by photodissociation through self-shielding against UV radiation than the rarer isotopologues. So far, studies of the HCO+ and its 13C isotopologue in PDRs have not shown any clear evidence for selective photodissociation (Fuente et al. 2003). Milam et al. (2005) concluded that the 12C/13C isotopic ratio derived from high density tracers like CN are very unlikely influenced by isotope-selective photodissociation. However the self-shielding and photodissociation of CO (e.g., Glassgold et al. 1985; Bally & Langer 1982; Chu & Watson 1983) could affect our derived 12C/13C ratios through the formation of HCO+ via the reaction in Eq. 1. Modeling this effect, Chu & Watson (1983) concluded that the selective photodissociation will have a negligible impact in the 13CO/12CO ratio. Although the local enviroment of the GMLs is so far unknown, there are no signposts of UV radiation. There is only a nearby ultracompact H II region identified at , but its radial velocity of km s-1, suggests that it is not associated with the foot points (Torii et al. 2010), making very unlikely any effect in our derived isotopic ratios due to photodissociation. The small 13CO/12CO ratio observed in the GMLs by Torii et al. (2010) do not support that the bulk of the gas is self shielded in 12CO but photodissociated in 13CO. The small ratios are likely due to optically thick emission in 12CO, suggesting rather large CO column densities. Then the bulk of the gas will not be affected by the rather low fluxes of Far UV radiation inferred from the lack of H II regions (Torii et al. 2010) in the area. Under these conditions, it is highly unlikely that the fractionation/self-shielding effect in the 13CO/12CO could explain the observed high H12CO+/H13CO+ ratios. We conclude that the line intensity ratios derived from our data correspond to a lower limit to the actual 12C/13C isotopic ratio.
We derive H12CO+/H13CO+ intensity ratios from 4 to . The lowest value of 4 is found toward the source Disk 2, in the position of Sgr B2 where one would expect a value of . Such a low measured value indicates that HCO+ is optically thick. From the results in Table 3 we find a systematic trend in the isotopologue ratios with the largest values, , found toward Halo 1 and Halo 2. Also Halo 3 and Disk X1-1 and Disk X1-2 show large values of .
5 Discussion
It is remarkable that there is a systematic trend of the 12C/13C isotopic ratio found toward the halo and in the disk for the kinematic components associated with the X1 orbits, to be systematically larger by a factor of at least 2 than the standard value in the GC of 25. This suggests that there is less processed material in the halo and in the X1 orbits than in the X2 orbits and the reference GC positions in the disk.
Surprisingly, the isotopic ratios measured in the Halo 4 and Halo 5 positions at the top of the GMLs show a lower 12C/13C isotopic ratio than in the other halo positions, closer to the “standard” values of the disk. From our data, it is still not clear if this low isotopic ratio is due to opacity effects in the main isotope or due to a mixture with more processed gas from stellar nucleosynthesis in the GC region, likely ejected to high latitudes from the disk.
5.1 History of the chemical evolution of the molecular gas in the Galactic center
The lower limits to the 12C/13C isotopic abundance ratios derived from our HCO+ data toward the “typical” GC molecular clouds (Disk 1, Disk 2, Disk X2-1, Disk X2-2) range between 4 to 32, with an average value of 20. These results agree with the values found in the literature for the GC (20-25, Wilson 1999), and with the average value derived by Riquelme et al. (2010) of (from the HCO+/H13CO+ integrated intensity ratio throughout the GC region), showing a considerable nuclear processing. In contrast, we have found much higher limits to the isotopic ratios toward the locations where gas in the inner disk111Throughout this work, all the positions observed and discussed are in the Galactic center region (in the central kpc of the Galaxy). We call “disk” to the disk in the CMZ, “inner disk” to the allowed velocities in the X2 orbits, and “outer disk” and “outskirts of the disk” to the non-circular motions (X1 orbits). is expected to be interacting with that in the halo and in the disk. Indeed, the gas in the X1 orbits is of different nature than that in the X2 orbits, as clearly reflected by their different isotopic ratios of and , respectively. Furthermore, in the halo, the interaction occurs when the gas in the top of the loops flows toward the foot points of the GMLs. In both cases, the isotopic ratio reflects a different nature of the gas than that in the GC. The 12C/13C isotopic ratio of the gas in the halo and in the X1 orbits are in general larger than 40, reaching values larger than 70 in “Halo 1”. Previous studies show a clear gradient in the 12C/13C ratio with galactocentric distance. The ratio changes from a value of about 50 in the inner Galaxy (4 kpc) to nearly 70 in the local ISM, and in the solar system, with a value in the GC (Wilson 1999), which reflects higher nuclear processing toward the inner Galaxy. Studies of the isotopic ratios in the GC (Henkel et al. 1985; Stark 1981; Langer & Penzias 1990; Wannier 1980) have shown that the interstellar gas at the GC is in an advanced state of chemical evolution (which corresponds to an enrichment of with respect to the local gas). This gradient indicates that the material is flowing to the inner central kiloparsec of the GC from the Galactic halo (in the case of GMLs) and the outskirts of the Galactic disk (in case of X1-X2 interacting orbits).
5.2 The origin of molecular gas in the GML
Our lower limits to the 12C/13C isotopic ratios in the halo sources for the
foot points of the GMLs are close to the values measured in the local
ISM (69, Wilson 1999). Based on energetical and morphological arguments, Fukui et al. (2006) argued
that it is impossible that the loop features could be created by
supershells or supernova explosions. Our data strongly support their claim.
If the loop features were formed by supernova or hypernova explosions,
the gas at the foot points should have been ejected from the GC to
high latitudes, reflecting the isotopic ratio found throughout the
GC. It is likely that the gas in the GMLs have been accreted
from high latitudes. However, if the low isotopologue ratio found at the top of the loops is confirmed to be the actual isotopic ratios, this might be an indication that some gas in the halo could have been also ejected from the disk.
Magneto-hydrodynamical
simulations have been successful in explaining the formation of the
loops (Matsumoto et al. 1988; Horiuchi et al. 1988; Fukui et al. 2006; Machida et al. 2009; Takahashi et al. 2009). They claimed that the GMLs have been formed as
a natural consequence of a differentially rotating magnetized gas disk
under a strong gravitational potential (Machida et al. 2009). It is
found that the loop efficiently accumulates gas generating a dense
layer at the top of the loops. However, our results are not consistent
with the magneto-hydrodynamical loop scenario in which the gas in the GML
falling to their foot point should share the same isotopic ratios
as the gas in the Galactic disk. Morris (2006) has also pointed out
that there is too much gas left at the top of the loops if the gas were
flowing down along the magnetic field lines. Morris (2006) and
Torii et al. (2009) alternatively proposed that ambient HI gas may be
converted in the GML into H2 during flotation. It is likely that the loops are surrounded by H I gas. The rising portion of the magnetic loops suffer shocks that compress the relatively rarefied atomic gas in front of
it, leading to rapid cooling and, ultimately, to a phase transition
from atomic to molecular gas Morris (2006). Therefore the molecular gas that defines
the loops is constantly replenished. This scenario also support our results, because the gas in the foot point of the loop has not yet been processed by star formation.
5.3 Gas accretion from the outer disk
We have also found high isotopic ratios toward the non-circular components in the nuclear disk which have been explained in terms of a stellar bar driven potential (Binney et al. 1991). The 1∘.3 complex has been observed and studied by several authors (Tanaka et al. 2007; Oka et al. 2001; Hüttemeister et al. 1998). This molecular complex shows broad velocity widths and a large latitudinal height scale. The molecular emission shows two velocity components, one centered at km s-1 and the other at km s-1, which correspond to our Disk X2-1 and Disk X1-1 sources respectively. Tanaka et al. (2007) found an enhancement of the CO , HCO+ , HCN with respect to the CO , and an enhancement in the abundance of SiO in the high velocity component ( km s-1). They also identified several expanding shells very prominent at km s-1 associated with recent star formation. They conclude that the two components correspond to different types of gas with different kinematics and physical conditions. Our Disk X1-1 component presents an enhancement of the SiO/13CO intensity ratio of a factor (Tanaka et al. 2007) with respect to the lower velocity component (Disk X2-1). Like Hüttemeister et al. (1998), Tanaka et al. (2007) explained the high SiO abundance as a consequence of recent shock activity.
From our measurements of isotopic ratios, we conclude that the gas associated with the lowest velocity component presents a “typical” GC isotopic ratio consistent with previous ideas of chemistry dominated by shocks generated by supernova explosions. It is very unlikely, however, that the higher velocity component, Disk X1-1, could be associated to the supernova scenario like the Disk X2-1 component, as also inferred from the high isotopic ratio found toward this source. The most likely scenario is that the high SiO abundance is the result of the shocks generated by the transfer of gas between the X1 and X2 orbits as suggested by the potential bar scenario.
6 Conclusions
We have determined lower limits to the 12C/13C isotopic ratio toward 9 positions in the GC region, both in the Disk and in the Halo. In contrast with the values found in the disk sources (), we found high isotopic ratios toward the locations where the disk-halo () and X1-X2 orbit interactions (). Our results are consistent with a scenario where gas from the halo is accreted to the disk and with the transfer of gas from the outskirt of the disk to the GC through X1 and X2 orbits as suggested by the potential bar scenario.
Acknowledgements.
D.R. and R.M. were supported by DGI grant AYA 2008-06181-C02-02. J.M-P. and S.M. have been partially supported by the Spanish MICINN under grant number ESP2007-65812-C02-01. L.B. acknowledges support from FONDAP Center for Astrophysics 15010003 and from Center of Excellence in Astrophysics and Associated Technologies (PFB 06).References
- Audouze (1985) Audouze, J. 1985, in ESO Astroph. Symp., Vol. 21, ESO Astrophys. Symp., ed. I. J. Danziger, F. Matteucci, & K. Kjar, 373
- Bally & Langer (1982) Bally, J. & Langer, W. D. 1982, ApJ, 255, 143
- Binney et al. (1991) Binney, J., Gerhard, O. E., Stark, A. A., Bally, J., & Uchida, K. I. 1991, MNRAS, 252, 210
- Chu & Watson (1983) Chu, Y. & Watson, W. D. 1983, ApJ, 267, 151
- Contopoulos & Papayannopoulos (1980) Contopoulos, G. & Papayannopoulos, T. 1980, A&A, 92, 33
- Fuente et al. (2003) Fuente, A., Rodríguez-Franco, A., García-Burillo, S., Martín-Pintado, J., & Black, J. H. 2003, A&A, 406, 899
- Fukui et al. (2006) Fukui, Y., Yamamoto, H., Fujishita, M., et al. 2006, Sci., 314, 106
- García-Burillo et al. (2005) García-Burillo, S., Combes, F., Schinnerer, E., Boone, F., & Hunt, L. K. 2005, A&A, 441, 1011
- Ghez et al. (2005) Ghez, A. M., Salim, S., Hornstein, S. D., et al. 2005, ApJ, 620, 744
- Glassgold et al. (1985) Glassgold, A. E., Huggins, P. J., & Langer, W. D. 1985, ApJ, 290, 615
- Graedel et al. (1982) Graedel, T. E., Langer, W. D., & Frerking, M. A. 1982, ApJS, 48, 321
- Henkel et al. (1985) Henkel, C., Güsten, R., & Gardner, F. F. 1985, A&A, 143, 148
- Horiuchi et al. (1988) Horiuchi, T., Matsumoto, R., Hanawa, T., & Shibata, K. 1988, PASJ, 40, 147
- Hüttemeister et al. (1998) Hüttemeister, S., Dahmen, G., Mauersberger, R., et al. 1998, A&A, 334, 646
- Langer et al. (1984) Langer, W. D., Graedel, T. E., Frerking, M. A., & Armentrout, P. B. 1984, ApJ, 277, 581
- Langer & Penzias (1990) Langer, W. D. & Penzias, A. A. 1990, ApJ, 357, 477
- Langer et al. (1978) Langer, W. D., Wilson, R. W., Henry, P. S., & Guélin, M. 1978, ApJ, 225, L139
- Machida et al. (2009) Machida, M., Matsumoto, R., Nozawa, S., et al. 2009, PASJ, 61, 411
- Maciejewski & Sparke (2000) Maciejewski, W. & Sparke, L. S. 2000, MNRAS, 313, 745
- Martín et al. (2008) Martín, S., Requena-Torres, M. A., Martín-Pintado, J., & Mauersberger, R. 2008, ApJ, 678, 245
- Matsumoto et al. (1988) Matsumoto, R., Horiuchi, T., Shibata, K., & Hanawa, T. 1988, PASJ, 40, 171
- Mauersberger & Henkel (1993) Mauersberger, R. & Henkel, C. 1993, in Rev. in Modern Astronomy, Vol. 6, 69
- Meyer (1994) Meyer, B. S. 1994, ARA&A, 32, 153
- Milam et al. (2005) Milam, S. N., Savage, C., Brewster, M. A., Ziurys, L. M., & Wyckoff, S. 2005, ApJ, 634, 1126
- Morris et al. (1999) Morris, M., Ghez, A. M., & Becklin, E. E. 1999, Adv. in Space Res., 23, 959
- Morris & Serabyn (1996) Morris, M. & Serabyn, E. 1996, ARA&A, 34, 645
- Morris (2006) Morris, M. R. 2006, Sci., 314, 70
- Oka et al. (2001) Oka, T., Hasegawa, T., Sato, F., et al. 2001, ApJ, 562, 348
- Prantzos et al. (1996) Prantzos, N., Aubert, O., & Audouze, J. 1996, A&A, 309, 760
- Riquelme et al. (2010) Riquelme, D., Bronfman, L., Mauersberger, R., May, J., & Wilson, L. T. 2010, ArXiv e-prints
- Rodríguez-Fernández et al. (2002) Rodríguez-Fernández, N. J., Martín-Pintado, J., de Vicente, P., & Fuente, A. 2002, Ap&SS, 281, 331
- Stark (1981) Stark, A. A. 1981, ApJ, 245, 99
- Stark et al. (2004) Stark, A. A., Martin, C. L., Walsh, W. M., et al. 2004, ApJ, 614, L41
- Takahashi et al. (2009) Takahashi, K., Nozawa, S., Matsumoto, R., et al. 2009, ArXiv e-prints
- Tanaka et al. (2007) Tanaka, K., Kamegai, K., Nagai, M., & Oka, T. 2007, PASJ, 59, 323
- Torii et al. (2010) Torii, K., Kudo, N., Fujishita, M., et al. 2010, PASJ, 62, 675
- Torii et al. (2009) Torii, K., Kudo, N., Fujishita, M., et al. 2009, ArXiv e-prints
- Usero et al. (2004) Usero, A., García-Burillo, S., Fuente, A., Martín-Pintado, J., & Rodríguez-Fernández, N. J. 2004, A&A, 419, 897
- Wannier (1980) Wannier, P. G. 1980, ARA&A, 18, 399
- Wilson (1999) Wilson, T. L. 1999, Rep. Progr. Phys., 62, 143
- Wilson & Matteucci (1992) Wilson, T. L. & Matteucci, F. 1992, A&A Rev., 4, 1
- Wilson et al. (2009) Wilson, T. L., Rohlfs, K., & Hüttemeister, S. 2009, Tools of Radio Astronomy (Springer-Verlag)
- Woods & Willacy (2009) Woods, P. M. & Willacy, K. 2009, ApJ, 693, 1360