Two-dimensional melting in simple atomic systems : continuous vs. discontinous melting
Abstract
We investigate the characteristics of two dimensional melting in simple atomic systems via isobaric-isothermal () and isochoric-isothermal () molecular dynamics simulations with special focus on the effect of the range of the potential on the melting. We find that the system with interatomic potential of longer range clearly exhibits a region (in the plane) of (thermodynamically) stable hexatic phase. On the other hand, the one with shorter range potential exhibits a first-order melting transition both in and ensembles. Melting of the system with intermediate range potential shows a hexatic-like feature near the melting transition in ensemble, but it undergoes an unstable hexatic-like phase during melting process in ensemble, which implies existence of a weakly first order transition. The overall features represent a crossover from a continuous melting transition in the cases of longer-ranged potential to a discontinuous (first order) one in the systems with shorter and intermediate ranged potential. We also calculate the Binder cumulants as well as the susceptibility of the bond-orientational order parameter.
pacs:
64.70.Dv, 02.70.Ns, 05.70.Fh, 61.20.JaJuly 30, 2025
I Introduction
For decades, two dimensional meltingNelson2002 has been an important subject of research in condensed matter physics both theoretically and experimentally. One of the most important theoretical frameworks was given by Halperin and NelsonHalperin ; Nelson1979 , and YoungYoung who proposed (building upon the work by Kosterlitz and ThoulessKosterlitz ) the so called KTHNY theory that the two dimensional melting can occur in two stages of continuous defect-mediated transitions with the intermediate hexatic phase characterized by quasi-long-range orientational order and short range translational orderStrandburg-Review .
One of the most important questions in the two dimensional melting, which has not been satisfactorily answered yet, is probably the question of how to determine the form of the inter-particle potential that is most favorable for the existence of the hexatic phase. Even though several experimental studies support the existence of hexatic phasesMurray87 ; Kusner94 ; Marcus96 ; Zahn99 ; Pindak81 ; Brock86 ; Cheng88 ; Chou1998 ; Angel2005 ; Olafsen2005 ; Reis2006 , computational studies of two-dimensional melting of hard-core potential systemsSimulation-Review ; Strandburg89 ; Lee92 ; Bates2000 ; Mak2006 including hard discs or Lennard-Jones (LJ) potentials tend to favor first order transition scenarios (though some conflicting results also exist)Strandburg-Review . Chui, et alChui83-prl ; Chui83-prb ; Saito1982a ; Saito1982b advanced the possibility of first order melting transition through grain boundary formations when the defect core energy becomes low enough. Kleinert and Janke argued that the nature of the two-dimensional melting can change from continuous to first order transition as the magnitude of the so-called angular stiffness of the local rotation fieldkleinert1988 ; janke1988 ; kleinert1989 is decreased. From this argument, they contended that the melting of LJ systems would occur via first order, while, it would be continuous in the case of Wigner crystals where the particles are interacting via long-range Coulomb potentials.
Recently we investigated on the criterion for the existence of the hexatic phase by tuning the form of the interparticle potential (which is the Morse potential) that could change the size of the range of the dominant interparticle interactionsilee2008 . The Morse potential can be written as
| (1) |
where, is the distance between particles, the distance from the origin to the minimum of the potential, and is the strength of the interaction. After setting the and , we can vary the value of the single parameter to tune the softness and the range of the potential. Smaller value of corresponds to a softer potential with longer range of the attractive part of the potential. On the other hand, as the value of increases, the potential gets stiffer and shorter-ranged (Fig. 1).
In our previous work, we investigated the trend of hexatic phase formations as the range of the potential is varied. Detailed simulation results were presented especially in the regime of softer potential with , where the melting exhibits a stable region of hexatic phase on th plane.
Here in this work, we investigate how the characteristics of melting evolve as the value of is varied from to larger values of and . See Fig. 1, for the shape of the potentials for different values of . We observed that different types of melting are exhibited for an atomic system described by the Morse potential. A system with exhibits a melting transition which is compatible with the KTHNY theory, showing thermodynamically stable hexatic phase as well as two stage melting. For simulations with , it is found that, although some hexatic-like features are revealed in ensemble simulations, it exhibits a weakly first order transition in ensemble. Systems with a short range potential with show a strong first order transition compared to the case of , clearly showing coexistence of solid and liquid. These results appear to be consistent with the arguments of Kleinertkleinert1989 in that the systems with short-ranged potential are correlated with smaller angular stiffness and first order melting transition.
II Simulation Methods and Results
In this work, we performed MD simulations using the modified Parrinello-Rahman (PR) methodpr1980 ; Li92 combined with Nose-Hoover (NH) thermostatNose84 . As for the mass of the particles, for convenience, we put which implies that the time unit also becomes unity when we set and . The equations of motion were integrated via the Nordsieck-Gear 5th-order predictor-corrector method with the integration time step of . This guarantees the conservation of the total Hamiltonian without noticeable drift. In the simulations we used two empirical parameters, the barostat mass and the thermostat mass . Test simulations with several other values () of the parameters were also performed with almost the same results. The number of particles employed ranges from up to .
In order to investigate the characteristics of the melting transition, we obtained the isothermal equation of state on the plane of pressure vs. density. This was obtained by the NH-MD simulations by decoupling the PR (isobaric) part from NH-PR MD equations of motions by taking which reduces the system to condition. The pressure was evaluated by means of the virial expression for the range of the densities corresponding to the region of transition from liquid to solid. For each density, steps of integration were carried out for equilibration beginning with a configuration of triangular lattice and, after equilibration, steps of integration were performed for thermodynamic calculations.
In this case of ensemble we have to fix the shape of the box. In order to reduce the finite size effect, we used a rhombic box (with the smaller side angle of degrees) for the shape of the system with periodic boundary conditions. However, independent results of ours from square box showed no significant difference (from those of rhombic box) with respect to the quantities of our interest.
Important criterion for the existence of hexatic phase (and hence continuous melting transition) would be that the isothermal equation of state for pressure vs. density exhibit a monotonic behavior together with a non-monotonic region of dip in the slope . On the other hand, a first order melting transition would be associated with the existence of a van der Waals type loop in pressure vs. density curve with unstable and metastable region in ensemble simulations.
In order to investigate the nature of the possible hexatic phases, one has to compute the bond-orientational order parameter. The local bond-orientational order parameter at position is defined as
| (2) |
Here, the sum on particle is over the neighbors of the particle (corresponding to at the center with being the angle between the particles and with respect to a fixed reference axis. We regarded the particles within a cutoff radius as the neighbors, where the cutoff radius is chosen as the first minimum of the pair correlation function of the system. This method is found to be efficient and reliable for large scale simulationsBagchi96 .
Then the global bond-orientational order parameter is defined as
| (3) |
where denotes the total number of particles in the system. In order to distinguish the bond-orientational order of the different thermodynamic phases, we compute the spatial correlation function of the bond-orientational order parameter, defined as Halperin
| (4) |
In the hexatic phase, according to KTHNY theory, the bond-orientational correlation function is expected to exhibit an algebraic decay i.e., with the decay exponent , where corresponds to the limit of the power-law decay behavior in the KTHNY theory.
In order to further understand the nature of the hexatic phase we obtained the histogram distributionLee90 of the density order parameter for different system sizes for the values of pressure and temperature where a melting transition is expected to occur (from other measurements). We expect that histograms with single peaks would imply that there exists continuous melting transition. On the other hand, existence of double peaks with increasing peak heights (as the system size increases) would imply a first order transition.
We also investigate the behavior of the linear susceptibility for the global bond-orientational order parameter near the melting transition in order to check the consistency with the result from the isothermal equation of states. Specifically, we obtain the size dependence of the susceptibility by calculating the fluctuation of the bond-orientational order parameter for sub-blocks of the system with linear sizes , which is defined asweber95
| (5) |
where is the spatial dimension. In the computation, the system is sub-divided into sub-blocks of linear sizes with where ranges from to .
Also, it is useful to calculate the Binder cumulant for the global bond-orientationl order parameter for subsystem (linear) size is defined by
| (6) |
where the subscript denotes that the quantities are calculates for subsystem sizes of linear size .
II.1 The case of a soft and long-ranged Morse potential:
Here, we first deal with the case of a moderately soft (and longer ranged) potential with . Figure 2 shows the isothermal equation of state (at ) on the plane of pressure vs. density. This was obtained by the NH-MD simulations by decoupling the PR (isobaric) part from NH-PR MD equations of motions by taking which reduces to condition. We here define the density as where is the total number of particles and the total volume (area in two dimensions) of the system. Densities were chosen from the range , with the density increment of and the pressure was evaluated by means of the virial expression (with ). This range of the density corresponds to the region of transition from liquid to solid. For each density, steps of integration were carried out for equilibration beginning with a configuration of triangular lattice and, after equilibration, steps of integration were performed for thermodynamic calculations.
The number of particles employed was . In order to reduce the finite size boundary effect, we used a rhombic box (with the smaller side angle of degrees) for the shape of the system with periodic boundary conditions. However, independent results of ours from square box showed no significant difference (from those of rhombic box) with respect to the quantities of our interest.
The isothermal curve increases monotonically near the transition region satisfying the condition of mechanical stability (unlike the discontinuity of density in a first order transition) that the isothermal compressibility should be positive . We may identify the boundary of stable hexatic phase as the values of the density where an abrupt change in the isothermal compressibility occurs. In this way, we estimate the density of solid-hexatic transition as .
Although the change in isothermal compressibility is less conspicuous near the hexatic-liquid boundary, we see that, near the density , there exists a crossover in the slope of the isothermal compressibility. Below, we give an estimation of the density of hexatic-liquid transition by applying a theoretical expectation from KTHNY theory on the decay exponent of the spatial correlation of the orientational order parameter (see below).
The fact that the pressure within the hexatic phase is monotonically increasing as the density increases (with the resulting isothermal compressibility kept positive) appears to be a very compelling evidence for a stable hexatic phase in thermal equilibrium.
In order to distinguish the orientational order of the phases, we have computed the bond-orientational correlation function defined above.
Figure. 3 is the bond-orientational correlation function for the range of the density (). We find that, for the density range of , the averaged correlation functions exhibit algebraic decays with the decay exponent while, at lower densities, they exhibit decays with faster than power law behavior in the long distance limit. At , the orientational correlation exhibit a slope of approximately . Here, the crossover from a power law decay to exponential takes places with exponent approximately equal to , and also this value of the crossover density agrees almost precisely with the density region exhibiting an abrupt change of the slope i.e., of the compressiblity in the equation of state (Figure 2).
Now, the fourth order Binder cumulant for the global bond-orientationl order parameter for sub-block systems of (linear) size is shown in Fig. 4. We can see that the density at the crossing point is around . This is compatible with the boundary density () between the liquid and the hexatic phase which was shown above in isothermal curve for ensemble, and also compatible with the the boundary density between liquid and hexatic-like phase in terms of the power law decay of the bond-orientational order near
It may be expected theoretically that the binder cumulants of local orientational order in hexatic phase collapse to a line because of the critical charateristic of the phase. However, we may not consider non-collapse of the Binder cumulants to a line as an evidence for non-existence of hexatic phases. This is because, even for the case of XY model, complete collapse was not found in the region where orientational order decay algebraically, but rather it exhibits a crossing point at the transition temperature oliveira .
Now, we turn to the linear susceptibility for the global bond-orientational order parameters near the melting transition. Shown in Fig. 5 is the sub-block susceptibility obtained from the fluctuation of the bond-orientational order parameter for sub-blocks of the system with linear sizes with where ranges from to . We see that the suceptibility shows a broad peak region near the density which borders the liquid-hexatic phase boundary region. We also see that the suceptibility exhibits broader shape (showing weaker dependence on the density) in the liquid region compared with other cases that will be shown below.
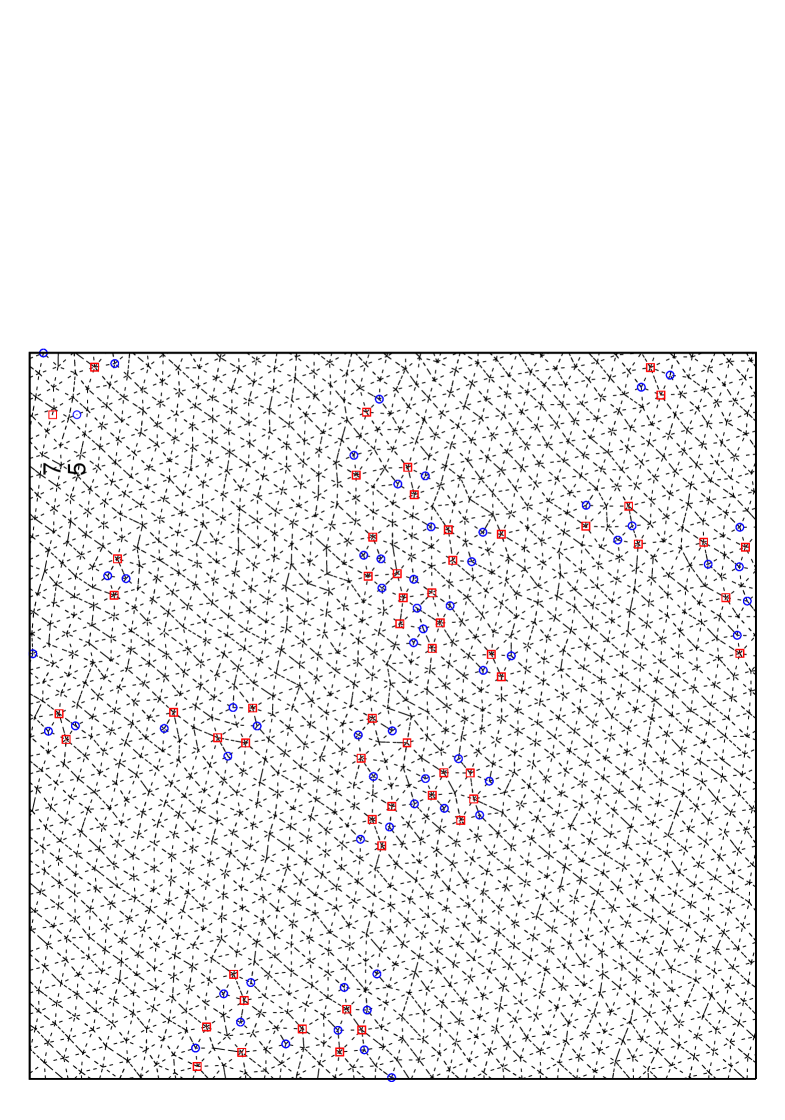
Figure 6 shows a snapshot of the particle configuration for density within the hexatic phase region but close to the transition (to liquid phase) at the temperature , which shows free dislocations (i.e., bounded pair disclinations). This shows rather clearly the fundamental role of defects leading to the power law decay of orientational correlations.
In order to further understand the nature of the hexatic phase we obtained the histogram distributionLee90 of the density order parameter for five different system sizes () under constant external pressure and temperature of , and , where a hexatic phase is expected to occur from our measurement of the orientational correlations. In Fig. 7 we see that all the histograms exhibit single peaks, which implies that there exist a unique phase with minimum free energy. It is also observed that, as the number of particles increases, the peak height becomes higher and, at the same time, the width of the peak decreases. Also the position of the peak tends to shift to the lower density (within the hexatic regime) probably due to the development of long range fluctuation. This indicates that this region corresponds to a single phase region (unlike solid-liquid mixture) consistent with the absence of van der Waals loop in the pressure vs. density curve.
All of these observations lead us to the conclusion that there exist a thermodynamcally stable hexatic phase consistent with the KTHNY melting scenario for the case of .
II.2 The case of an intermediate-ranged potential:
Next, we examine an intermediate-range potential with , which corresponds approximately to the famous LJ potentialtclim2003 . In Fig. 8, the equation of state exhibits a weak van der Waals-like loop in the pressure vs. density, which indicates a first order transition. The unstable region ranges from to . This is confirmed more rigorously by the histogram distributions of the density in ensemble simulations for different system sizes. In Fig. 9, the histogram distributions of the density for systems with , , and are shown from ensemble for and . For the cases of and , we observe transitions between two peaks (through the valley of finite height between the peaks) with the resulting double peaks in the histograms. For the systems, however, we can no longer observe crossing between the the coexisting phases. Instead, we could observe two different (separate) histograms that are determined by the initial states, depending whether the initial state is in the ordered solid phase or in the disordered liquid phase. Evidently, the free energy barrier increases with increasing system size, which indicates clearly that the transition is of first orderLee90 . Nevertheless, the system configurations in the coexistence region resembles those of the hexatic phases (Fig. 10), showing algebraically decaying orientational order (Fig 11). We see that the boundary between liquid and hexatic-like phase in terms of the orientational order is located around .
Furthermore, we also observe a hexatic-like feature in the ensemble, where the system goes through temporarily a hexatic-like phase before transiting into the other phase. This kind of characteristics in ensemble seems to have been already reported as ‘metastable hexatic phase’ in LJ system by Chen et alChen95 ; Somer97 ; Somer98 . Although they argued that large system size () is necessary to observe this kind of features, we could observe such metastable hexatic phases even for systems with smaller sizes of . We think that this hexatic-like feature in a first order transition can be attributed to weakly first order nature of the transition. As shown below, the relative free energy barrier in this case is considerably lower than that in the case of shorter-ranged potential of , from which we presume that the metastable or unstable hexatic-like phase comes from defect proliferation by thermal fuctuations, but not from some mechanism leading to a true phase transition.
Now, the fourth order Binder cumulant for the global bond-orientationl order parameter for sub-block systems of (linear) size is shown in Fig. 12. We can see that the density at the crossing point is located near . This corresponds to a point in the middle of the unstable part of the van der Waals curve in the isothermal equation of state.
Next, we deal with the linear susceptibility for the bond-orientational order parameters. Shown in Fig. 13 is the sub-block susceptibility obtained from the fluctuation of the bond-orientational order parameter for sub-blocks of the system with linear sizes with where ranges from to . We see that the suceptibility shows a sharper peak (as compared with the case of ) at the density which is a little bit below the density () where the orientational correlation exhibits a spatial decay exponent of . This might be interpreted as a small evidence that the nature of the melting transition of this system is inconsistent with the expectation of the KTHNY theory.
II.3 The case of a short-ranged potential:
Finally, we investigate the case of a short-ranged potential with . Figure. 14 shows the equation of state in the density region of obtained from ensemble simulations at . We can see that the equation of state exhibits a van der Waals-like region in the density with the unstable region ranging from to clearly indicating a first order melting transition.
The fourth order Binder cumulant for the global bond-orientationl order parameter for sub-block system size is shown in Fig. 15. We can see that the density at the crossing point is located near which is located near the lower density limit of the metastable solid (spinodal) as shown in the isothermal equation of state.
First order nature of the melting transition is confirmed further with the double peak nature of the histogram distributions of the density from ensemble simulations for system sizes of as shown in Fig. 16. In this case, the free energy barrier is presumably much higher than the case of , and none of the systems with exhibit any tunneling transitions between liquid-like states to solid-like states during MD steps of simulations with . Therefore, double peak histogram distributions for each of the system sizes are actually obtained by combining two separate histograms, one with ordered initial states (higher density) and the other with disordered initial states (lower density), respectively.
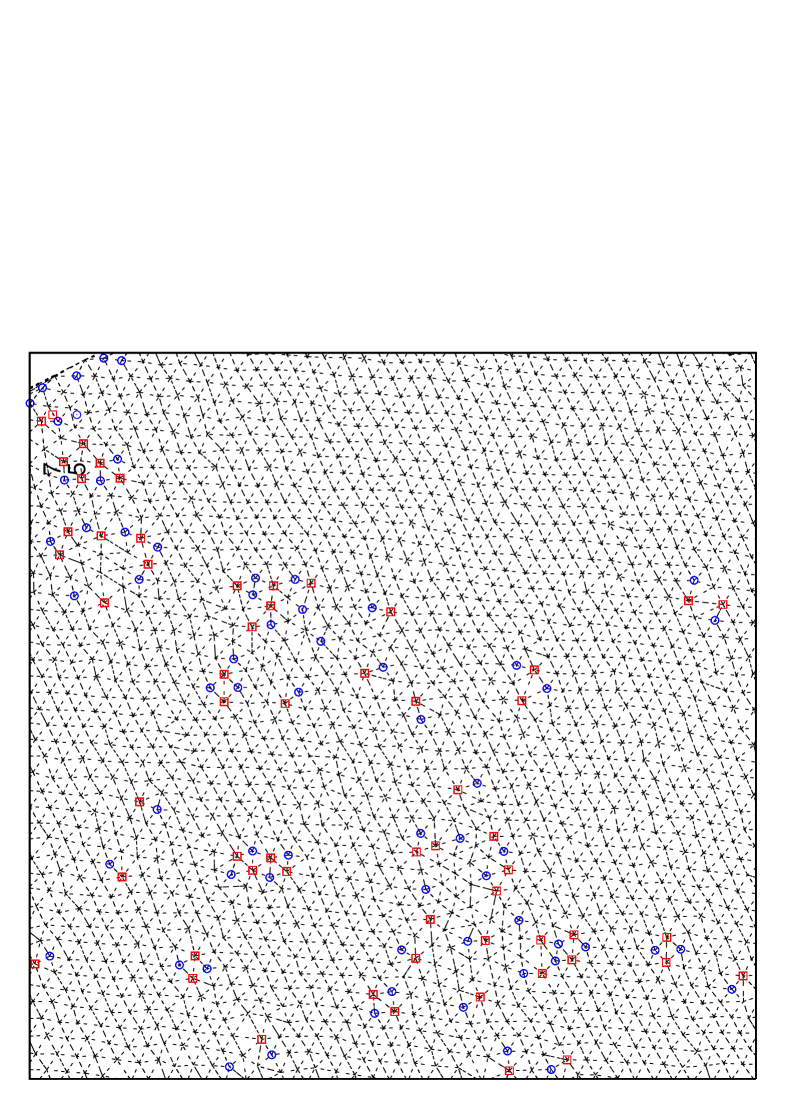
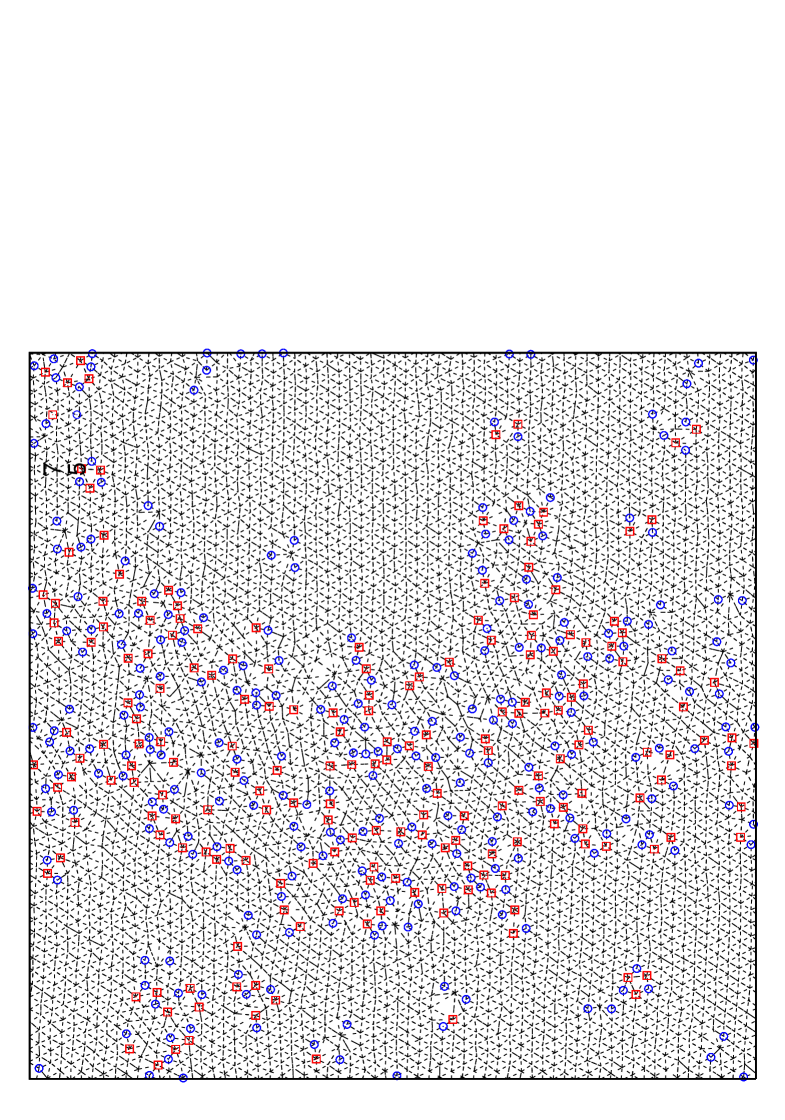
Also, typical system configuration for is shown in Fig. 17 for and corresponding to the coexisting region, where we can see that hexatic-like feature disappears, and that liquid phase region consisting of defect clusters coexists with solid region. Also in ensemble simulations of the melting process, we can no longer observe metastable or unstable hexatic phase, but observe a discontinuous abrupt change in density. From these observations we thus conclude that first order nature of the melting gets stronger as the potential range decreases.
Next, we look into the linear susceptibility for the bond-orientational order parameters. Shown in Fig. 18 is the sub-block susceptibility obtained from the fluctuation of the bond-orientational order parameter for sub-blocks of the system with linear sizes with where ranges from to . We see that the suceptibility shows a peak at the density which is located near the limit of the metastable liquid (spinodal) as shown in the curve of the isothermal equation of state from ensemble.
III Summary and discussions
In conclusion, we have reported on some details of two dimensional melting in systems of particles interacting via Morse potential when the range of the potential is varied. We showed that the melting of system with longer-ranged potential () clearly exhibits features of melting consistent with KTHNY theory exhibiting stable hexatic phases. As the range of the potential decreases, however, we observe a crossover in the transition nature to a first order transtion. In the case of where the range of the potential is intermediate, the system exhibits a weakly first order melting transition with some unstable hexatic-like phase during melting process in simulations. In the case of where the range of the potential is shorter, we observe a stronger first order melting. It appears that the crossover from continuous to first order melting transition in this system is related to the decrease of the so-called angular stiffness of the rotation fieldkleinert1988 ; janke1988 ; kleinert1989 . It would be interesting to carry out a detailed calculation of the angular stiffness in our model system as the value of is varied. It would be also interesting to find a possible connection to the change from continuous to first order transition in two dimensional model when the shape of the potential gets sharpeneddomany1984 ; himber_1984a ; himber_1984b .
References
- (1) D. R. Nelson, Defects and Geometry in Condensed Matter Physics, Cambridge University Press, Cambridge (2002).
- (2) B. I. Halperin, D. R. Nelson, Phys. Rev. Lett. 41, 121 (1978).
- (3) D. R. Nelson and B. I. Halperin, Phys. Rev. B 19, 2457 (1979).
- (4) A. P. Young, Phys. Rev. B. 19, 1855 (1979).
- (5) J. M. Kosterlitz and D. J. Thouless, J. Phys. C 6, 1181 (1973).
- (6) K. J. Strandburg, Rev. Mod. Phys. 60, 161 (1988).
- (7) C. A. Murray, and D. H. van Winkle, Phys. Rev. Lett. 58, 1200 (1987).
- (8) R. E. Kusner, J. A. Mann, J. Kerins, and A. J. Dahm, Phys. Rev. Lett. 73, 3113 (1994).
- (9) A. H. Marcus and Stuart A. Rice, Phys. Rev. Lett. 77, 2577 (1996).
- (10) K. Zahn, R. Lenke, and G. Maret, Phys. Rev. Lett. 82, 2721 (1999).
- (11) R. Pindak, D. E. Moncton, S. C. Davey, and J. W. Goodby, Phys. Rev. Lett. 46, 1135 (1981).
- (12) J. D. Brock, A. Aharony, R. J. Birgeneau, K. W. Evans-Lutterodt, J. D. Litster, P. M. Horn, G. B. Stephenson, and A. R. Tajbakhsh, Phys. Rev. Lett. 57, 98 (1986).
- (13) M. Cheng, J. T. Ho, S. W. Hui, and R. Pindak, Phys. Rev. Lett. 61, 550 (1988).
- (14) C.-F. Chou, A. J. Jin, S. W. Hui, C. C. Huang, and J. T. Ho, Science 280, 1424 (1998).
- (15) D. E. Angelescu, C. K. Harrison, M. L. Trawick, R. A. Register, and P. M. Chaikin, Phys. Rev. Lett. 95 , 025702 (2005).
- (16) J. S. Olafsen and J. S. Urbach, Phys. Rev. Lett. 95 , 098002 (2005).
- (17) P. M. Reis, R. A. Ingale, and M. D. Shattuck, Phys. Rev. Lett. 96 , 258001 (2006).
- (18) For earlier works, see Ref. Strandburg-Review and references therein.
- (19) S. T. Chui, Phys. Rev. Lett. 48, 933 (1983).
- (20) S. T. Chui, Phys. Rev. B 28, 178 (1983).
- (21) Y. Saito, Phys. Rev. Lett. 48, 1114 (1982).
- (22) Y. Saito, Phys. Rev. B 26, 6239 (1982).
- (23) H. Kleinert, Phys. Lett. A 130, 443 (1988).
- (24) W. Janke and H. Kleinert, Phys. Rev. Lett. 61, 2344 (1988).
- (25) H. Kleinert, Phys. Lett. A 136, 468 (1989).
- (26) Sang Il Lee and Sung Jong Lee, Phys. Rev. E 78, 041504 (2008).
- (27) K. J. Strandburg, J. A. Zollweg, and G. V. Chester, Phys. Rev. B. 30, 2755 (1989).
- (28) Jooyoung Lee and K. J. Strandburg, Phys. Rev. B. 46, 11190 (1992).
- (29) M. J. Bates and D. Frenkel, Phys. Rev. E. 61, 5223 (2000).
- (30) C. H. Mak, Phys. Rev. E. 73, 065104 (2006).
- (31) M. Parrinello and A. Rahman, Phys. Rev. Lett. 45, 1196 (1980).
- (32) M. Li, and W. L. Johnson, Phys. Rev. B. 46, 5237 (1992).
- (33) S. Nose, J. Chem. Phys. 81, 511 (1984).
- (34) Ken. Bagchi and Hans. C.Ȧndersen, Phys. Rev. Lett. 76, 255 (1996).
- (35) Jooyoung. Lee and J. M. Kosterlitz, Phys. Rev. Lett. 65, 137 (1990).
- (36) H. Weber, D. Marx, and K. Binder, Phys. Rev. B. 51, 14636 (1995).
- (37) N. M. Oliveira-Neto, S G Alves, R. L. Silva, A. R. Pereira and W. A. Moura-Melo, J. Phys. A: Math. Theor. 42, 385002 (2009).
- (38) T. C. Lim, Z. Naturforsch. 58a, 615 (2003).
- (39) K. Chen, T. Kaplan, and M. Mostoller, Phys. Rev. Lett. 74, 4019 (1995).
- (40) F. L. Somer, T. Kaplan, K. Chen, and M. Mostoller, Phys. Rev. Lett. 79, 3431 (1997).
- (41) F. L. Somer, Jr., G. S. Canright, and T. Kaplan, Phys. Rev. E. 58, 5748 (1998).
- (42) E. Domany, M. Schick, and R. H. Swendsen, Phys. Rev. Lett. 52, 1535 (1984).
- (43) J. E. van Himbergen, Phys. Rev. Lett. 53, 5 (1984).
- (44) J. E. van Himbergen, Phys. Rev. B. 29, 6387 (1984).