Unsupervised Reference-Free Summary Quality Evaluation via Contrastive Learning
Abstract
Evaluation of a document summarization system has been a critical factor to impact the success of the summarization task. Previous approaches, such as ROUGE, mainly consider the informativeness of the assessed summary and require human-generated references for each test summary. In this work, we propose to evaluate the summary qualities without reference summaries by unsupervised contrastive learning. Specifically, we design a new metric which covers both linguistic qualities and semantic informativeness based on BERT. To learn the metric, for each summary, we construct different types of negative samples with respect to different aspects of the summary qualities, and train our model with a ranking loss. Experiments on Newsroom and CNN/Daily Mail demonstrate that our new evaluation method outperforms other metrics even without reference summaries. Furthermore, we show that our method is general and transferable across datasets.
1 Introduction
Recently, there has been great success in automatic text summarization and generation Huang et al. (2020); LeClair et al. (2020); Chen et al. (2020). To better compare and improve the performance of models, evaluation for such systems has been a problem of interest. The selection of evaluation metrics will greatly affect the assessed quality of a generated summary and thus affect the evaluation of summarization models.
The most ideal metric is definitely human judgement, which is often treated as the gold standard. But human evaluation is time-consuming and labor-intensive, an automatic evaluation metric that cannot only save human resources but also simulate the ability of human judgement is of crucial importance.
Most of the existing automatic evaluation methods assess a summary by comparing it with reference texts written by humans. Some of them are model-free and simply use hand-crafted matching functions to calculate the similarity between the candidate summary and the reference Papineni et al. (2002); Lin and Och (2004); Banerjee and Lavie (2005). These methods consider both the reference and the candidate as a sequence of tokens or n-gram blocks. For instance, as the de facto standard evaluation metric, ROUGE Lin and Och (2004) calculates the n-gram overlap between the machine-generated summaries and reference summaries. Although these methods have the advantage of interpretability and efficiency, they are found to correlate poorly with human evaluation Novikova et al. (2017).
To reduce the requirement of exact word matching, some recent work tried to match the reference and the candidate summary in the embedding space of words or sentences Zhang et al. (2020); Clark et al. (2019); Zhao et al. (2019). For instance, BERTScore Zhang et al. (2020) uses contextual word embeddings generated by BERT and performs a greedy matching to obtain the maximum cosine similarity between two texts. These methods are proved to correlate better with human judgement than ROUGE on many datasets, which demonstrates the effectiveness of using contextual embeddings.
| Semantic | Linguistic | Else | |
| DUC-05, DUC- 06 and DUC-07 Xenouleas et al. (2019) | focus, non redundancy | grammaticality, structure & coherence | referential clarity |
| Newsroom 60 Sun and Nenkova (2019) | relevancy, informativeness, unnecessary content, verbosity | - | perfect surrogate, continue reading |
| *CNN/Daily Mail Chaganty et al. (2018) | - | fluency, overall quality, redundancy | - |
| *Newsroom Grusky et al. (2018) | informativeness, relevancy | coherence, fluency | - |
| NYT and CNN/Daily Mail Sharma et al. (2019) | informativeness | grammaticality, coherence | - |
However, the aforementioned methods all have some intrinsic drawbacks: these methods always need at least one human-generated reference to assess a candidate summary. References written by humans are costly to obtain. In addition, most of them only consider the semantic similarities with references, i.e. semantic qualities of the summaries, which ignores the linguistic qualities and other important aspects. In this paper, we propose a new unsupervised contrastive learning framework for automatically evaluating the summary qualities without comparing with reference summaries or training with human ratings. Specifically, we design an evaluator to consider both linguistic and semantic aspects of a summary. Then for each of the aspect we create a set of negative samples by perturbing the training samples. We compare the scores of original training samples and the negative samples to obtain the contrastive loss function and learn the evaluator. The experiments on Newsroom and CNN/Daily Mail demonstrate that our new evaluation method has much higher correlation with human judgement.
We summarize our contributions as follows:
-
•
We develop a new unsupervised method for summary quality evaluation which considers both linguistic and semantic aspects.
-
•
We creatively make negative samples with respect to our evaluation metric and train the evaluator by contrastive learning.
-
•
Our evaluator requires no reference summaries or human ratings but achieves the best performance on single-document summarization datasets, and the trained evaluator can be easily used across different datasets.
2 Related Work
2.1 Existing Evaluation Metrics
2.1.1 Reference-based Metrics
Most of the existing automatic metrics for summarization evaluation assess a model-generated summary (i.e. the candidate) by comparing it with a human-authored summary (i.e. the reference).
Some metrics are model-free and their scoring basis are often easy to interpret Papineni et al. (2002); Lin and Och (2004); Banerjee and Lavie (2005). For instance, as the most widely used metric for summarization evaluation, ROUGE Lin and Och (2004) measures the co-occurrence of n-grams or substrings between the reference and the candidate.
Most of the model-based methods Zhang et al. (2020); Zhao et al. (2019); Clark et al. (2019) compare the embeddings of the reference and the candidate. BERTSCore Zhang et al. (2020) uses pretrained BERT contextual embeddings Devlin et al. (2019) and performs a greedy matching to obtain the maximum cosine similarity between embeddings of tokens in the two texts. Clark et al. (2019) proposed metrics based on sentence mover’s similarity (SMS) by leveraging sentence-level embeddings for evaluating multi-sentence texts. MoverScore Zhao et al. (2019) combines n-gram contextual embeddings and Earth Mover’s Distance. BERTScore can be viewed as a special case of MoverScore. NUBIA Kané et al. (2020) considers three aspects of features of the reference-candidate pairs and aggregates the extracted features using a neural network regressor.
These metrics have a common drawback that the evaluation is based on costly human-authored references. To assess the quality of a generated text summary, we need to obtain a corresponding ground-truth reference.
2.1.2 Reference-free Metrics
Some work discussed how to evaluate the quality of generated text in the reference-free setting Louis and Nenkova (2013); Peyrard et al. (2017); Peyrard and Gurevych (2018); Shimanaka et al. (2018); Xenouleas et al. (2019); Sun and Nenkova (2019); Böhm et al. (2019); Chen et al. (2018); Gao et al. (2020). Louis and Nenkova (2013), Peyrard et al. (2017) and Peyrard and Gurevych (2018) leveraged regression models to fit human judgement. RUSE Shimanaka et al. (2018) use sentence embeddings generated by three different models and aggregate them using a MLP regressor. Xenouleas et al. (2019) proposed a method that also uses a regression model to predict the scores, while the predictions are based on hidden representations generated using BERT Devlin et al. (2019) as the encoder. However, these methods require ratings assigned by human annotators as training data which are also costly to obtain. In contrast, our method is unsupervised and requires no human ratings for training.
Sun and Nenkova (2019) discussed both reference-based and reference-free settings for summarization evaluation. Their method basically converts both the generated text and the text for comparison (denoted as T) into hidden representations using encoders like ELMo Peters et al. (2018) and calculates the cosine similarity between them, T in the reference-based setting and the reference-free setting stands for the human-authored reference text and the source document text, respectively. However, the experiment results show that their method’s correlation with human ratings is lower than ROUGE, especially in the reference-free setting. Chen et al. (2018) designed a Question-Answering based method to compare the content difference of two texts. Although this method provides a novel perspective and the evaluation basis is easy to interpret, the results show that it has not achieved better performance than ROUGE considering the lower correlation with human ratings.
SUPERT generates pseudo references and evaluates the quality of the test summaries by calculating word mover’s distance between the pseudo reference summaries and the test summaries Gao et al. (2020). It is similar to MoverScore Zhao et al. (2019) which uses the human-authored references instead of pseudo references. However, SUPERT mainly focuses on multi-document summarization evaluation, and its performance is inevitably worse than MoverScore.
The work closest to our model is an evaluation method for natural language generation (NLG) systems proposed by Zhou and Xu (2020). They implemented the sample-level evaluation by comparing a pair of texts. However, their method requires a set of different NLG systems and they need to generate weak supervision sample pairs from different checkpoints of a system. For testing, they also need to compare different samples to obtain a comparison score. In contrast, our model focuses on summarization evaluation; we do not need generated texts from many systems and different checkpoints of a system: all our negative samples are created by modifying the existing summaries; and in the test phase no comparison between different summaries is needed.
2.2 Dimensions of Evaluation
We investigated a few summarization datasets. As shown in Table 1, different datasets consider different evaluation dimensions. We observed that these dimensions can be roughly divided into three classes: the semantic quality (Semantic), the linguistic quality (Linguistic), and other dimensions that can be hardly classified (Else). In this paper, we design our method to cover both dimensions of semantic quality and linguistic quality.
3 Method
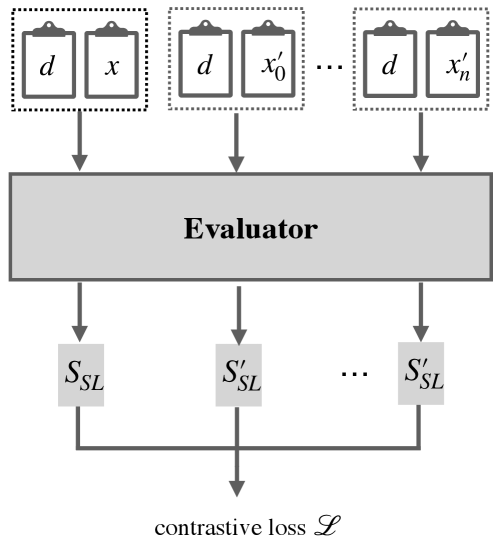
As shown in the previous section, two of the most important factors that impact the summary qualities are linguistic quality and semantic quality. Linguistic quality indicates how natural the generated summary is; it generally includes the fluency of each sentence, the coherence of entities/consecutive sentences, and the correctness of grammars. Semantic quality indicates whether a summary expresses the most important information of the original documents; it generally includes informativeness, relevance, and redundancy, etc. We consider both aspects and design our method in the following sections. Our model architecture is shown in Figure 1. The figure contains two parts, first we design our evaluator to assign scores to summaries based on a BERT encoder. Then we create negative samples and use a contrastive learning framework to train the evaluator.
3.1 Evaluating Semantic Quality
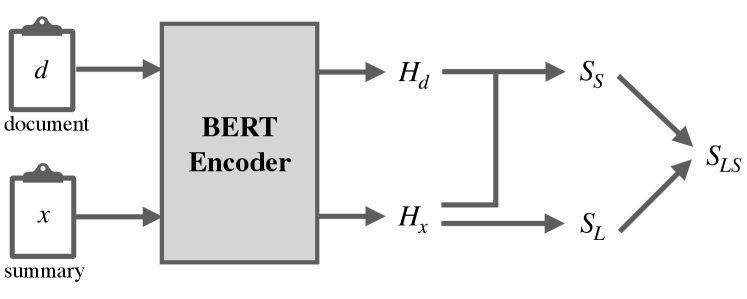
To better evaluate the semantic quality, we utilize the contextualized embeddings of BERT Devlin et al. (2019). BERT takes in a sequence which always starts with a special classification token [CLS] as input, and outputs the representation of this sequence. Each token has its own hidden state. The hidden state corresponding to [CLS] is supposed to aggregate information from the whole sequence. We design our evaluation model as follows.
Formally, let and be the sequence of tokens in the summary and the source document from which is generated. A sequence of tokens is encoded into a sequence of token embeddings by the BERT encoder.
| (1) |
| (2) |
In order to avoid the requirement of a reference summary, similar to Sun and Nenkova (2019), we measure the semantic quality of the target summary by calculating the semantic similarity between and its source document . Thus the semantic quality score is:
| (3) |
where refers to cosine similarity, denotes the hidden state corresponding to token[CLS].
3.2 Evaluating linguistic quality
For a summary and its sequence of tokens , the exact operations to obtain its linguistic quality score are as follows.
We first use the BERT encoder to get the representation of the summary .
| (4) |
where , is the sequence length and means the hidden size of the BERT encoder. Then we calculate the probability of the sequence based on this representation.
| (5) |
where and denotes two weight parameters and we omit biases here. stands for the vocabulary size. is an activation function, which is GELU in our experiments. A softmax operation is applied to every token’s embeddings to predict a probability distribution at each position in the sequence. Here we use to represent the probability of the -th token to be the same as . Motivated by the perplexity, the linguistic quality of can be calculated as:
| (6) |
| Original summary: |
| Kristina Patrick from Alaska filmed her German Shepherd Pakak performing a very skillful trick. Footage shows the pup taking the ball from her mouth with her paws and holding it up high in the air to admire it. She then carefully lowers it back down to the starting point. |
| Negative samples: |
| 1. delete words |
| Patrick from Alaska filmed her German Shepherd Pakak performing a very skillful trick. Footage shows the pup taking the from her with her paws and holding it up high in the air to it. She then carefully lowers it back down to the starting point. |
| 2. add sentences |
| Kristina Patrick from Alaska filmed her German Shepherd Pakak performing a very skillful trick. Footage shows the pup taking the ball from her mouth with her paws and holding it up high in the air to admire it. She then carefully lowers it back down to the starting point. PAKAK ’s owner says she loves playing with balls. |
| 3. disorder words |
| Kristina Patrick skillful Alaska filmed her performing Shepherd a German Pakak very from trick. Footage shows the pup taking the ball from admire mouth with and paws her holding it up high her to air the in it. She then back lowers it carefully to down the starting point. |
3.3 Evaluating Both Dimensions
In order to capture both the linguistic and semantic aspects, we develop our final metric by linearly combining the S_Score and L_Score. We call it LS_Score, which is a trade-off between the semantic score and linguistic score.
|
|
(7) |
The and are used to scale the L_Score and the S_Score. In our experiments we fix and to scale the L_Score and the S_Score.
3.4 Contrastive Training
To alleviate the requirement of reference summaries as well as given human evaluation scores, we develop a new unsupervised training framework via contrastive learning. Intuitively, for a given good summary, if we make some noise, e.g. disordering the words/sentences, we can easily create a summary with worse quality. Then we can compare these two summaries to get a contrastive loss. In practice, we can use human generated summaries in the training data as the ”good” summaries, however, they can also be replaced with other good machine-generated summaries. We do not require any reference summaries in the test phase, i.e. for a candidate summary without known reference summaries we can also predict a score for it. That increases the flexibility and generalizability of our evaluation method.
Given a base summary , assume we make some noise and get a set of negative samples , we formulate a ranking loss function as follows:
|
|
(8) |
where denotes the set of original summaries in the training set and is the set of corresponding noisy variants of a training sample . For a batch of , we obtain their scores predicted by an evaluation model and then update model parameters (including fine-tuning BERT) using the gradients of the loss function . In this way, we train the model to better distinguish between good and bad summaries.
Since we evaluate the summaries from two different aspects, for each aspect we create different types of noisy samples. For semantic quality, one straightforward strategy is to randomly remove some words or sentences in the original summary to get a new negative sample. Obviously the created new summary will encounter information loss compared to the original one, so its evaluator score will be lower. In our experiments, we randomly select 20% words (with no consideration of word types) to delete. We do not delete entire sentences because most of the summaries have only very few sentences (as shown in Table 3, the average number of sentences in a reference is 1.43 and 3.88 in Newsroom and CNN/Daily Mail, respectively), thus deleting sentences will cause too much information loss, which doesn’t benefit the model’s ability to distinguish good from bad.
In addition, we do not want the generated summaries to have too much redundant information. So we create another type of negative samples by adding redundant sentences. The redundant sentences are chosen randomly from the original document. Firstly we extract sentences from the original document. Then we filter out the sentences that are most similar to each sentence in the reference. At last, we randomly sample the redundant sentences from the remaining sentences in the reference.
For linguistic quality, the negative samples can be generated by either disordering the words/sentences or deleting words. Both of the operations will lead to loss of coherence or fluency. So the negative sampling strategy in this case is as follows: 1) randomly rotating the order of sentences or the order of words within a sentence. 2) randomly deleting some of the words in the original summary. Note that the second strategy is also used in generating noisy samples for semantic quality, but our LS_Score combines both semantic and linguistic quality, so we do not explicitly discriminate the two aspects for this type of negative samples.
Table 2 shows three examples of our negative samples, each of which represents one type of negative samples respectively. By differentiating the original summaries and the negative samples we enforce our evaluator to capture various aspects of the summary quality. The trained evaluator can then be used for evaluating summaries with unknown references. In our experiments, we generate only one negative sample per type of operations for each base summary, i.e. each base summary has 3 negative samples.
4 Experiments
We conduct our experiments to answer the following questions:
-
•
Does our contrastive learning method obtain better performance over other baselines even without reference summaries?
-
•
Can our evaluator capture the expected aspects of summary qualities, and does it outperform others under the same contrastive learning framework?
-
•
Is our method generalizable to different datasets? That is, how does it perform if we train the metric on one dataset and test on another one?
4.1 Experimental Settings
The encoder in our experiments to convert token sequence into embeddings is BERT Devlin et al. (2019). We simply use a pretrained BERT model bert-base-uncase which has 12 layers, a hidden size of 768, 12 attention heads and 110M parameters in total.111https://github.com/google-research/bert Our model is implemented based on the HuggingFace Transformers.222https://github.com/huggingface/transformers The max length of sequence we use for BERT encoding is 512, so we truncate the sequence longer than 510 tokens (despite the special tokens [CLS] and [SEP]).333Our code is publicly available at https://github.com/whl97/LS-Score.git.
| Newsroom | CNN/Daily | |
| # of doc-ref pairs | 108,802 | 10,932 |
| # of sens in doc | 31.08 | 34.20 |
| # of words in doc | 861.90 | 882.25 |
| # of sens in ref | 1.43 | 3.88 |
| # of words in ref | 34.90 | 64.87 |
| # of systems | 7 | 4 |
| # of generated sums | 420 | 1996 |
4.2 Datasets
We conduct empirical studies on two benchmark single-document summarization datasets. These datasets both have original documents, their corresponding human-authored summaries (i.e. references) and also some model-generated summaries that are manually rated in several dimensions, so we can compare different evaluation methods by their correlation with human ratings.
Newsroom. Proposed by Grusky et al. (2018), this summarization dataset includes 1.3 million documents and human-written summaries. In this corpus, there are only 420 summaries with human ratings. These summaries are generated by 7 different extractive or abstractive summarization systems. Each document-summary pair is evaluated by three human raters in four dimensions (coherence, fluency, informativeness, and relevance). We take the mean score of three raters as the groundtruth human score for each summary. We use these summaries with human ratings as our test data. In order to prevent information leakage in the training process, we select our training data (108,802 document-reference pairs) with no overlapped reference summaries with the test data. It means we do not use any reference summaries in our test data for training. The data statistics are shown in Table 3.
CNN/Daily Mail. This dataset was first proposed by Hermann et al. (2015) using news documents for question answering research and was subsequently extended to the area of summarization by Nallapati et al. (2016). Chaganty et al. (2018) provided human scores for 2,513 references and system-generated summaries in three dimensions (overall, fluency and redundancy). We use 1,996 summaries generated by 4 systems for testing and 10,932 document-reference pairs for training. Similarly, there is no overlap of reference summaries between the training data and test data. Table 3 shows the data statistics of the training data.
For both datasets, in the training data, we randomly selected 95% of sentence-pairs for training and the remaining 5% for validation.
4.3 Baselines
We adopt the following metrics as our baselines. Since this paper focuses on unsupervised approaches, we do not compare with the metrics training with human ratings.
ROUGE. This metric has been the most frequently used automatic metric for summarization evaluation. It evaluates the quality of a summary by comparing it to a human-authored reference. The essence of the comparison is to measure the overlapping units (such as n-gram or word sequences) between the summary and the reference Lin and Och (2004).
METEOR. Proposed by Banerjee and Lavie (2005), this metric evaluates a candidate string by measuring the harmonic mean of unigram-precision and unigram-recall between the candidate string and a reference string.
BERTScore. This metric was proposed by Zhang et al. (2020), it utilizes token-level contextual embeddings generated by a pretrained language model (here we use BERT). The evaluation score is calculated by computing similarity between the embeddings of the summary to evaluate and the reference. The BERTScore includes three metrics (recall), (precision)and (F1 score).
WMS/SMS/S+WMS. Kusner et al. (2015) proposed word mover’s distance (WMD) to calculate the minimum cost of moving a sequence into the other. They treat each sequence as a bag of words and each word is represented by its word embeddings. The WMD can then be transformed into a similarity (WMS) Clark et al. (2019). On the basis of WMS, Clark et al. (2019) (2019) designed to measure the similarity of two sequences by calculating sentence mover’s distance to enhance the ability of evaluating multi-sentence texts. They introduced two metrics: sentence mover’s distance (SMS) and sentence and word mover’s distance (S+WMS). SMS uses sentence embeddings instead of word embeddings and represents each sequence as a bag of sentences and S+WMS combines both sentence and word embeddings and represents each sequence as a bag of both sentences and words.
MoverScore. Also inspired by WMD, Zhao et al. (2019) represented both the reference and the candidate text as a sequence of n-gram embeddings and calculate the WMD between two sequences. We report the result of the best models described in their paper that use a BERT pretrained on MNLI dataset to generate the n-gram embeddings and PMeans as the aggregator.
BERT+Cos+Ref. This metric uses BERT as the encoder and calculates the cosine similarity between the embeddings of the reference and the candidate summary.
BERT+Cos+Doc. This metric is similar to BERT+Cos+Ref, but it measures the similarity between the source document and the candidate summary. This is the only reference-free metric in the baselines.
| Coh. | Flu. | Inf. | Rel. | |
| ROUGE-1 | 0.2446 | 0.1991 | 0.3371 | 0.3028 |
| ROUGE-2 | 0.1133 | 0.0763 | 0.1816 | 0.1385 |
| ROUGE-L | 0.2164 | 0.1736 | 0.3178 | 0.2700 |
| METEOR | 0.3325 | 0.3347 | 0.4424 | 0.4117 |
| BERTScore-R | 0.2355 | 0.2227 | 0.2972 | 0.2787 |
| BERTScore-P | -0.0263 | -0.0221 | -0.0215 | -0.0302 |
| BERTScore-F | 0.1206 | 0.1072 | 0.1681 | 0.1426 |
| WMS | 0.2389 | 0.2355 | 0.3003 | 0.2406 |
| SMS | 0.2394 | 0.2400 | 0.2946 | 0.2401 |
| S+WMS | 0.2433 | 0.2405 | 0.3022 | 0.2432 |
| MoverScore | 0.1458 | 0.1021 | 0.2070 | 0.1724 |
| BERT+Cos+Ref | 0.0452 | 0.0333 | 0.0475 | 0.0534 |
| BERT+Cos+Doc | 0.3998 | 0.3492 | 0.4530 | 0.4279 |
| LS_Score | 0.6390 | 0.5933 | 0.7163 | 0.6563 |
| Overall | Grammar | Redundancy | |
| ROUGE-1 | 0.1953 | 0.0975 | 0.2174 |
| ROUGE-2 | 0.1355 | 0.0701 | 0.1442 |
| ROUGE-L | 0.1925 | 0.0973 | 0.2072 |
| METEOR | 0.0773 | 0.0173 | 0.1147 |
| BERTScore-R | 0.2628 | 0.1721 | 0.2780 |
| BERTScore-P | 0.1754 | 0.1828 | 0.1180 |
| BERTScore-F | 0.2536 | 0.2041 | 0.2348 |
| WMS | 0.1809 | 0.1080 | 0.2274 |
| SMS | 0.1814 | 0.1021 | 0.2313 |
| S+WMS | 0.1830 | 0.1075 | 0.2314 |
| MoverScore | 0.2220 | 0.1522 | 0.2289 |
| BERT+Cos+Doc | 0.1484 | 0.1110 | 0.1237 |
| BERT+Cos+Ref | 0.2130 | 0.1316 | 0.2284 |
| LS_Score | 0.3342 | 0.2664 | 0.2875 |
4.4 Experiment Results
The usual practice of evaluating a summarization evaluation metric is to measure its average summary-level correlation with human judgements, i.e. to measure the correlation between the predicted scores and the human scores across all the test summaries. We evaluate our methods on the aforementioned two datasets. We implemented our final model ( LS_Score with contrastive learning), as we introduced in 3.3. For each dataset, we train our models on the document-reference pairs in the training data, and test on the machine-generated summaries without comparing with reference summaries.
4.4.1 Comparison with Other Methods
The Spearman correlations between different evaluation methods and human evaluation in four dimensions on Newsroom are shown in Table 4. Even though most of baselines are with reference summaries, our reference-free evaluator (LS_Score) still achieves best correlations in all of the different dimensions. By capturing both the semantic quality and semantic quality in the evaluator’s scoring function as well as our negative sampling strategies, our method outperforms other previous metrics a lot in both linguistic dimensions (coherence, fluency) and semantic dimensions (informativeness, relevancy). Especially, it is also superior to another unsupervised reference-free method, BERT+Cos+Doc.
Furthermore, we observe that BERT+Cos+Doc achieves a better overall performance on Newsroom as compared to BERT+Cos+Ref. This is probably due to the short lengths of the summaries on the Newsroom dataset (mostly one sentence). A possible explanation is that the short reference summaries fail to capture all the important information of original documents. As a result, directly comparing with document representations will suffer much less information loss.
Table 5 shows the Spearman correlations on CNN/Daily Mail. As mentioned before, this dataset focuses more on evaluating the linguistic quality of summaries. One interesting comparison is between our model and BERTScore-R. On redundancy BERTScore-R is comparable but its grammar ratings is much worse than ours, which also leads to a worse overall performance.
4.4.2 Ablation Study for Evaluator Selection
We further conduct experiments to show the benefit of using our evaluator. A commonly used BERT-based evaluator is to add a linear regressor to the BERT representations Xenouleas et al. (2019). We implement an evaluator (called BERT+Linear) that also uses a linear regressor to map the BERT embeddings of summaries into a score. We train this evaluator under our contrastive learning framework with the same negative samples, and compare its results with ours. Table 6 and Table 7 show the comparison results, and our model is superior to BERT+Linear a lot in most cases. One thing worth mentioning is that this ablation model already obtained better results than most of the baselines in Table 4 and Table 5, which further demonstrate the power of our contrastive learning framework.
| Coh. | Flu. | Inf. | Rel. | |
| Bert+Linear | 0.4213 | 0.4511 | 0.3075 | 0.3400 |
| LS_Score | 0.6390 | 0.5933 | 0.7163 | 0.6563 |
| Overall | Grammar | Redundancy | |
| Bert+Linear | 0.2711 | 0.2886 | 0.1664 |
| LS_Score | 0.3342 | 0.2664 | 0.2875 |
4.4.3 Cross-dataset Transferability
Although the generated summaries are from documents not included in the training data, we still do experiments to further verify the transferability of our methods by training on one dataset and testing on the other dataset’s test data. The performance of our method trained on CNN/Daily Mail and tested on Newsroom is shown in Table 8, and the one trained on Newsroom and tested on CNN/Daily Mail are presented in Table 9. We call this model LS_Score_cross. For easy comparison, we also take some values in Table 4 and Table 5. As shown in Table 8 and 9, the cross-data training makes the performance of LS_Score_cross slightly lower than the original LS_Score in most cases, but it still outperform all other baselines. This shows that our evaluation method is very flexible to be used. Even trained on different datasets, it can still achieve very good results.
| Coh. | Flu. | Inf. | Rel. | |
| ROUGE-1 | 0.2446 | 0.1991 | 0.3371 | 0.3028 |
| ROUGE-L | 0.2164 | 0.1736 | 0.3178 | 0.2700 |
| BERTScore-R | 0.2355 | 0.2227 | 0.2972 | 0.2787 |
| MoverScore | 0.1458 | 0.1021 | 0.2070 | 0.1724 |
| BERT+Cos+Doc | 0.3998 | 0.3492 | 0.4530 | 0.4279 |
| LS_Score | 0.6390 | 0.5933 | 0.7163 | 0.6563 |
| LS_Score_cross | 0.6271 | 0.5852 | 0.7008 | 0.6381 |
| Overall | Grammar | Redundancy | |
| ROUGE-1 | 0.1953 | 0.0975 | 0.2174 |
| ROUGE-L | 0.1925 | 0.0973 | 0.2072 |
| BERTScore-R | 0.2628 | 0.1721 | 0.2780 |
| MoverScore | 0.2220 | 0.1522 | 0.2289 |
| BERT+Cos+Doc | 0.1484 | 0.1110 | 0.1237 |
| LS_Score | 0.3342 | 0.2664 | 0.2875 |
| LS_Score_cross | 0.2874 | 0.1915 | 0.2881 |
5 Conclusion
In this paper, we propose a new evaluation method in the field of text summarization. We found that the quality of a summary can be evaluated in two separate dimensions: semantic quality and linguistic quality. Since human-authored references used in most of the existing metrics are costly, we investigate automatic evaluation metrics in an unsupervised reference-free setting. Leveraging powerful representations of BERT, our methods achieve the highest performance on two datasets. Although our experiments are only on single-document summarization datasets, our method can also be also extended to evaluation of multi-document summarization with slight changes, especially in the part of semantic quality evaluation.
References
- Banerjee and Lavie (2005) Satanjeev Banerjee and Alon Lavie. 2005. METEOR: An automatic metric for mt evaluation with improved correlation with human judgments. In Proceedings of the acl workshop on intrinsic and extrinsic evaluation measures for machine translation and/or summarization, pages 65–72.
- Böhm et al. (2019) Florian Böhm, Yang Gao, Christian M Meyer, Ori Shapira, Ido Dagan, and Iryna Gurevych. 2019. Better rewards yield better summaries: Learning to summarise without references. In Proceedings of the 2019 Conference on Empirical Methods in Natural Language Processing and the 9th International Joint Conference on Natural Language Processing (EMNLP-IJCNLP), pages 3101–3111.
- Chaganty et al. (2018) Arun Chaganty, Stephen Mussmann, and Percy Liang. 2018. The price of debiasing automatic metrics in natural language evalaution. In Proceedings of the 56th Annual Meeting of the Association for Computational Linguistics (Volume 1: Long Papers), pages 643–653.
- Chen et al. (2018) Ping Chen, Fei Wu, Tong Wang, and Wei Ding. 2018. A semantic QA-based approach for text summarization evaluation. In AAAI.
- Chen et al. (2020) Yu Chen, Lingfei Wu, and Mohammed J Zaki. 2020. Reinforcement learning based graph-to-sequence model for natural question generation. In International Conference on Learning Representations.
- Clark et al. (2019) Elizabeth Clark, Asli Celikyilmaz, and Noah A. Smith. 2019. Sentence mover’s similarity: Automatic evaluation for multi-sentence texts. In Proceedings of the 57th Annual Meeting of the Association for Computational Linguistics, pages 2748–2760.
- Devlin et al. (2019) Jacob Devlin, Ming-Wei Chang, Kenton Lee, and Kristina Toutanova. 2019. BERT: Pre-training of deep bidirectional transformers for language understanding. In Proceedings of the 2019 Conference of the North American Chapter of the Association for Computational Linguistics: Human Language Technologies, Volume 1 (Long and Short Papers), pages 4171–4186.
- Gao et al. (2020) Yang Gao, Wei Zhao, and Steffen Eger. 2020. SUPERT: Towards new frontiers in unsupervised evaluation metrics for multi-document summarization. Proceedings of the 58th Annual Meeting of the Association for Computational Linguistics.
- Grusky et al. (2018) Max Grusky, Mor Naaman, and Yoav Artzi. 2018. Newsroom: A dataset of 1.3 million summaries with diverse extractive strategies. In Proceedings of the 2018 Conference of the North American Chapter of the Association for Computational Linguistics: Human Language Technologies, Volume 1 (Long Papers), pages 708–719.
- Hermann et al. (2015) Karl Moritz Hermann, Tomas Kocisky, Edward Grefenstette, Lasse Espeholt, Will Kay, Mustafa Suleyman, and Phil Blunsom. 2015. Teaching machines to read and comprehend. In Advances in neural information processing systems, pages 1693–1701.
- Huang et al. (2020) Luyang Huang, Lingfei Wu, and Lu Wang. 2020. Knowledge graph-augmented abstractive summarization with semantic-driven cloze reward. In Proceedings of the 58th Annual Meeting of the Association for Computational Linguistics, pages 5094–5107.
- Kané et al. (2020) Hassan Kané, Muhammed Yusuf Kocyigit, Ali Abdalla, Pelkins Ajanoh, and Mohamed Coulibali. 2020. NUBIA: Neural based interchangeability assessor for text generation. ArXiv, abs/2004.14667.
- Kusner et al. (2015) Matt J. Kusner, Yu Sun, Nicholas I. Kolkin, and Kilian Q. Weinberger. 2015. From word embeddings to document distances. In Proceedings of the 32nd International Conference on International Conference on Machine Learning - Volume 37, ICML’15, page 957–966. JMLR.org.
- LeClair et al. (2020) Alexander LeClair, Sakib Haque, Linfgei Wu, and Collin McMillan. 2020. Improved code summarization via a graph neural network. arXiv preprint arXiv:2004.02843.
- Lin and Och (2004) Chin-Yew Lin and FJ Och. 2004. Looking for a few good metrics: ROUGE and its evaluation. In NTCIR Workshop.
- Louis and Nenkova (2013) Annie Louis and Ani Nenkova. 2013. Automatically assessing machine summary content without a gold standard. Computational Linguistics, 39(2):267–300.
- Nallapati et al. (2016) Ramesh Nallapati, Bowen Zhou, Cicero dos Santos, Caglar Gulcehre, and Bing Xiang. 2016. Abstractive text summarization using sequence-to-sequence rnns and beyond. In Proceedings of The 20th SIGNLL Conference on Computational Natural Language Learning, pages 280–290.
- Novikova et al. (2017) Jekaterina Novikova, Ondej Duek, Amanda Cercas Curry, and Verena Rieser. 2017. Why we need new evaluation metrics for NLG. In Proceedings of the 2017 Conference on Empirical Methods in Natural Language Processing.
- Papineni et al. (2002) Kishore Papineni, Salim Roukos, Todd Ward, and Wei-Jing Zhu. 2002. BLEU: a method for automatic evaluation of machine translation. In Proceedings of the 40th annual meeting on association for computational linguistics, pages 311–318. Association for Computational Linguistics.
- Peters et al. (2018) Matthew E Peters, Mark Neumann, Mohit Iyyer, Matt Gardner, Christopher Clark, Kenton Lee, and Luke Zettlemoyer. 2018. Deep contextualized word representations. In Proceedings of NAACL-HLT, pages 2227–2237.
- Peyrard et al. (2017) Maxime Peyrard, Teresa Botschen, and Iryna Gurevych. 2017. Learning to score system summaries for better content selection evaluation. In Proceedings of the Workshop on New Frontiers in Summarization, pages 74–84.
- Peyrard and Gurevych (2018) Maxime Peyrard and Iryna Gurevych. 2018. Objective function learning to match human judgements for optimization-based summarization. In Proceedings of the 2018 Conference of the North American Chapter of the Association for Computational Linguistics: Human Language Technologies, Volume 2 (Short Papers), pages 654–660.
- Sharma et al. (2019) Eva Sharma, Luyang Huang, Zhe Hu, and Lu Wang. 2019. An entity-driven framework for abstractive summarization. In Proceedings of the 2019 Conference on Empirical Methods in Natural Language Processing and the 9th International Joint Conference on Natural Language Processing (EMNLP-IJCNLP), pages 3271–3282.
- Shimanaka et al. (2018) Hiroki Shimanaka, Tomoyuki Kajiwara, and Mamoru Komachi. 2018. RUSE: Regressor using sentence embeddings for automatic machine translation evaluation. In Proceedings of the Third Conference on Machine Translation: Shared Task Papers, pages 751–758.
- Sun and Nenkova (2019) Simeng Sun and Ani Nenkova. 2019. The feasibility of embedding based automatic evaluation for single document summarization. In Proceedings of the 2019 Conference on Empirical Methods in Natural Language Processing and the 9th International Joint Conference on Natural Language Processing (EMNLP-IJCNLP), pages 1216–1221.
- Xenouleas et al. (2019) Stratos Xenouleas, Prodromos Malakasiotis, Marianna Apidianaki, and Ion Androutsopoulos. 2019. SUM-QE: a BERT-based summary quality estimation model. In Proceedings of the 2019 Conference on Empirical Methods in Natural Language Processing and the 9th International Joint Conference on Natural Language Processing (EMNLP-IJCNLP).
- Zhang et al. (2020) Tianyi Zhang, Varsha Kishore, Felix Wu, Kilian Q Weinberger, and Yoav Artzi. 2020. BERTScore: Evaluating text generation with BERT. In International Conference on Learning Representations.
- Zhao et al. (2019) Wei Zhao, Maxime Peyrard, Fei Liu, Yang Gao, Christian M Meyer, and Steffen Eger. 2019. Moverscore: Text generation evaluating with contextualized embeddings and earth mover distance. In Proceedings of the 2019 Conference on Empirical Methods in Natural Language Processing and the 9th International Joint Conference on Natural Language Processing (EMNLP-IJCNLP), pages 563–578.
- Zhou and Xu (2020) Wangchunshu Zhou and Ke Xu. 2020. Learning to compare for better training and evaluation of open domain natural language generation models. AAAI.