UU-Mamba: Uncertainty-aware U-Mamba for Cardiovascular Segmentation
Abstract
Building on the success of deep learning models in cardiovascular structure segmentation, increasing attention has been focused on improving generalization and robustness, particularly in small, annotated datasets. Despite recent advancements, current approaches often face challenges such as overfitting and accuracy limitations, largely due to their reliance on large datasets and narrow optimization techniques. This paper introduces the UU-Mamba model, an extension of the U-Mamba architecture, designed to address these challenges in both cardiac and vascular segmentation. By incorporating Sharpness-Aware Minimization (SAM), the model enhances generalization by targeting flatter minima in the loss landscape. Additionally, we propose an uncertainty-aware loss function that combines region-based, distribution-based, and pixel-based components to improve segmentation accuracy by capturing both local and global features. While the UU-Mamba model has already demonstrated great performance, further testing is required to fully assess its generalization and robustness. We expand our evaluation by conducting new trials on the ImageCAS (coronary artery) and Aorta (aortic branches and zones) datasets, which present more complex segmentation challenges than the ACDC dataset (left and right ventricles) used in our previous work, showcasing the model’s adaptability and resilience. We confirm UU-Mamba’s superior performance over leading models such as TransUNet, Swin-Unet, nnUNet, and nnFormer. Moreover, we provide a more comprehensive evaluation of the model’s robustness and segmentation accuracy, as demonstrated by extensive experiments. The code can be accessed at https://github.com/tiffany9056/UU-Mamba.
keywords:
Cardiovascular Image Segmentation , Mamba , Uncertainty-Aware Loss , Sharpness-Aware Minimization[1] organization=University at Albany, State University of New York, city=Albany, postcode=NY 12222, country=USA
[2] organization=Purdue University, city=West Lafayette, postcode=IN 47907, country=USA
[3] organization=Harvard Medical School, city=Boston, postcode=MA 02115, country=USA
[4] organization=Beth Israel Deaconess Medical Center, city=Boston, postcode=MA 02215, country=USA
[5] organization=University of North Carolina at Chapel Hill, city=Chapel Hill, postcode=NC 27599, country=USA
1 Introduction
Biomedical image segmentation is crucial for medical image analysis, enabling the precise identification and delineation of anatomical structures and abnormalities [1]. Segmentation of cardiovascular structures, such as the heart, aorta, and coronary arteries, from Magnetic Resonance Imaging (MRI) and Computed Tomography (CT) is essential for diagnosing a wide range of cardiovascular conditions, developing treatment plans, and evaluating therapeutic outcomes [2, 3]. Both MRI and CT provide high-resolution images that offer detailed insights into the structure, function, and composition of these cardiovascular regions. However, manually segmenting these structures is time-consuming, labor-intensive, and prone to observer variability, underscoring the importance of automated segmentation techniques to ensure consistency and improve efficiency [4, 5].
The variability in cardiovascular anatomy, pathological changes, and the presence of imaging artifacts present significant challenges to segmenting both MRI and CT images [6]. Conventional techniques like thresholding and edge detection often fail to accurately capture the complex morphology of the heart, aorta, and coronary arteries. Recent advancements in machine learning, particularly through Convolutional Neural Networks (CNNs) [7] and other deep learning models, have shown potential in overcoming these challenges by learning intricate patterns from large datasets [8]. However, these models often require extensive computational resources and large annotated datasets, and their ability to generalize across diverse patient populations and imaging conditions may be limited [3].
To improve the generalizability and accuracy of segmentation across different cardiovascular structures, various specialized datasets have been developed. For example, the Automated Cardiac Diagnosis Challenge (ACDC) dataset [2] is designed for segmenting cardiac structures such as the left and right ventricles and myocardium from MRI. The ImageCAS dataset [9] focuses on the segmentation of coronary arteries, which is crucial for assessing coronary artery disease. The Aorta dataset [10, 11] is specifically aimed at segmenting the aorta and its branches, facilitating the diagnosis of conditions like aortic aneurysms and dissections. These datasets provide diverse challenges that contribute to the development of more robust and accurate segmentation algorithms.
In this paper, we tackle these challenges by introducing the UU-Mamba model, an enhanced version of the U-Mamba model [12]. The UU-Mamba model incorporates a novel uncertainty-aware loss function alongside the Sharpness-Aware Minimization (SAM) optimizer [13], improving both training stability and performance. Our uncertainty-aware loss function is built upon three key components inspired by a survey of various loss functions for semantic segmentation tasks [14]:
-
•
Region-based loss: This component is utilized for object detection and localization, such as the dice loss [15].
-
•
Distribution-based loss: This component compares the predicted distributions with the ground truth, typically using cross-entropy loss [16].
-
•
Pixel-based loss: This component measures differences at the pixel level, employing techniques such as focal loss [17].
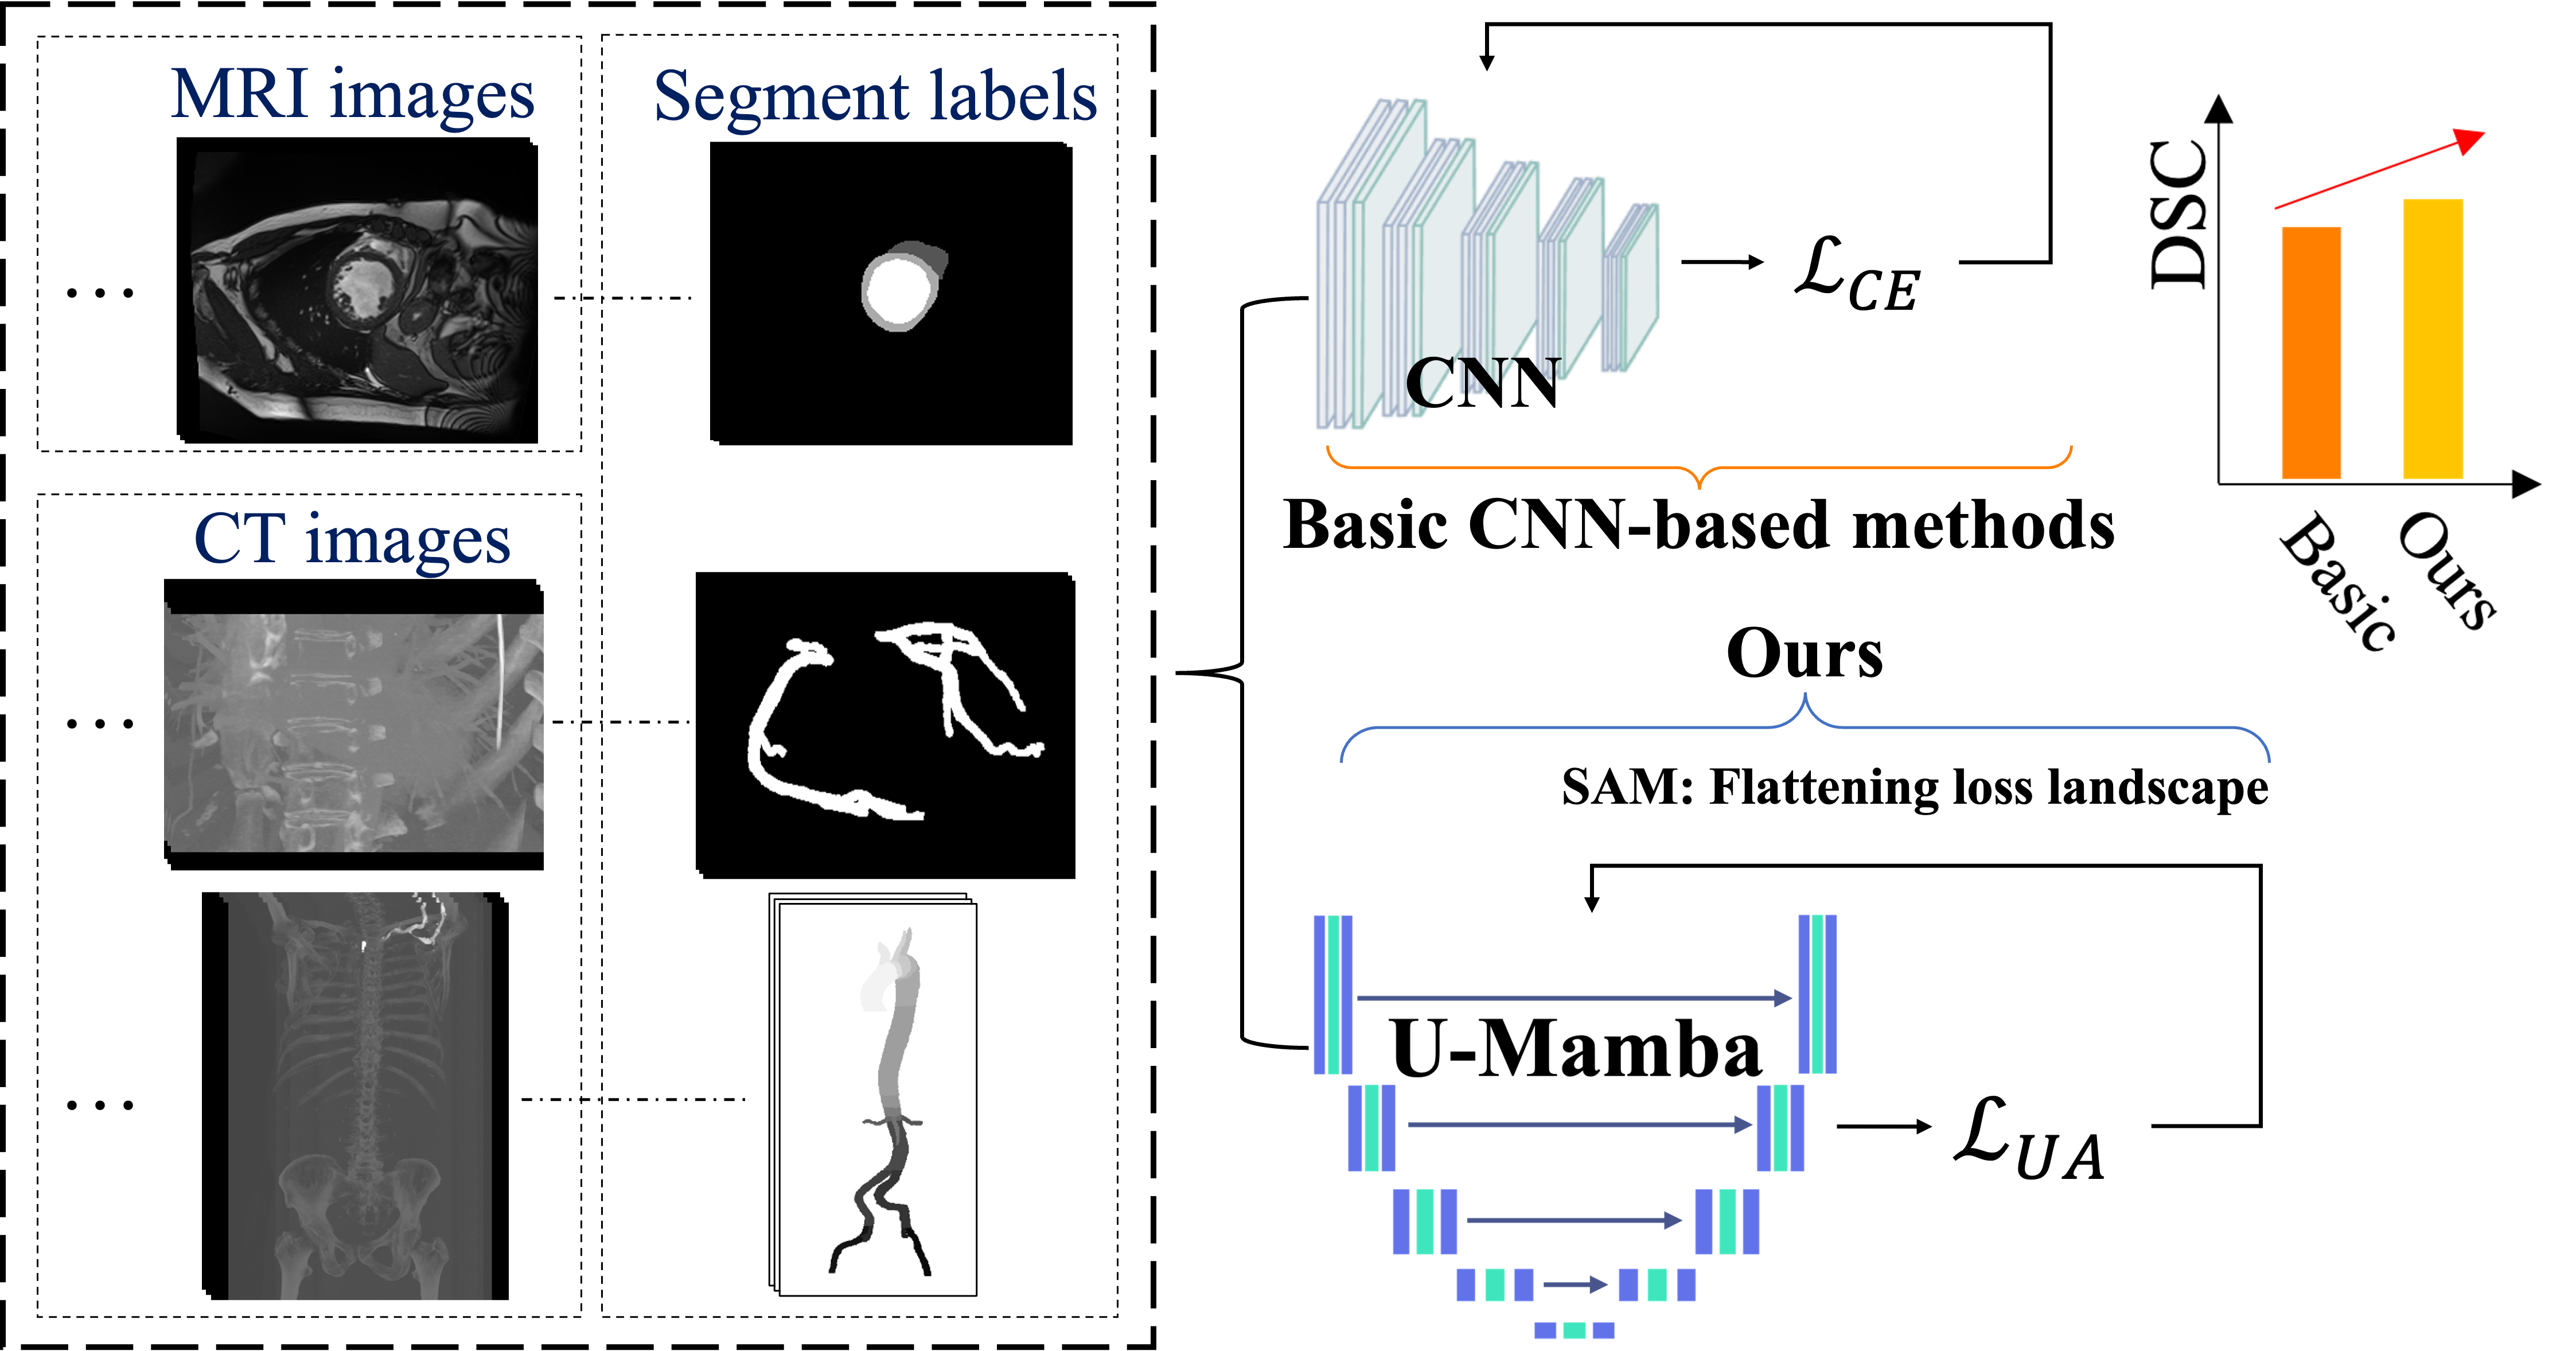
Instead of fixed weights, our model can dynamically modify the contribution of each loss component in accordance with the uncertainty of each prediction by employing auto-learnable weights [18]. This enables the model to prioritize predictions that are certain while simultaneously reducing the impact of ambiguous or noisy data. The auto-learnable weights allow the model to adaptively balance various aspects of the segmentation task, resulting in enhanced overall performance and robustness, particularly in mitigating challenges such as class imbalance [19]. The Sharpness-Aware Minimization (SAM) optimizer [13] is implemented to further improve the generalization capability of our model. SAM assists in the identification of parameter values that generate flat minima within the loss landscape, thereby enhancing the model’s generalizability [20, 21, 22, 23] and mitigating the risk of overfitting—a prevalent obstacle in deep learning applications for medical imaging [24]. Figure 1 presents a comparison of our method against existing approaches.
This paper extends our previous work by introducing the UU-Mamba model [25] for cardiac and vascular image segmentation. The following key aspects distinguish this work:
-
1.
We extend the application of the UU-Mamba model from our previous work, which originally focused on cardiac segmentation, to now include vascular segmentation across multiple datasets. While the core model remains the same, we have enhanced its functionality to address the specific challenges of both cardiac and vascular segmentation. This extension demonstrates the model’s versatility and improved performance across a broader range of medical imaging tasks.
-
2.
We present new and extensive results on the ImageCAS [9] and Aorta [10, 11] datasets, which were not included in our earlier work. These datasets differ not only in their imaging characteristics but also in the number of labels—while the ACDC dataset [2] used in our previous work involves only three labels, the Aorta dataset introduces a more complex scenario with 24 labels. This demonstrates the adaptability and robustness of our model to datasets with varying complexities.
-
3.
To provide a more comprehensive evaluation compared to our previous work, where we used only the Dice Similarity Coefficient (DSC) and Mean Squared Error (MSE), we now also incorporate the Normalized Surface Dice (NSD) [26] and an analysis of the 3D loss landscape [27]. These combined evaluations—DSC, MSE, NSD, and 3D loss landscape—enhance our comparison and provide a more comprehensive understanding of the model’s ability to manage intricate medical imaging tasks.
2 Related Work
2.1 Cardiovascular Segmentation
The development of deep learning techniques, particularly Convolutional Neural Networks (CNNs) [7], has significantly advanced cardiovascular segmentation [28, 29], driven by comprehensive datasets like ACDC [2], ImageCAS [9], and Aorta [10, 11]. These datasets address a range of cardiovascular structures, including heart chambers, coronary arteries, and aortic branches, and present challenges related to anatomical variability and disease-specific characteristics. Multi-modality cardiac imaging segmentation, which utilizes imaging modalities like Positron Emission Tomography (PET), Single Photon Emission Computed Tomography (SPECT), MRI, and CT, aims to precisely segment anatomical structures and pathological regions. However, inherent challenges such as phase alignment, resolution, and image quality imbalances complicate the process. Traditional methods, including registration-based segmentation with multi-atlas approaches, and fusion-based segmentation techniques, address these issues by combining information across modalities [30, 31, 32, 33], but these methods are computationally expensive and often require large datasets [34, 35]. Hybrid approaches, combining both traditional and deep learning methods, are emerging to improve the robustness and clinical applicability of cardiovascular segmentation [36].
Recent advances in deep learning have improved segmentation accuracy by enabling complex representations of cardiovascular structures. For instance, CNNs like U-Net [37, 38] and its variants have been effective for cardiovascular segmentation tasks, particularly on the ACDC dataset [2]. However, these methods are prone to overfitting and issues such as class imbalance, which complicates their application across diverse datasets like ImageCAS [9] and Aorta [10, 11]. Zeng et al. [9] tackled coronary artery segmentation challenges in ImageCAS, utilizing multi-scale feature extraction to capture finer details, but the method still struggles with arteries exhibiting atypical morphology, requiring precise hyperparameter tuning.
The Aorta dataset [10, 11] focuses on segmenting the aorta and its branches, where varying aortic diameters and pathologies like aneurysms present additional complexities. Imran et al. [10] proposed the CIS-UNet, a hybrid model incorporating Context-Aware Shifted Window Self-Attention mechanisms to address spatial variability in aortic structures, though its performance remains sensitive to imaging quality and resolution. To further improve segmentation, some studies have integrated CNNs with attention mechanisms and multi-scale processing. For example, Hu et al. [39] adapted the Segment Anything Model to medical images, incorporating multi-scale processing and CNN heads for enhanced segmentation across various datasets.
A key development in segmentation accuracy came from Isensee et al. [37], who combined U-Net and V-Net architectures in the nnUNet framework [37]. While this method has proven effective, it heavily depends on extensive annotated datasets, limiting its applicability in scenarios with scarce labeled data—a frequent issue in cardiovascular imaging. To address this, transfer learning has been employed, as demonstrated by Chen et al. [33], who pre-trained models on the ACDC dataset and fine-tuned them on smaller, less-annotated datasets. Despite improving performance, transfer learning remains susceptible to domain shift issues, particularly when applied to datasets like ImageCAS and Aorta with differing data distributions.
Standard segmentation methods often rely on basic loss functions like Cross-Entropy loss, which struggle to effectively manage class imbalance or capture the finer details necessary for accurate segmentation. Recent research highlights the need to optimize for flatter minima in the loss landscape to enhance model generalization. Caldarola et al. [40] demonstrated that such optimization improves model robustness and generalization, especially when dealing with noisy or ambiguous data, which is essential for reliable cardiovascular segmentation across diverse clinical scenarios.
2.2 Mamba for Medical Image Segmentation
The Mamba architecture [41] represents a substantial advancement in medical image segmentation by integrating the capabilities of Vision Transformers (ViTs) [42] and Convolutional Neural Networks (CNNs) [7]. It is essential to achieve precision in medical imaging duties by integrating global contextual information and managing long sequences [43]. U-Mamba [12] expands the conventional U-Net framework [37, 38] by integrating attention mechanisms and multi-scale processing, thereby improving the accuracy and robustness of segmentation. This is achieved by building upon this foundation. This method enables the model to concentrate on pertinent details within intricate anatomical structures and efficiently process information across a range of scales, from a broad contextual understanding to precise low-level details. Furthermore, U-Mamba incorporates deep supervision, which expedites training and enhances convergence, rendering it both efficient and dependable for clinical applications that require rapid and precise image processing. The Mamba architecture’s adaptability is further underscored by specialized variants such as Weak-Mamba-UNet [44], which are able to handle intricate scenarios with improved performance and excel in scribble-based segmentation tasks. In conclusion, models that are based on U-Mamba exhibit superior segmentation performance in a variety of medical applications, such as histopathological imaging and cardiac MRI.
The Mamba architecture’s computational efficacy is one of its major advantages, as it is the result of the strategic integration of CNNs [7] and ViTs [42]. This hybrid design capitalizes on the advantages of both architectures: ViTs’ global attention mechanisms facilitate the efficient management of intricate spatial relationships and long-range dependencies, while CNNs are adept at extracting local features with minimal computational overhead. Mamba reduces the computational burden that is typically associated with pure transformer-based models, which are resource-intensive due to their quadratic complexity in relation to the duration of the input sequence, by combining these two approaches. The hierarchical design of Mamba further improves its computational efficacy. The model is capable of processing images at various scales, enabling it to capture critical features at lower resolutions and subsequently refine these details at higher resolutions. By concentrating processing capacity in the most critical areas, this multi-scale approach minimizes the total number of computations, as opposed to implementing a uniform computation across all pixels.
Furthermore, Mamba employs efficient attention mechanisms and sparse operations to minimize the number of operations necessary for each layer. This optimization is especially advantageous in the segmentation of medical images, as the computational costs associated with high-resolution images can be prohibitive rapidly. The computational efficiency of U-Mamba is also enhanced by the deep supervision strategy, which facilitates quicker convergence during the training process. This implies that the computational resources required are further reduced by the necessity of fewer training epochs to attain high performance. Overall, the Mamba architecture optimizes the strengths of both CNNs [7] and ViTs [42] while minimizing computational demands, thereby achieving a balance between precision and efficiency. Thus, it is particularly well-suited for clinical applications that prioritize both accuracy and rapidity.
2.3 Sharpness-Aware Minimization for Medical Image Segmentation
Sharpness-Aware Minimization (SAM) [13] has gained substantial attention for its capacity to enhance the generalization of deep learning models by optimizing both the training loss and the sharpness of the loss landscape. This method has been particularly advantageous in the field of medical image segmentation, where the ability to accurately detect boundaries and generalize them across a variety of datasets is essential.
SAM has exhibited significant enhancements in model robustness and accuracy within the context of medical image segmentation. For instance, Mariam et al. [45] implemented SAM in the RF-UNet model to segment retinal vessels. In addition to enhanced metrics such as accuracy, sensitivity, and specificity, their experiments on the DRIVE dataset demonstrated a substantial decrease in both training and validation losses. This emphasizes SAM’s capacity to improve generalization and mitigate overfitting in retinal segmentation tasks.
Additional research has investigated sophisticated variations of SAM for the purpose of medical segmentation. In the context of breast ultrasound image segmentation, Hassan et al. [46] assessed a variety of sharpness-based optimizers, such as SAM. Their results suggested that SAM consistently enhanced generalization across various models, surpassing other sharpness-based optimizers such as Adaptive SAM.
Random Sharpness-Aware Minimization (RSAM) by Liu et al. [47] is another innovation in SAM that incorporates randomness to enhance the efficiency and stability of SAM optimization. RSAM’s potential for improved generalization across domains suggests that it has the potential to be effective in medical imaging, despite the fact that it has not yet been explicitly applied to medical segmentation. Li et al. [48] also proposed Friendly SAM (FSAM), which further optimizes SAM for improved performance in diverse and complex data environments. This direction could be highly relevant to medical segmentation.
Collectively, these studies demonstrate that SAM [13] and its variants are essential for the advancement of medical image segmentation, particularly in tasks that necessitate high precision and robustness, such as retinal vessel extraction, breast ultrasound segmentation, and other medical imaging challenges. The integration of SAM into medical segmentation models is expected to result in even greater improvements in generalization and performance as SAM continues to develop. The notion that SAM is the most dependable sharpness-based method in medical image analysis was further substantiated by this study.
3 Method
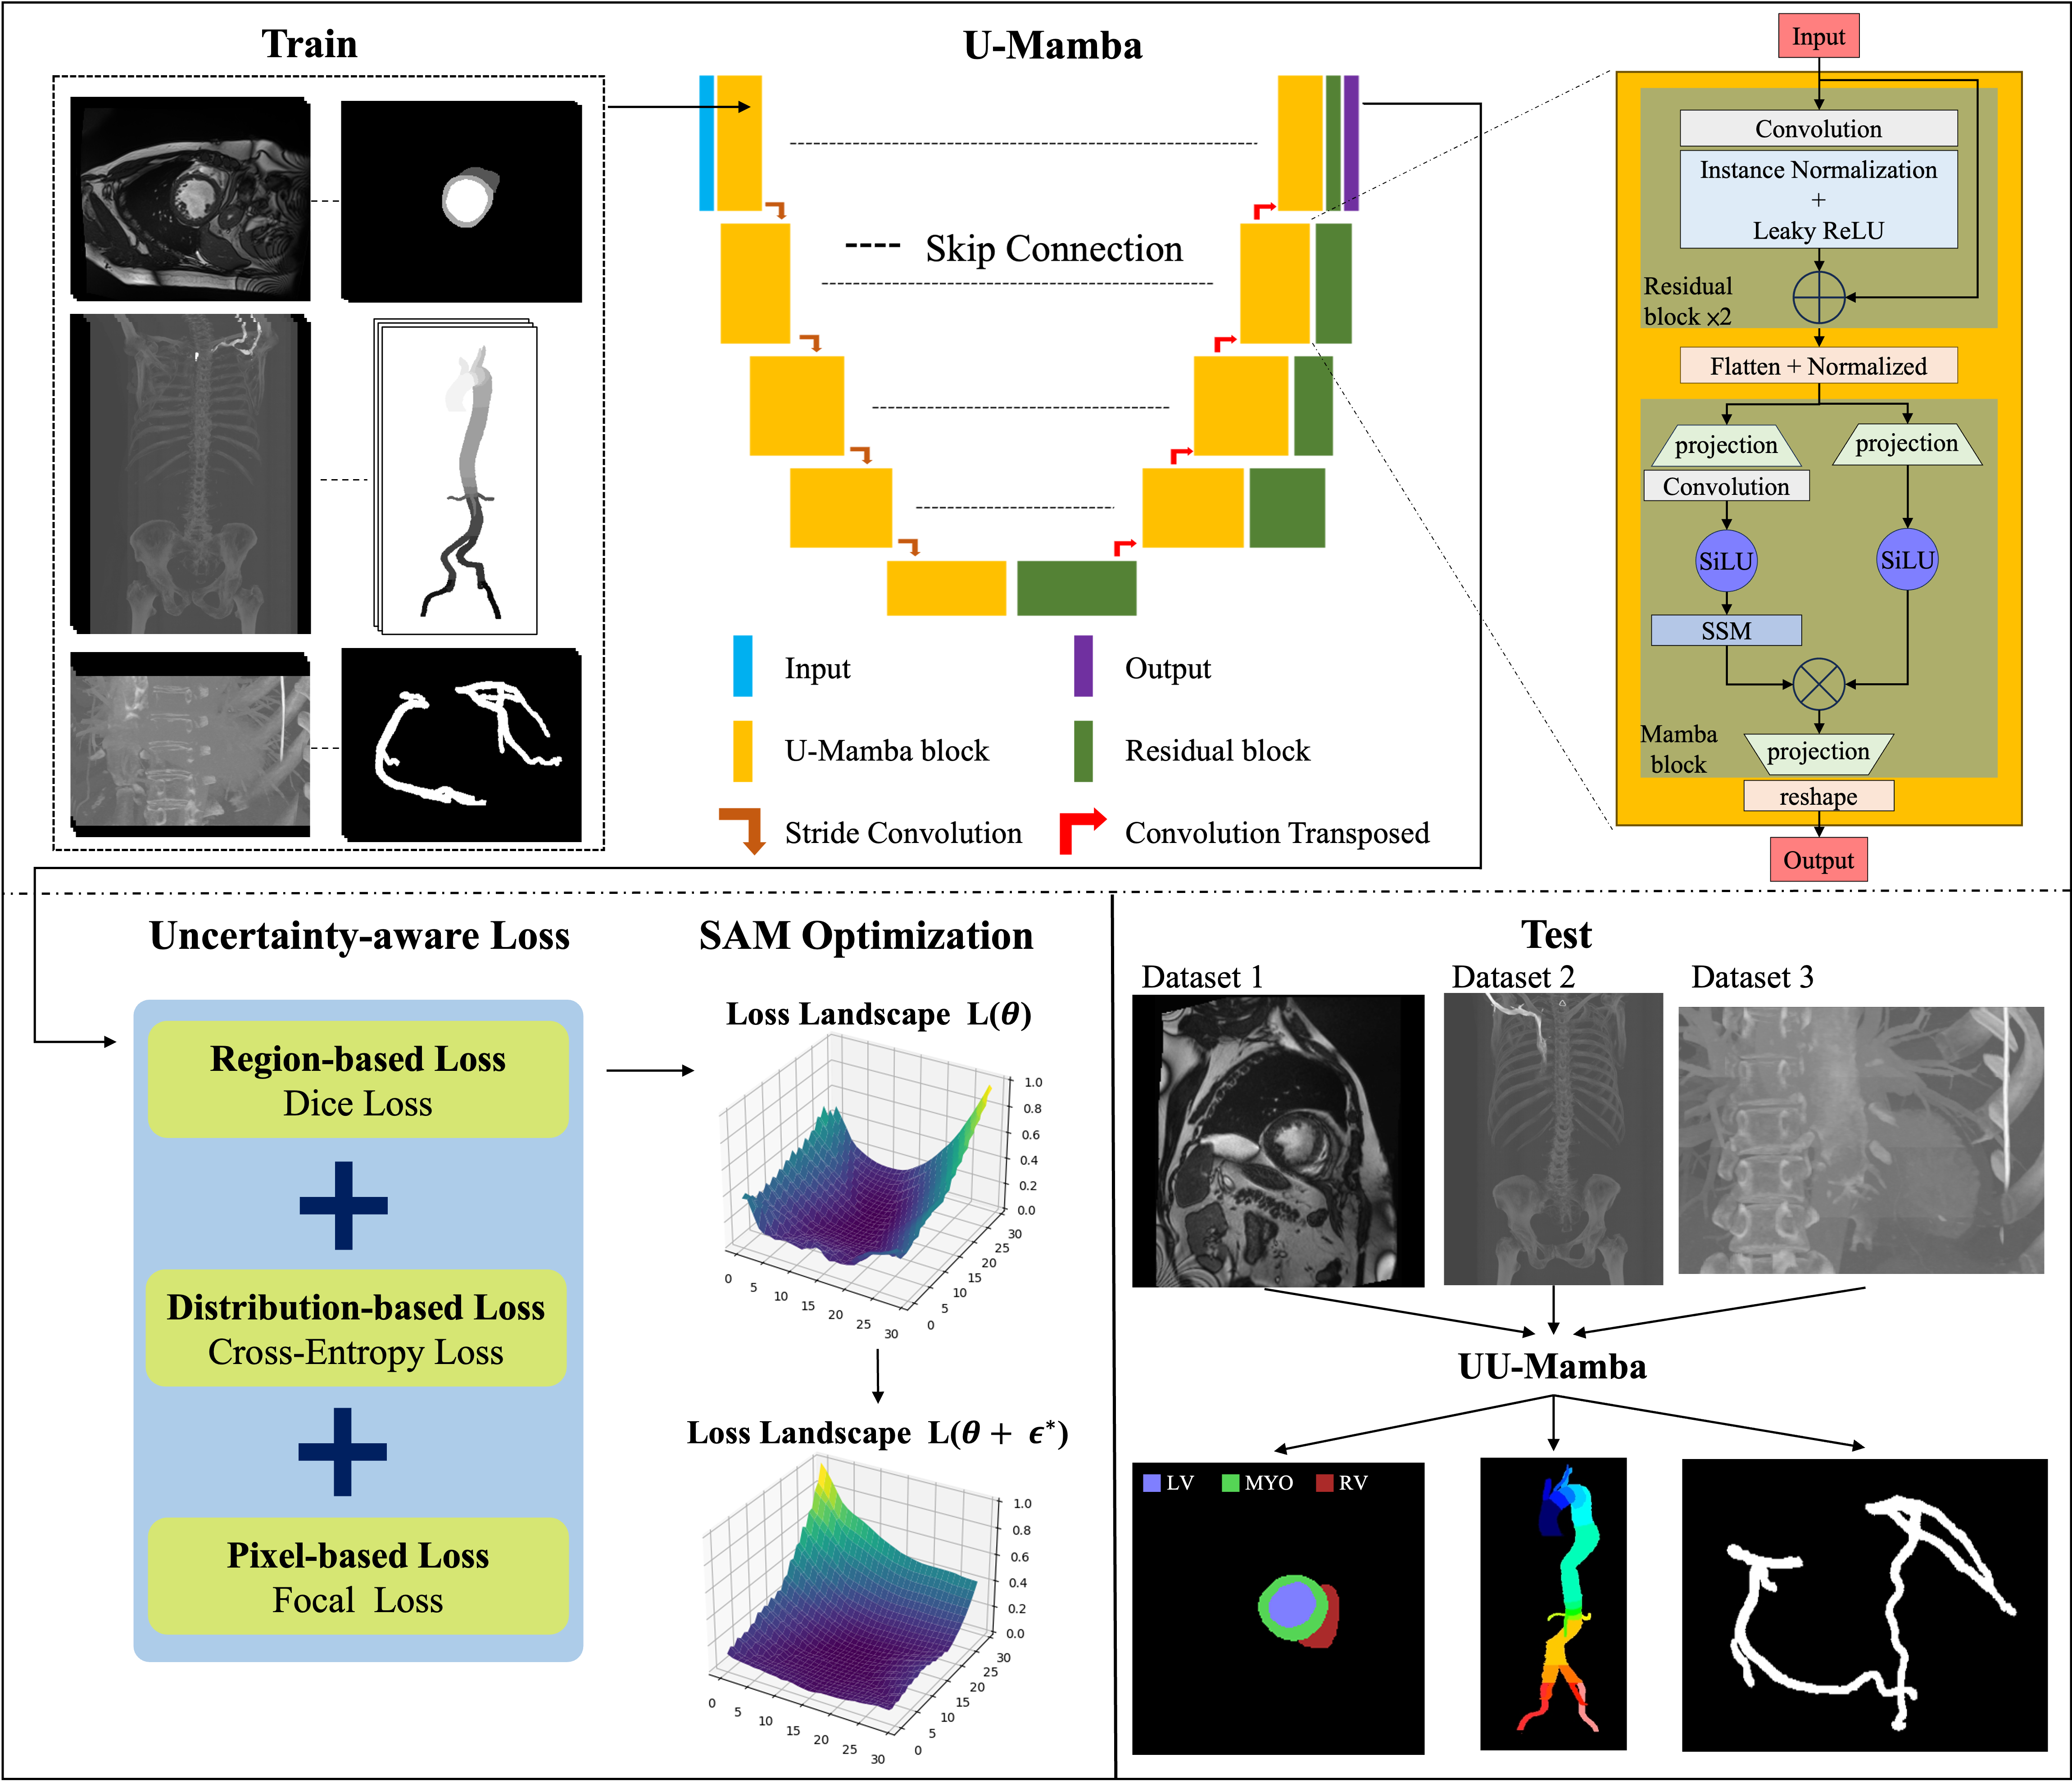
Figure 1 presents a comparison of our method against basic approaches, highlighting the advancements made by our UU-Mamba model. Figure 2 illustrates our proposed UU-Mamba architecture, showcasing improvements in the training process. This model builds upon the foundational U-Mamba structure, where input images are effectively encoded. A key innovation in our approach is the integration of a novel uncertainty-aware loss function, designed to better capture and manage the inherent uncertainties in the segmentation task. To further enhance model performance, we employ the Sharpness-Aware Minimization (SAM) optimizer [13]. This optimizer is particularly well-suited for our architecture as it operates within a flattened loss landscape, which helps in achieving more robust and generalized training outcomes. These enhancements make UU-Mamba a more effective and adaptable model for both cardiac and vascular segmentation tasks. Section 3.1 discusses the Mamba block and the U-Mamba network, with a focus on the integration of state space models and their effectiveness in capturing long-range dependencies. In Section 3.2, we introduce our uncertainty-aware loss, detailing how it combines multiple loss functions to boost model performance and robustness. Finally, Section 3.3 covers the Sharpness Aware Minimization Optimization, emphasizing its advantages in achieving flat minima in the loss landscape, thereby enhancing generalization and mitigating overfitting.
3.1 Mamba Block and U-Mamba Network
The U-Mamba network is designed to improve the accuracy of medical image segmentation and improve global context comprehension by combining the assets of the Mamba block [41] and U-Net [37, 38]. The Mamba block, which is specifically engineered for Selective Structured State Space Sequence Models (S6), is particularly well-suited for medical imaging duties due to its exceptional ability to manage long-range dependencies and sequential information.
State Space Models (SSM) [49] describe systems in terms of their internal states and observations over time, thereby facilitating effective sequence modeling through these underlying states. The fundamental form is denoted as follows: is the input state vector, is the control input, is the process noise, is the state transition matrix, and is the control input matrix.
| (1) |
For observation , calculated using the observation matrix , feedthrough matrix , and observation noise , the formula is:
| (2) |
The S6 architecture advances traditional state space models by integrating selective attention mechanisms and structured parameterization. The selective attention mechanism can be represented as:
| (3) |
where , , and are the query, key, and value matrices that are derived from the state vector , and is the dimension of the key vectors. This mechanism enables the model to effectively capture intricate dependencies by concentrating on pertinent components of the input sequence.
The integration of S6 into the Mamba block is especially crucial for sequential medical image processing tasks, such as cardiac MRI segmentation, which require the capture of temporal dynamics and structure [41]. The method, on the other hand, is exclusively concerned with per-image segmentation, which involves the application of the state transition and observation matrices (, , etc.) to individual images. Each image is treated independently.
U-Mamba capitalizes on Mamba’s linear scaling advantage to improve CNNs’ capacity to simulate long-range dependencies, all while circumventing the high computational costs associated with self-attention mechanisms employed in Transformers [50] such as ViT [42] and SwinTransformer [51]. The U-Mamba block, which is comprised of two sequential residual blocks followed by a Mamba block, is depicted in Figure 2.
Additionally, each block includes Leaky ReLU activation, Instance Normalization, and convolutional layers. Mamba blocks with two parallel branches: one with an SSM layer and one without, flatten, transpose, normalize, and process image features. The Hadamard product is then employed to merge these features, which are subsequently projected back to their original shape and transposed.
An encoder with these blocks is included in the complete U-Mamba network architecture to capture both local features and long-range dependencies, while a decoder composed of residual blocks and transposed convolutions is used to recover detailed local information and resolution. Skip connections are used to connect hierarchical features from the encoder to the decoder. The final decoder output is processed through a 111 convolutional layer and a Softmax layer to generate the final segmentation probability map.
3.2 Uncertainty-aware Loss
Introducing uncertainty into loss functions entails allocating weights to distinct components of the loss according to the estimated uncertainty for each data point [52, 53]. This method allows the model to concentrate on learning from more dependable instances while simultaneously reducing the impact of potentially erroneous or ambiguous data. Kendall and Gal introduced the concept of adjusting loss functions by utilizing homoscedastic and heteroscedastic uncertainty [54]. Heteroscedastic uncertainty fluctuates between instances, while homoscedastic uncertainty remains constant across all data points. The model can improve its resilience and precision by focusing on confident predictions and reducing the impact of equivocal ones by adapting its learning process to capitalize on these uncertainties. This optimization enhances overall performance and improves the training process across diverse datasets [55, 56, 57].
To further boost segmentation accuracy, we employ an uncertainty-aware loss function that combines region-based, distribution-based, and pixel-based losses, capitalizing on their complementary strengths:
-
1.
Dice loss [15]: This region-based metric emphasizes the overlap between predicted and ground truth areas, ensuring accurate preservation of shape and boundary details in segmented regions.
-
2.
Cross-Entropy (CE) loss [16]: This distribution-based loss ensures precise categorization of individual pixels, thereby improving classification accuracy.
- 3.
Let denote the predicted probability and the ground truth label, with the predicted segmentation and the corresponding ground truth mask. The Dice Similarity Coefficient (DSC) is a metric that quantifies the degree of overlap between the predicted segmentation and the ground truth. It is defined as follows:
| (4) |
DSC values range from 0 to 1, with 1 signifying complete overlap between the prediction and the ground truth and 0 indicating no overlap.
The Dice loss is defined as: in order to integrate this metric into a loss function for training segmentation models.
| (5) |
The Dice loss is designed to minimize the discrepancy between the predicted segmentation and the ground truth by optimizing the DSC. The model is trained to generate segmentations that exhibit a greater overlap with the ground truth by minimizing the Dice loss, thereby enhancing the accuracy of the segmentation.
The standard entropy formula is employed to determine the Cross-Entropy (CE) loss:
| (6) |
To address class imbalance, we utilize the Focal loss, which focuses more on difficult-to-classify samples:
| (7) |
where is a focusing parameter default to 2.
The uncertainty-aware loss is defined by combining these loss components within an uncertainty-aware framework:
| (8) |
in which is the number of individual loss components, represents each loss component (such as Dice, CE, and Focal loss), and are learnable parameters that modify the contribution of each loss component based on the estimated uncertainty. To reduce the aggregate loss, these parameters are optimized during the training process.
By integrating uncertainty into the loss calculation, the model is able to dynamically modify the weights of each separate loss component. While mitigating the effects of class imbalance, this method strikes a balance between global and local accuracy. As an outcome, the model becomes more resilient to ambiguous or chaotic data, resulting in an overall improvement in segmentation performance.
3.3 Sharpness-Aware Minimization Optimization
To improve the U-Mamba model’s generalizaiton in segmenting cardiovascular images, such as those in the ACDC [2], ImageCAS [9], and Aorta dataset [10, 11], our methodology employs Sharpness-Aware Minimization (SAM) optimization [13]. The model’s generalizability is enhanced by the flattening of the loss landscape, implemented by SAM optimization. Despite the fact that conventional optimization techniques are designed to identify the lowest points in the loss landscape, these points are frequently precipitous, which results in inadequate generalization to new data. SAM, on the other hand, identifies gentler minima—regions in the parameter space where the model’s performance remains consistent and is less susceptible to perturbations.
SAM is employed due to its effective reduction of overfitting, a common issue in medical image segmentation. Performance on unseen data may be impaired by the narrow valleys in the loss landscape that are a common consequence of conventional optimization methods. SAM, in contrast, concentrates on the identification of flattened minima, which are linked to enhanced generalization. When dealing with complex and diverse datasets, this is especially beneficial, as the variability in cardiac MRI images can exacerbate overfitting if not properly managed.
Optimization of SAM is accomplished through a two-step iterative procedure. Parameters are initially adjusted to optimize loss for each mini-batch. After this, the model parameters are adjusted to reduce the maximum loss. This perturbation is designed to identify model parameters that are located in flatter regions of the loss landscape, which are typically associated with improved generalization and increased robustness to minor changes in the input data.
The model parameters shall be denoted by , the loss function by , and the training dataset by . To investigate the loss landscape within a neighborhood around defined by the norm constraint , the perturbation is introduced, with determining the size of this neighborhood.
Mathematically, the SAM optimization is expressed as:
| (9) |
The perturbation within the constraint is determined in the initial phase to maximize the loss. This method identifies the worst-case direction in the local neighborhood of . Furthermore, this guarantees that the model parameters are directed toward regions of the loss landscape that are not precipitous. In order to enhance the parameters’ resilience to perturbations, the model parameters are modified in the second phase to reduce the loss at the worst-case perturbed location.
By applying these two stages iteratively, SAM directs the optimizer toward parameter configurations that are resilient to perturbations, thereby improving generalization and overall performance. The model is able to identify flattened minima in the loss landscape as a result of this approach, which results in improved generalization [13].
4 Experiments
4.1 Experimental Settings
4.1.1 The ACDC Dataset
The Automated Cardiac Diagnosis Challenge (ACDC) dataset [2] is a widely recognized benchmark in medical image analysis, particularly for cardiac MRI segmentation. With a total of 300 images and 2,978 slices, this dataset comprises MRI scans from 150 patients, each divided into numerous slices. normal subjects, myocardial infarction, dilated cardiomyopathy, hypertrophic cardiomyopathy, and abnormal right ventricle are the five distinct categories in which the patients are evenly distributed. Each group is distinguished by specific cardiac pathologies.
The dataset includes short-axis cardiac MRI images that provide a thorough examination of the heart. Ground truth annotations are supplied for the left ventricle (LV), right ventricle (RV), and myocardium (MYO) in each image, facilitating the formulation and assessment of segmentation algorithms. The ACDC dataset also demonstrates variability in both image spacing and size across various dimensions, which further complicates the segmentation task.
4.1.2 The Aorta Dataset
The Aorta dataset [10, 11] is a meticulously annotated compilation of 50 Computed Tomography Angiography (CTA) images that enables the multi-class segmentation of the aorta and its branches. The axial dimensions of these images range from pixels to pixels, with an average size of pixels. The dataset is guaranteed to be consistent in measurement, as each image maintains an isotropic voxel resolution of 1mm x 1mm x 1mm. The average number of axial segments per scan is 695, with image numbers ranging from 578 to 801. This dataset is essential for the development and testing of sophisticated algorithms that are designed to accurately segment the complex vascular structures within the aorta and its branches, thereby establishing a strong foundation for research in medical image analysis and machine learning.
4.1.3 The ImageCAS Dataset
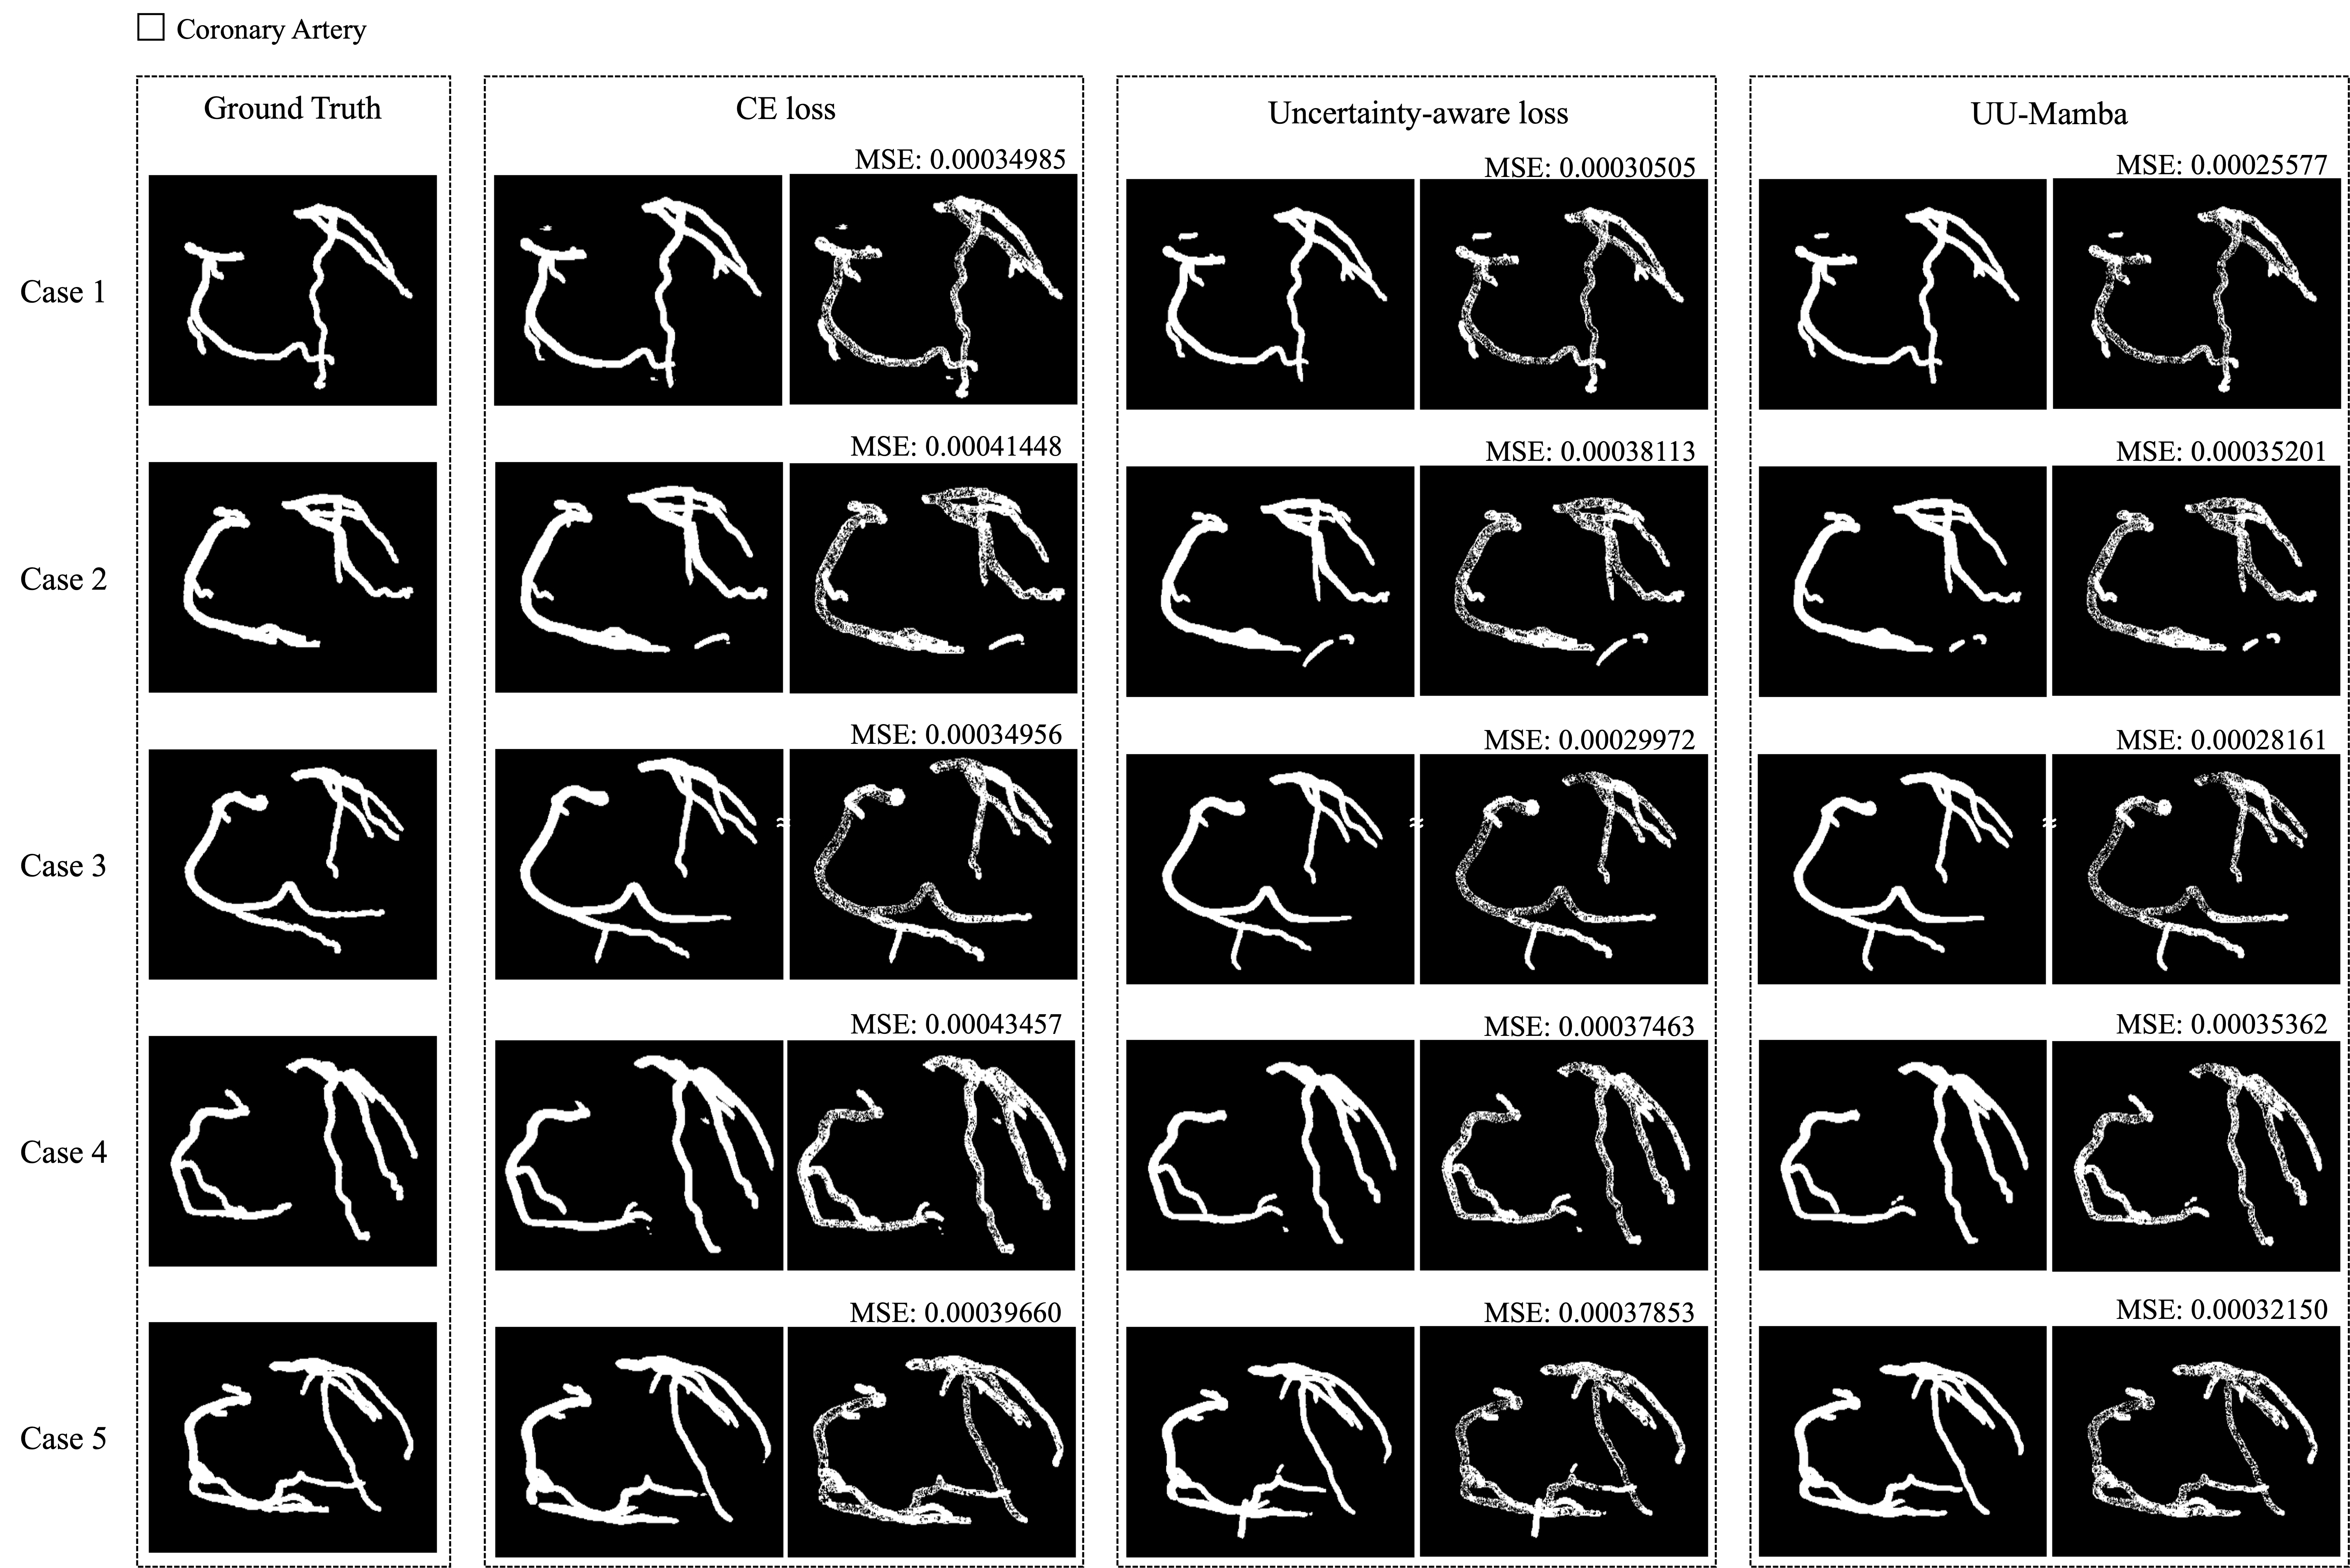
The ImageCAS dataset [9] focuses on the segmentation of coronary arteries using CTA images. This dataset contains approximately 1,000 3D CTA images, making it considerably larger than existing public datasets in this domain, which are crucial for diagnosing and assessing coronary artery disease. The dataset is particularly challenging due to the small size and complex branching patterns of the coronary arteries, as well as the motion artifacts introduced by cardiac and respiratory movements. Ground truth annotations include detailed segmentations of the coronary arteries, providing a comprehensive framework for evaluating the performance of segmentation algorithms in detecting and delineating these critical structures.
These datasets provide a diverse and comprehensive set of challenges for cardiac and vascular segmentation, allowing us to rigorously evaluate the effectiveness and generalizability of the proposed UU-Mamba model across different anatomical structures and imaging modalities.
4.1.4 Evaluation Metrics
We employ the Dice Similarity Coefficient (DSC) as our primary metric for evaluating segmentation performance, as per the evaluation protocol outlined in [26]. The DSC assesses the overlap between the predicted segmentation and the ground truth mask, thereby providing a reliable indication of the model’s accuracy in delineating cardiac structures. The DSC is defined in Eq. (4).
Additionally, we employ the Mean Squared Error (MSE) to assess the average squared difference between the predicted probabilities and the ground truth labels, in addition to DSC. Let denote the number of testing images, and denote the height and width of the images, be the predicted probability at pixel for the -th image, and the corresponding ground truth label. The MSE is determined by the following formula:
| (10) |
MSE offers a complementary evaluation, providing insight into the model’s pixel-wise precision.
We also incorporate the Normalized Surface Dice (NSD) metric that recommend in [26]. The NSD measures the average distance between the predicted segmentation surface and the ground truth surface, normalized by the ground truth surface area. This metric is particularly useful for assessing the spatial accuracy of the segmentation, especially in clinical scenarios where precise boundary delineation is critical. The NSD is defined as follows:
| (11) |
where is the set of surface points in the ground truth segmentation, is the set of surface points in the predicted segmentation, and represents the Euclidean distance between points and . The NSD thus provides a detailed measure of the model’s ability to accurately capture the shape and contours of the cardiac structures.
4.1.5 Implementation Details
We conducted the experiments using the PyTorch framework and two NVIDIA A100 Tensor Core GPUs for training. During training, for the ACDC dataset [2], we used a patch size of [20, 256, 224] and a batch size of 4, with the number of pooling operations per axis configured to [2, 5, 5]. In the case of the ImageCAS dataset [9], a patch size of [96, 160, 160] and a batch size of 2 were selected, with pooling operations per axis set to [4, 5, 5]. For the Aorta dataset [10, 11], the patch size was [176, 112, 112], also with a batch size of 2, and the pooling operations per axis were set to [4, 4, 4]. The network configuration comprises 6 stages. An initial learning rate of was utilized, and the training proceeded for 500 epochs. In the SAM optimization, the hyperparameter controlling the perturbation in Eq. (9) was set to 0.05. The focusing parameter in the focal loss in Eq. (7) was set to 2. The parameter of the uncertainty-aware loss in Eq. (8) was set to 3, incorporating Dice loss, Cross-Entropy loss, and Focal loss.
Method Average RV Myo LV TransUNet [61] 89.71 88.86 84.53 95.73 Swin-Unet [62] 90.00 88.55 85.62 95.83 nnUNet [37] 91.61 90.24 89.24 95.36 nnFormer [63] 92.06 90.94 89.58 95.65 U-Mamba [12] 92.22 91.83 90.22 94.54 UU-Mamba (Ours) 92.79 92.41 90.90 95.04
Method Avg. DSC % RV DSC % Myo DSC % LV DSC % CE loss 92.263 91.81 90.31 94.67 Uncertainty-aware loss (CE, Dice, Focal) 92.602 92.36 90.51 94.94 UU-Mamba model (Ours) 92.787 92.41 90.90 95.04
Method Avg. DSC % Avg. NSD % Avg. MSE % CE loss 73.761 92.141 0.0960 Uncertainty-aware loss (CE, Dice, Focal) 75.053 91.747 0.0966 UU-Mamba model (Ours) 77.084 93.847 0.0906
Method Avg. DSC % Avg. NSD % Avg. MSE % CE loss 79.496 87.490 0.0006784 Uncertainty-aware loss (CE, Dice, Focal) 81.146 88.045 0.0006105 Uncertainty-aware loss + SAM (Ours) 81.9983 88.771 0.0005903
4.2 Experimental Results
We conduct a comparison of UU-Mamba with five of the state-of-the-art segmentation models—TransUNet [61], Swin-Unet [62], nnUNet [37], nnFormer [63], and U-Mamba [12]—on the ACDC dataset [2]. Transformer-based networks are TransUNet and Swin-Unet, while nnUNet and nnFormer employ CNN-based architectures. U-Mamba is a hybrid architecture that combines components from both Transformer-based and CNN-based networks.
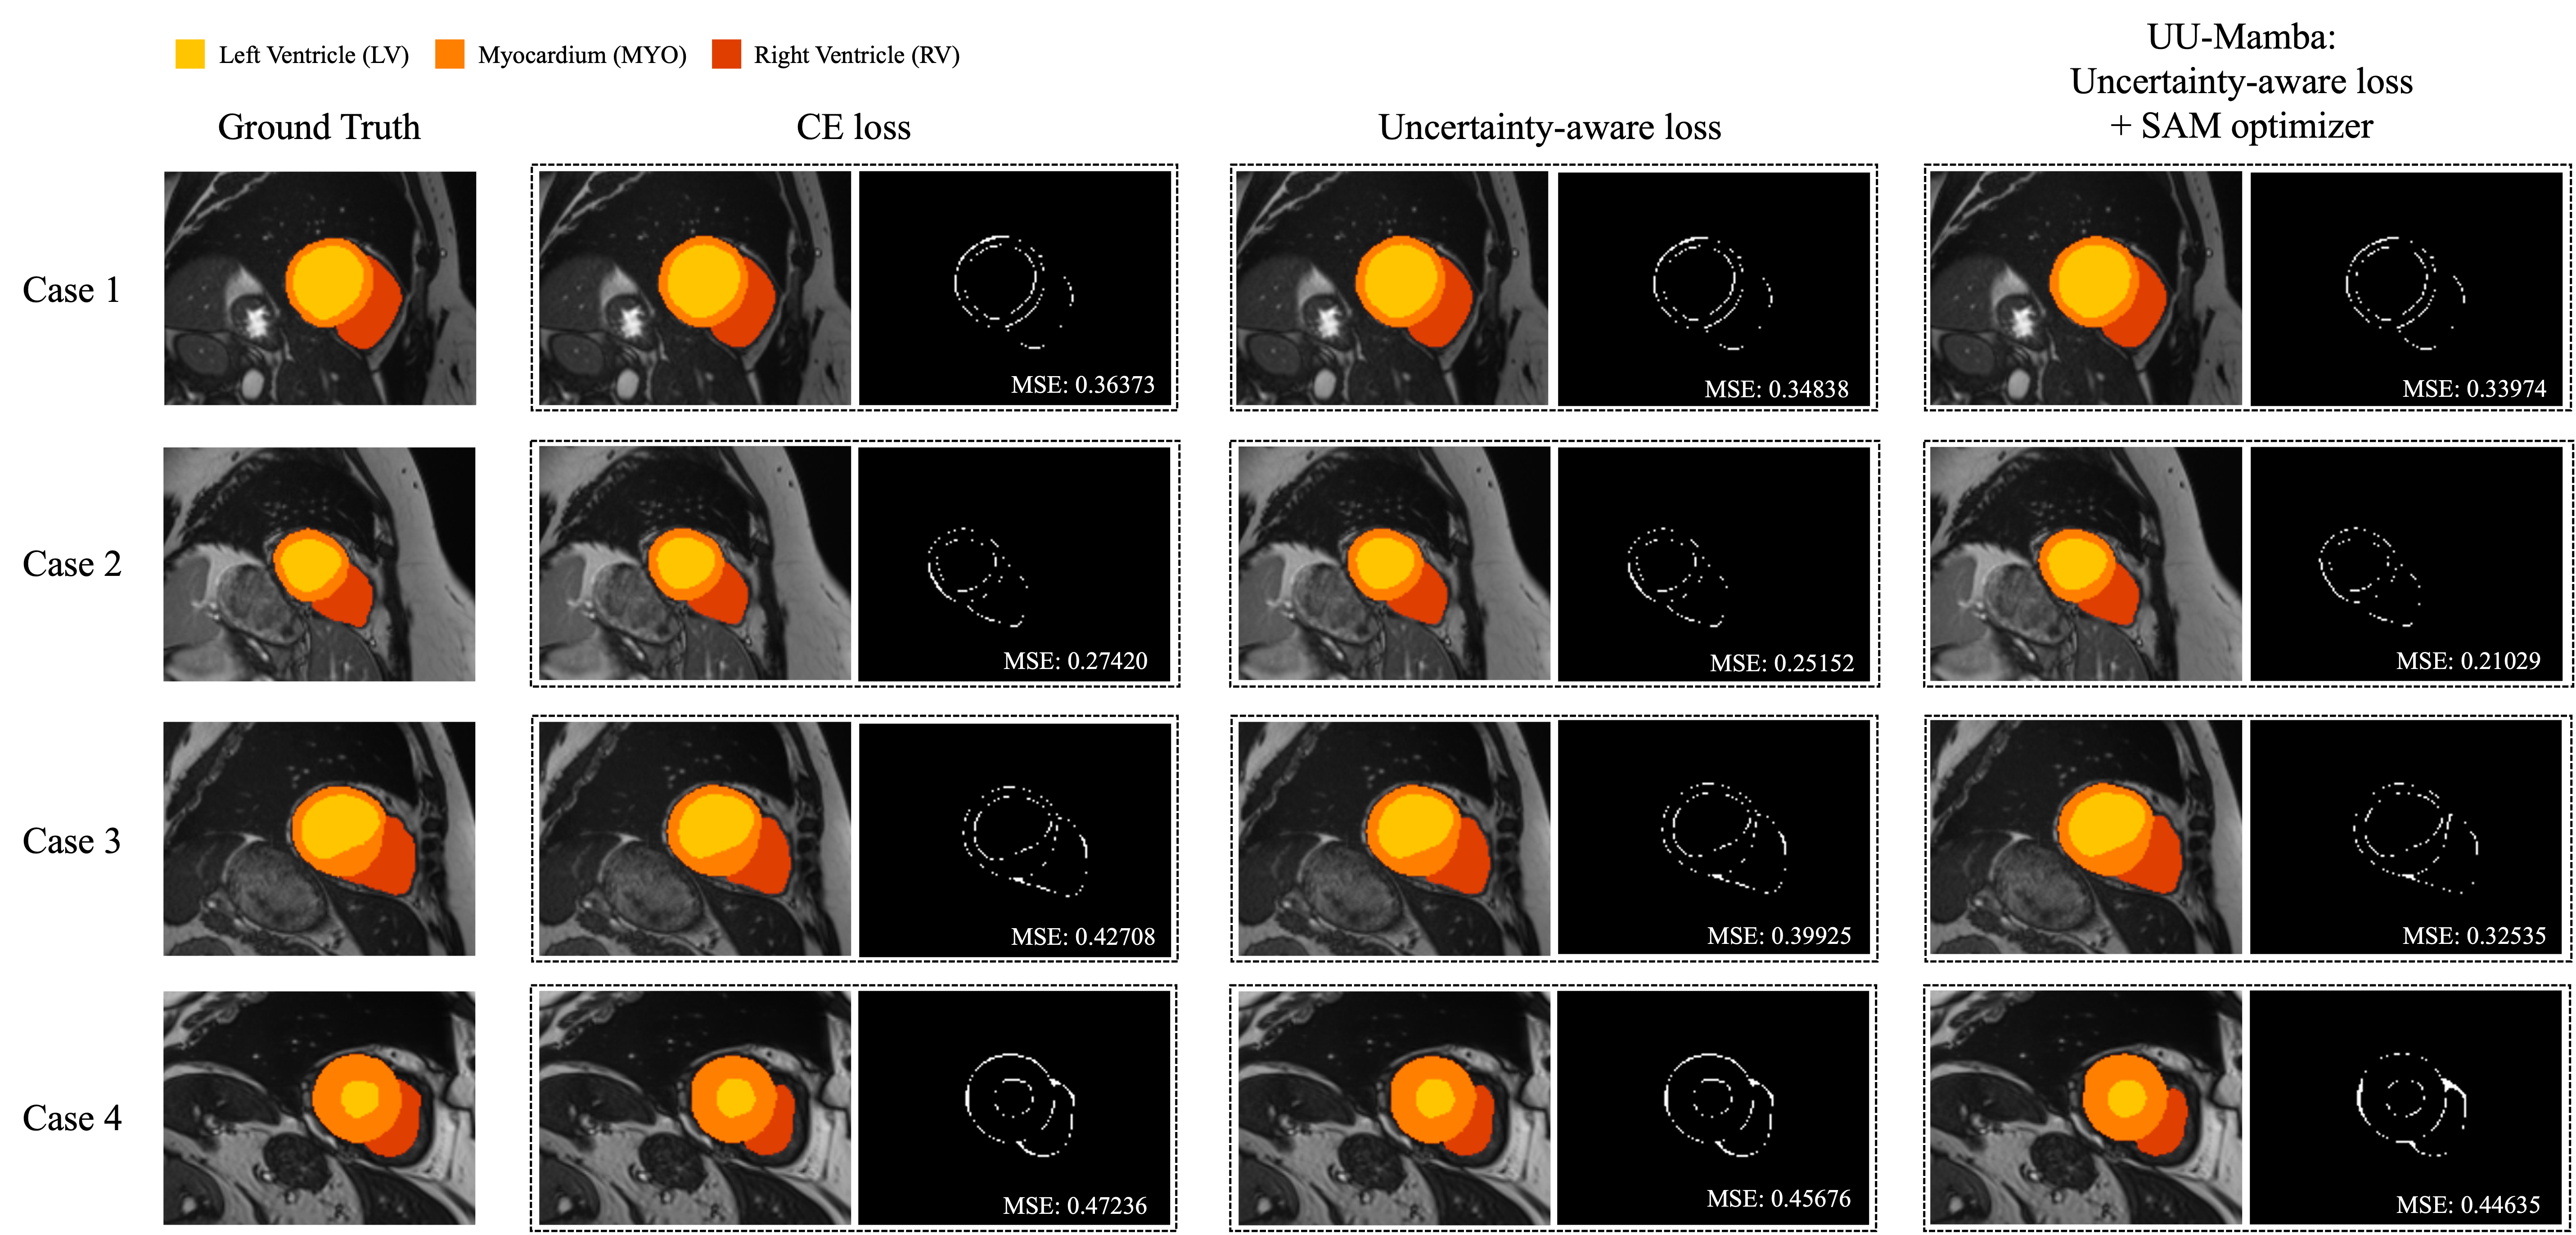
Using the Dice Similarity Coefficient (DSC) as the evaluation metric, we conducted a quantitative evaluation of UU-Mamba against these five 3D heart segmentation models on the ACDC dataset [2]. The segmentation results for the compared algorithms are depicted in Figure 3 on a few images from the ACDC dataset. Table 1 provides the average DSC scores across all regions, as well as the DSC scores for each model in three cardiac regions: the right ventricle (RV), myocardium (Myo), and left ventricle (LV). The scores that demonstrate the greatest performance are indicated in italics.
Our UU-Mamba model surpasses all other methods, attaining the highest overall performance with an average DSC of 92.79%. The DSC scores for each region are as follows: 92.41% for RV, 90.90% for Myo, and 95.04% for LV for each region. Our model’s flexibility and efficacy are demonstrated by its exceptional ability to accurately segment the right ventricle and myocardium. Despite a minor decrease in DSC for the left ventricle in comparison to other models, this is counterbalanced by the highest overall average DSC and the superior scores in other regions, as illustrated in Table 1.
In contrast, TransUNet attains an average DSC of 89.71%, with a relatively lower score for Myo. The average DSC of Swin-Unet is 90.00%, with the maximum DSC for LV and lower performance for RV. The nnUNet model achieves an average DSC of 91.61%, with significant enhancements in Myo segmentation. Providing robust performance in all regions, particularly the myocardium, the nnFormer model obtains an average DSC of 92.06%. U-Mamba’s average DSC of 92.22% indicates substantial improvements in the RV and Myo regions.
The superior performance of our UU-Mamba model in comparison to the other existing models is emphasized by this quantitative evaluation. Our method exhibits the potential to improve the accuracy of 3D heart segmentation in medical imaging, as it has the highest average DSC and notably strong segmentation in the right ventricle and myocardium. The effectiveness of our approach is underscored by the enhancements it achieves over models such as U-Mamba, nnFormer, and nnUNet. This approach employs sophisticated loss functions and optimization techniques to capitalize on both global and local features.
DSC (%) NSD (%) Labels CE loss Uncertainty- aware loss UUMamba CE loss Uncertainty- aware loss UUMamba Zone 0 89.317 87.803 87.604 76.749 70.280 72.291 Innominate 75.151 77.830 78.126 81.251 84.259 84.768 Zone 1 67.936 65.432 65.491 86.647 84.379 85.001 Left Common Carotid 78.001 77.547 78.689 92.852 93.539 93.453 Zone 2 75.043 75.514 73.749 91.645 91.627 90.585 Left Subclavian Artery 83.260 83.578 84.725 99.124 98.742 98.612 Zone 3 74.306 73.513 73.157 94.146 92.939 93.038 Zone 4 79.590 84.233 84.701 89.008 91.987 93.001 Zone 5 88.860 89.725 89.780 95.571 96.879 97.271 Zone 6 71.166 71.119 73.552 97.692 94.694 98.381 Celiac Artery 67.016 66.311 68.691 97.270 96.138 99.158 Zone 7 68.116 71.036 74.067 99.404 99.060 99.622 SMA 69.002 70.117 71.200 88.940 87.300 88.905 Zone 8 77.029 79.027 78.831 100.000 99.576 100.000 Right Renal Artery 74.873 72.898 73.501 98.032 96.949 97.015 Left Renal Artery 67.907 70.187 71.890 96.650 98.323 97.640 Zone 9 90.805 90.118 91.008 99.877 99.636 99.637 Right Common Iliac Artery 78.244 79.078 86.141 95.438 96.317 98.783 Left Common Iliac Artery 75.914 79.623 86.457 97.638 96.370 99.864 Right Internal Iliac Artery 59.568 65.540 66.409 85.795 82.728 88.424 Left Internal Iliac Artery 67.034 64.154 67.791 96.124 90.865 99.069 Right External Iliac Artery 59.216 61.344 72.469 77.545 77.270 87.139 Left External Iliac Artery 59.148 70.506 74.895 81.853 90.306 96.825
4.3 Ablation Study
We perform an ablation study to investigate the impact of integrating Sharpness-Aware Minimization (SAM) optimization [13] into our UU-Mamba model, alongside traditional and uncertainty-aware loss functions. This study spans three datasets: ACDC [2], Aorta [10, 11], and ImageCAS [9], and employs 3D loss surface visualizations [27] using ParaView [64, 65, 66] to demonstrate the smoother loss landscapes indicative of model robustness and improved generalization.
4.3.1 Impact of Traditional and Uncertainty-Aware Loss Functions
To evaluate the impact of different loss functions on model performance, we first assess the baseline performance using the standard Cross-Entropy (CE) loss. This traditional approach achieves satisfactory results but has limitations in handling complex segmentation challenges. To address these, we introduce an uncertainty-aware loss function, which combines Dice loss, CE loss, and Focal loss. This combination provides a more balanced approach by emphasizing confident predictions and reducing the negative impact of uncertain areas in the segmentation process.
In the ACDC dataset [2], the model trained with only CE loss achieves a Dice Similarity Coefficient (DSC) of 92.263%. When incorporating the uncertainty-aware loss, the DSC improves to 92.602%. This enhancement reflects the efficacy of the uncertainty-aware approach in improving segmentation resilience by carefully managing prediction uncertainty and refining the model’s focus on areas of high confidence, as also shown in Table 2.
For the Aorta dataset [10, 11], training with only CE loss yields an average Dice Similarity Coefficient (DSC) of 73.761%. Incorporating the uncertainty-aware loss results in notable improvements across various anatomical zones and arteries, raising the average DSC to 75.053% and average NSD to 91.747%, also reducing the Mean Squared Error (MSE). These improvements, as shown in Table 3, highlight the uncertainty-aware loss’s ability to handle complex segmentation tasks by balancing confident predictions with uncertain areas.
For the ImageCAS dataset [9], the model trained with only CE loss achieves an average Dice Similarity Coefficient (DSC) of 79.496%. By incorporating the uncertainty-aware loss, the average DSC improves to 81.146% and NSD improves to 88.045%, demonstrating the advantage of this comprehensive loss function in enhancing segmentation accuracy, particularly in challenging regions, as shown in Table 4.
4.3.2 Enhancements with Sharpness-Aware Minimization optimization
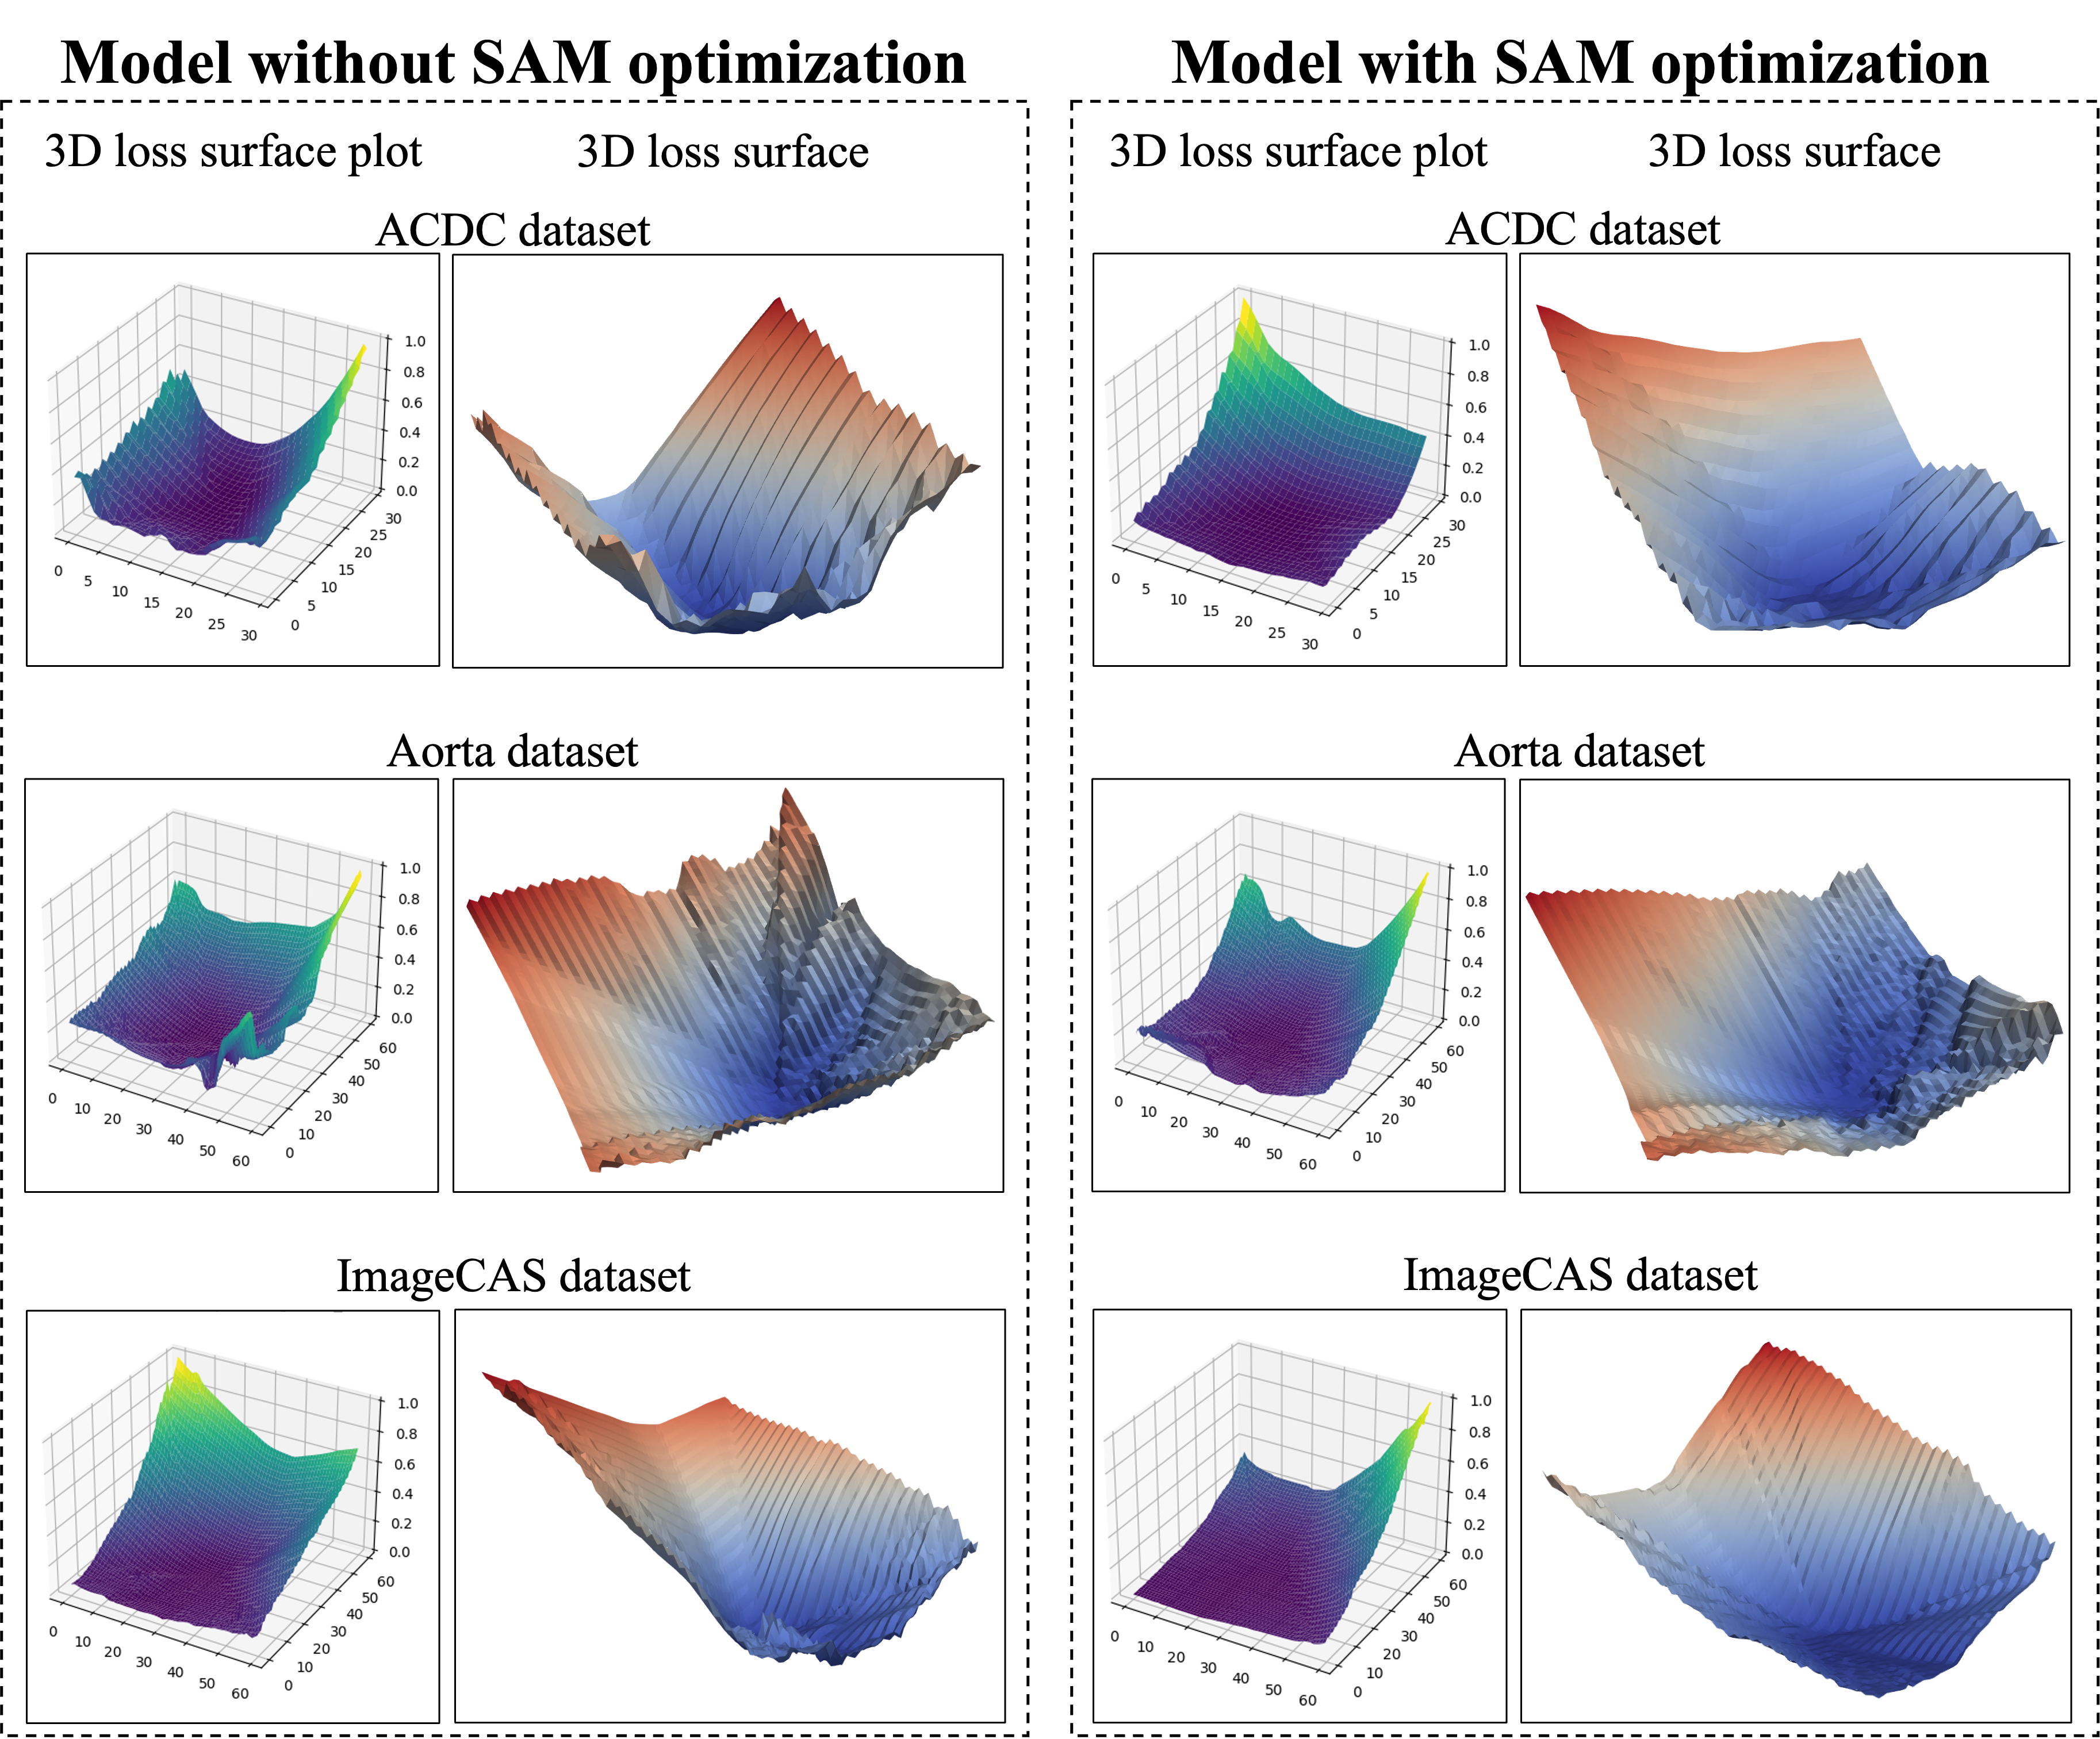
Building on the incorporation of uncertainty-aware loss, we further integrate Sharpness-Aware Minimization (SAM) optimization [13] to explore its additional benefits. SAM is designed to steer the training process toward flatter minima, which are associated with improved generalization in neural network models. Figure 6 illustrates a comparison of the loss landscapes between models trained with and without SAM optimization.
In Table 2, incorporating SAM with the uncertainty-aware loss increases the ACDC dataset’s DSC to 92.787%, the highest among the tested methods, thus validating SAM’s role in enhancing segmentation precision and generalization. In the Figure 6, the loss landscape on the ACDC dataset is shown for models with and without SAM optimization. The 3D loss surface plot of the model without SAM optimization exhibits a broader range of loss values, characterized by sharper and more erratic loss contours. In contrast, the model utilizing SAM optimization displays a flatter and smoother loss landscape, indicating improved stability and generalization.
As shown in Table 3, incorporating SAM into the model training process increases the average DSC to 77.084%, along with significant improvements in both DSC and NSD metrics. SAM optimization leads to smoother and more stable loss surfaces, as demonstrated in Figure 6. Without SAM, the 3D loss surface exhibits sharper and more rugged contours, particularly along the edges. In contrast, the model with SAM displays a flatter, more stable loss landscape, indicating improved robustness and generalization.
Notably, the UU-Mamba model achieves the highest DSC scores in 17 out of 24 anatomical regions and the highest NSD values in 13 out of 24 regions, as detailed in Table 5. These results underscore the superior generalizability and accuracy of the UU-Mamba model. The consistent top performance across most regions highlights the significant benefits of combining uncertainty-aware loss with SAM optimization to enhance segmentation outcomes.
As detailed in Table 4, SAM optimization pushes the ImageCAS dataset performance metrics to the highest levels observed in this study. In Figure 6, the 3D loss surface of the model without SAM shows greater variability, especially in the bottom right region. By contrast, with SAM optimization, the loss surface becomes much smoother, indicating improved model consistency, robustness, and generalization across diverse cardiovascular imaging scenarios.
Incorporating Sharpness-Aware Minimization (SAM) optimization significantly improves performance across various cardiovascular imaging datasets. SAM promotes flatter minima in the training process, leading to better generalization and segmentation precision. In the ACDC dataset, SAM boosts the DSC to 92.787%, the highest among tested methods. For the Aorta and ImageCAS datasets, SAM enhances both DSC and NSD metrics, leading to smoother and more stable loss landscapes, reflecting improved model consistency and performance across diverse datasets.
4.4 Robustness Analysis
We perform experiments to evaluate each method on the Mean Squared Error (MSE) of the DSC scores to assess their robustness quantitatively. The MSE is calculated as shown in Eq. (10). Results are shown in the Tables 2, 3, and 4. These results show that the uncertainty-aware loss reduces the MSE compared to the standard CE loss, reflecting its ability to better address the variability and uncertainty in the data. The inclusion of SAM optimization significantly decreases the MSE, achieving the lowest error value. This reduction in MSE highlights SAM’s role in minimizing errors and producing more accurate segmentation maps.
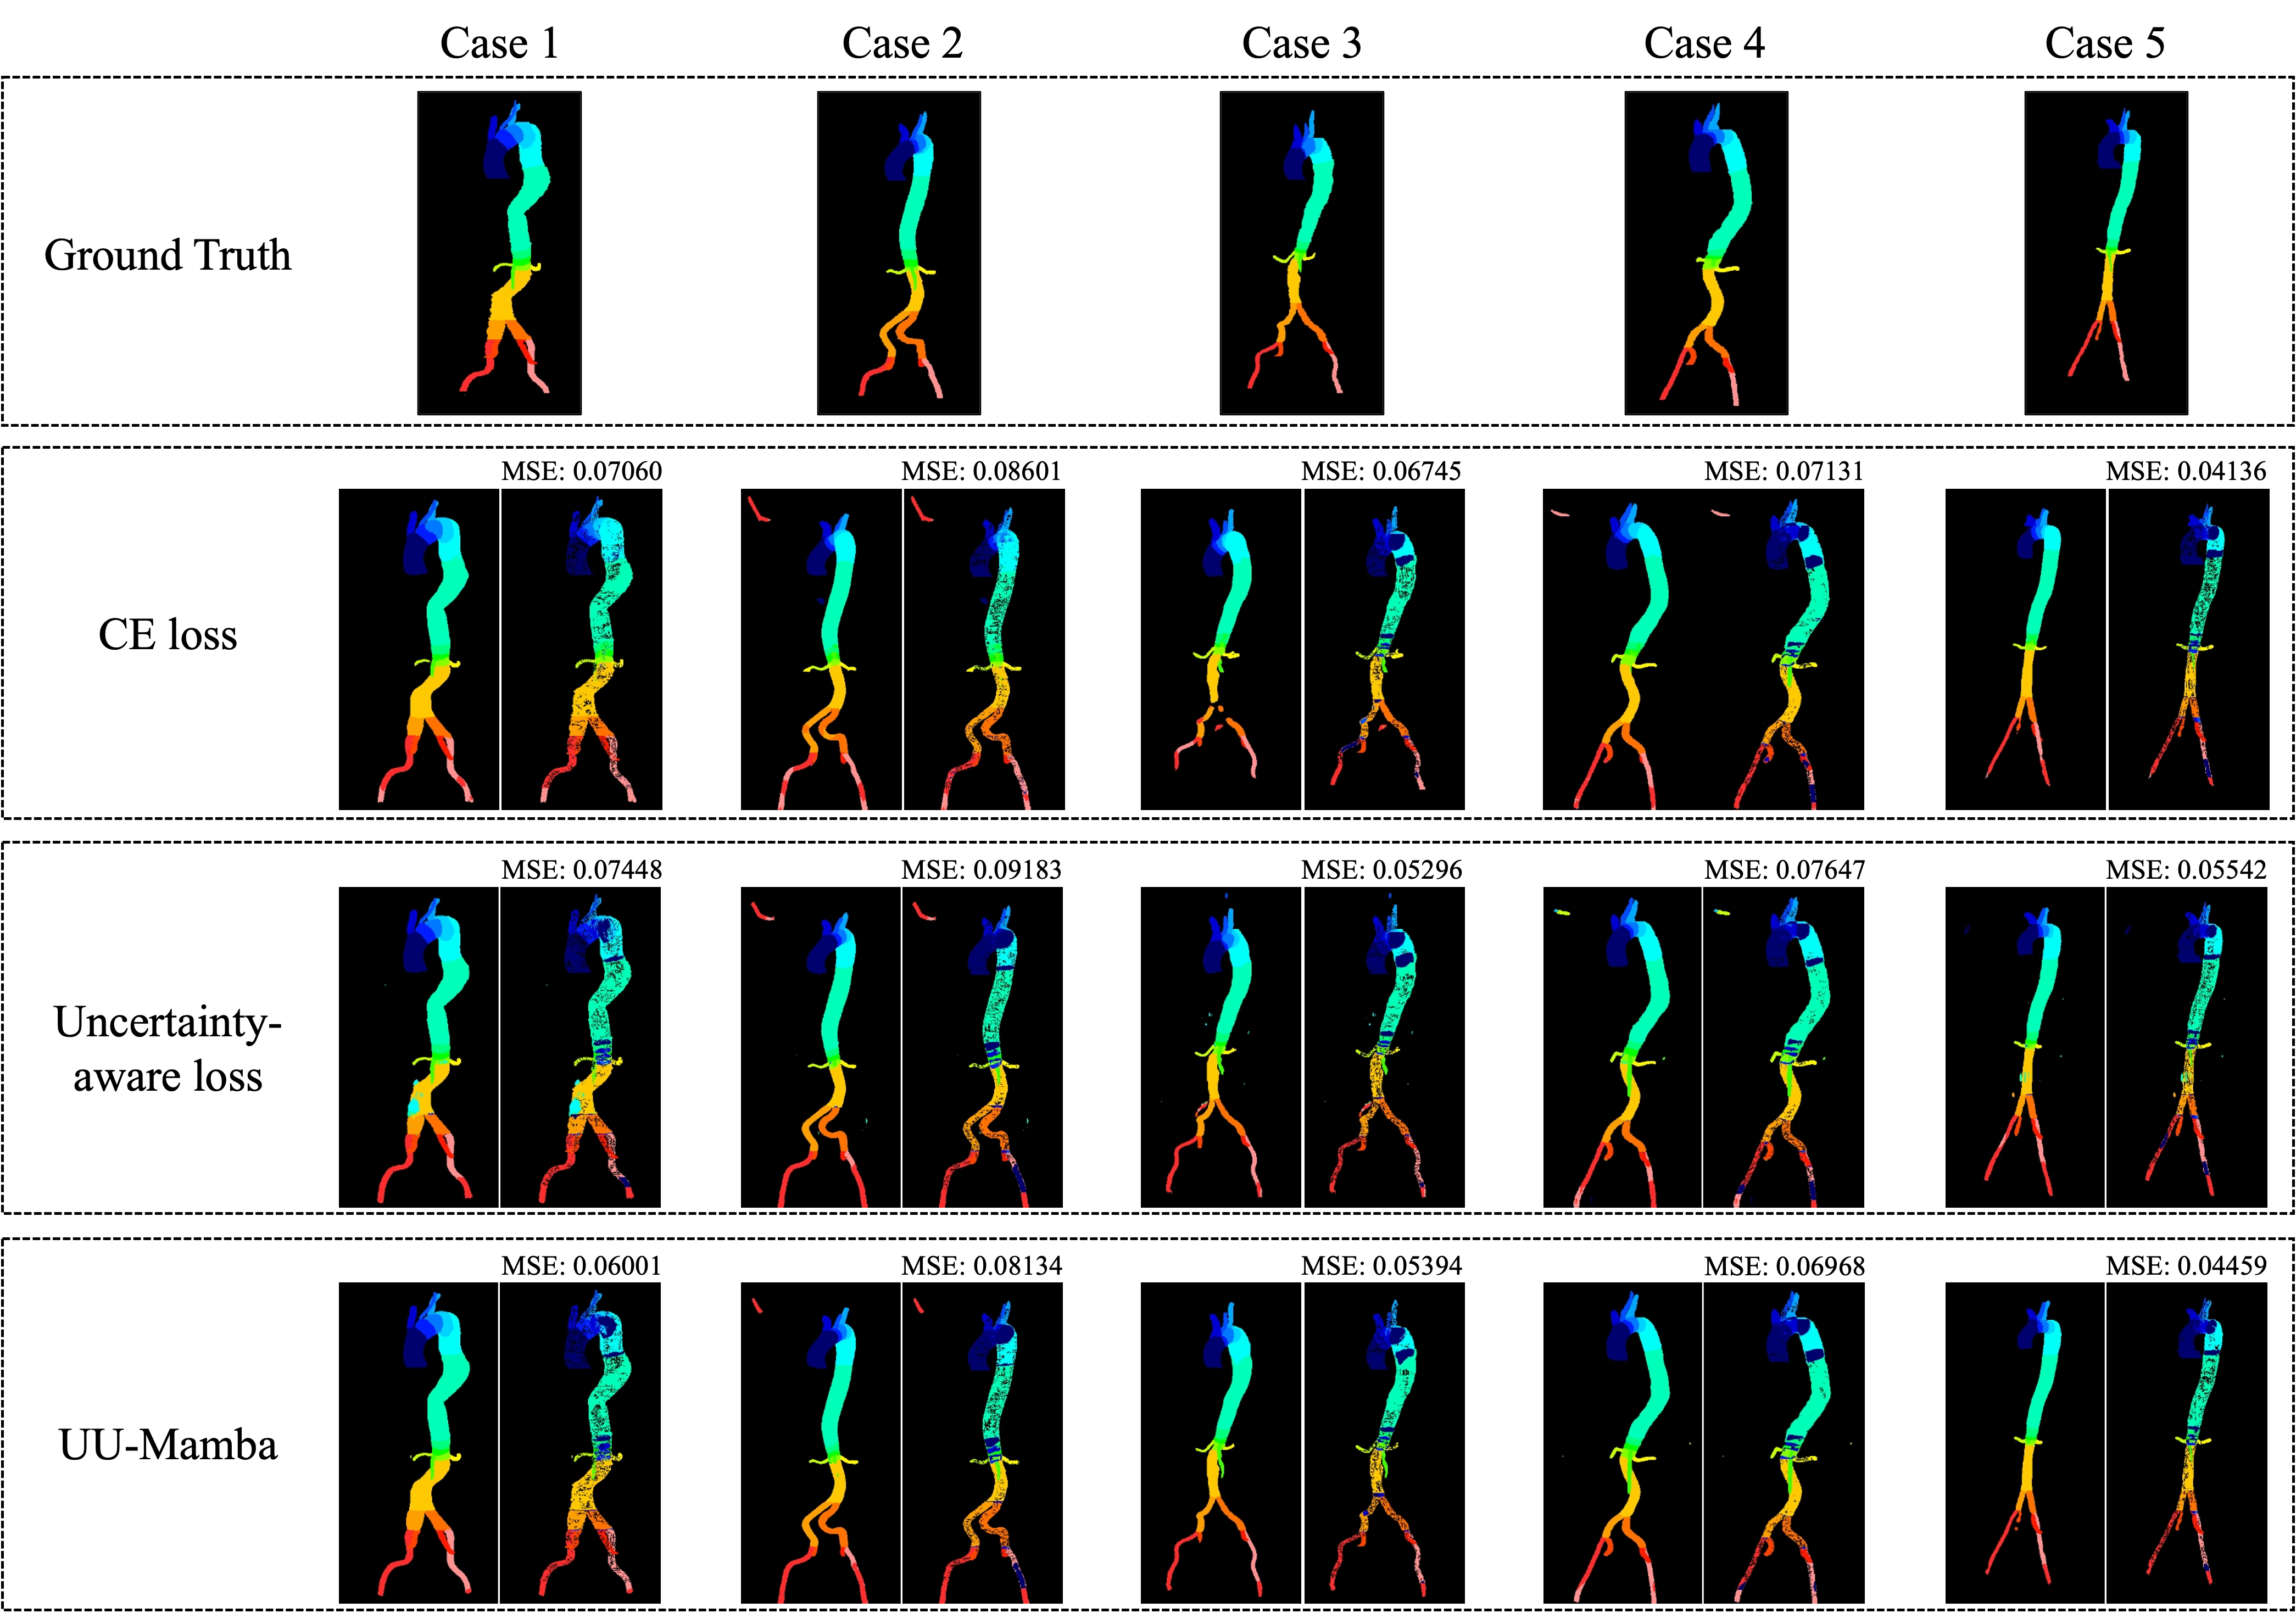
Figures 3, 4, and 5 show the MSE between the output segmentation and the ground truth for each method, providing a visual comparison of the segmentation quality. These visualizations complement the quantitative results by illustrating the error distribution and highlighting areas where the SAM optimization and uncertainty-aware loss contribute to more accurate and consistent segmentation outcomes.
5 Conclusion
We present a novel model, UU-Mamba, specifically developed for the purpose of segmenting cardiovascular MRI and CT data. This model combines the U-Mamba architecture with an uncertainty-aware loss function and the SAM optimizer, resulting in a substantial enhancement of biological picture segmentation. It achieves improved generalization and boundary accuracy. The uncertainty-aware loss function integrates region-based, distribution-based, and pixel-based losses to enhance segmentation performance by effectively managing jobs and prioritizing confident predictions. Simultaneously, the SAM optimizer directs the model towards flat minima in the loss landscape, improving its ability to withstand challenges and decreasing the likelihood of overfitting, ultimately resulting in more accurate segmentation. Aside from doing our main tests on the ACDC dataset [2], we also assessed the performance of UU-Mamba on two other datasets: ImageCAS [9] and Aorta [10, 11]. The model scored the greatest average DSC, NSD, and MSE on the ImageCAS dataset, demonstrating a considerable improvement compared to the baseline models. UU-Mamba demonstrated superior performance compared to other models on the Aorta dataset, earning the greatest average DSC in 17 out of 24 anatomical regions and the highest average NSD in 13 out of 24 anatomical regions. The data illustrate that the model is highly effective in different anatomical regions and segmentation tasks, highlighting its versatility and strength in numerous medical imaging situations. The comparative analysis conducted on five prominent models establishes the superiority of UU-Mamba. It achieves a DSC of 92.787% on the ACDC dataset, demonstrating high accuracy and robustness in segmenting various datasets, such as ImageCAS and Aorta.
Future work will involve examining supplementary data augmentation strategies, exploring other ways for modeling uncertainty, and validating the model on bigger and more varied datasets. Our main objective is to improve and expand the UU-Mamba technique in order to enhance automated medical imaging.
Acknowledgments. This work is supported by the University at Albany Start-up Grant. The authors appreciate the computational resource provided by the University at Albany – SUNY.
References
- [1] Z. Liu, C. Ma, W. She, M. Xie, Biomedical Image Segmentation Using Denoising Diffusion Probabilistic Models: A Comprehensive Review and Analysis, Applied Sciences 14 (2) (2024).
- [2] O. Bernard, A. Lalande, C. Zotti, F. Cervenansky, X. Yang, P.-A. Heng, I. Cetin, K. Lekadir, O. Camara, M. A. G. Ballester, et al., Deep Learning Techniques for Automatic MRI Cardiac Multi-Structures Segmentation and Diagnosis: Is the Problem Solved?, IEEE Transactions on Medical Imaging 37 (11) (2018) 2514–2525.
- [3] G. Litjens, T. Kooi, B. E. Bejnordi, A. A. A. Setio, F. Ciompi, M. Ghafoorian, J. A. van der Laak, B. van Ginneken, C. I. Sánchez, A survey on deep learning in medical image analysis, Medical Image Analysis 42 (2017) 60–88.
- [4] C. Petitjean, J.-N. Dacher, A review of segmentation methods in short axis cardiac MR images, Medical Image Analysis 15 (2) (2011) 169–184.
- [5] A. K. Maier, C. Syben, T. Lasser, C. Riess, A gentle introduction to deep learning in medical image processing, Zeitschrift für Medizinische Physik 29 (2) (2019) 86–101.
- [6] Z. Li, X. Zhang, H. Müller, S. Zhang, Large-scale retrieval for medical image analytics: A comprehensive review, Medical Image Analysis 43 (2018) 66–84.
- [7] Y. LeCun, Y. Bengio, et al., Convolutional networks for images, speech, and time series, The handbook of brain theory and neural networks 3361 (10) (1995) 1995.
- [8] A. S. Fahmy, H. El-Rewaidy, M. Nezafat, S. Nakamori, R. Nezafat, Automated analysis of cardiovascular magnetic resonance myocardial native T1 mapping images using fully convolutional neural networks, Journal of Cardiovascular Magnetic Resonance 21 (1) (2019) 7.
- [9] A. Zeng, C. Wu, G. Lin, W. Xie, J. Hong, M. Huang, J. Zhuang, S. Bi, D. Pan, N. Ullah, K. N. Khan, T. Wang, Y. Shi, X. Li, X. Xu, ImageCAS: A large-scale dataset and benchmark for coronary artery segmentation based on computed tomography angiography images, Computerized Medical Imaging and Graphics 109 (2023) 102287.
- [10] M. Imran, J. R. Krebs, V. R. R. Gopu, B. Fazzone, V. B. Sivaraman, A. Kumar, C. Viscardi, R. E. Heithaus, B. Shickel, Y. Zhou, W. Shao, CIS-UNet: Multi-Class Segmentation of the Aorta in Computed Tomography Angiography via Context-Aware Shifted Window Self-Attention, arXiv preprint arXiv:2401.13049 (2024).
- [11] J. R. Krebs, M. Imran, B. Fazzone, C. Viscardi, B. Berwick, G. Stinson, E. Heithaus, G. R. Upchurch Jr, W. Shao, M. A. Cooper, Volumetric Analysis of Acute Uncomplicated Type B Aortic Dissection Using an Automated Deep Learning Aortic Zone Segmentation Model, Journal of Vascular Surgery (2024).
- [12] J. Ma, F. Li, B. Wang, U-Mamba: Enhancing Long-range Dependency for Biomedical Image Segmentation, arXiv preprint arXiv:2401.04722 (2024).
- [13] P. Foret, A. Kleiner, H. Mobahi, B. Neyshabur, Sharpness-Aware Minimization for Efficiently Improving Generalization, in: Proceedings of the 8th International Conference on Learning Representations (ICLR), 2021.
- [14] S. Jadon, A survey of loss functions for semantic segmentation, in: 2020 IEEE Conference on Computational Intelligence in Bioinformatics and Computational Biology (CIBCB), IEEE, Via del Mar, Chile, 2020, pp. 1–7.
- [15] C. H. Sudre, W. Li, T. Vercauteren, S. Ourselin, M. Jorge Cardoso, Generalised Dice Overlap as a Deep Learning Loss Function for Highly Unbalanced Segmentations, in: Deep Learning in Medical Image Analysis and Multimodal Learning for Clinical Decision Support, Springer International Publishing, Cham, 2017, pp. 240–248.
- [16] M. Yi-de, L. Qing, Q. Zhi-bai, Automated image segmentation using improved PCNN model based on cross-entropy, in: Proceedings of 2004 International Symposium on Intelligent Multimedia, Video and Speech Processing, 2004., IEEE, Hong Kong, China, 2004, pp. 743–746.
- [17] T.-Y. Lin, P. Goyal, R. Girshick, K. He, P. Dollár, Focal Loss for Dense Object Detection, in: 2017 IEEE International Conference on Computer Vision (ICCV), IEEE, Venice, Italy, 2017, pp. 2999–3007.
- [18] R. Cipolla, Y. Gal, A. Kendall, Multi-task Learning Using Uncertainty to Weigh Losses for Scene Geometry and Semantics, in: 2018 IEEE/CVF Conference on Computer Vision and Pattern Recognition, IEEE, Salt Lake City, UT, USA, 2018, pp. 7482–7491.
- [19] R. Azad, M. Heidary, K. Yilmaz, M. Hüttemann, S. Karimijafarbigloo, Y. Wu, A. Schmeink, D. Merhof, Loss Functions in the Era of Semantic Segmentation: A Survey and Outlook, arXiv preprint arXiv:2312.05391 (2023).
- [20] L. Lin, S. Papabathini, X. Wang, S. Hu, Robust Light-Weight Facial Affective Behavior Recognition with CLIP, in: Proceedings of the IEEE International Conference on Multimedia Information Processing and Retrieval (MIPR), San Jose, CA, USA, 2024.
- [21] L. Lin, Y. S. Krubha, Z. Yang, C. Ren, X. Wang, S. Hu, Robust COVID-19 Detection in CT Images with CLIP, in: Proceedings of the IEEE International Conference on Multimedia Information Processing and Retrieval (MIPR), San Jose, CA, USA, 2024.
- [22] Santosh, L. Lin, I. Amerini, X. Wang, S. Hu, Robust CLIP-Based Detector for Exposing Diffusion Model-Generated Images, arXiv preprint arXiv:2404.12908 (2024).
- [23] L. Lin, X. He, Y. Ju, X. Wang, F. Ding, S. Hu, Preserving Fairness Generalization in Deepfake Detection, in: Proceedings of the IEEE/CVF Conference on Computer Vision and Pattern Recognition (CVPR), 2024, pp. 16815–16825.
- [24] I. Mariam, X. Xue, K. Gadson, A Retinal Vessel Segmentation Method Based on the Sharpness-Aware Minimization Model, Sensors 24 (13) (2024).
- [25] T. Y. Tsai, L. Lin, S. Hu, M.-C. Chang, H. Zhu, X. Wang, UU-Mamba: Uncertainty-aware U-Mamba for Cardiac Image Segmentation, in: Proceedings of the IEEE International Conference on Multimedia Information Processing and Retrieval (MIPR), San Jose, CA, USA, 2024.
- [26] L. Maier-Hein, A. Reinke, P. Godau, M. D. Tizabi, F. Buettner, E. Christodoulou, B. Glocker, F. Isensee, J. Kleesiek, M. Kozubek, et al., Metrics reloaded: recommendations for image analysis validation, Nature Methods 21 (2) (2024) 195–212.
- [27] H. Li, Z. Xu, G. Taylor, C. Studer, T. Goldstein, Visualizing the loss landscape of neural nets, in: Proceedings of the 32nd International Conference on Neural Information Processing Systems, Curran Associates Inc., Red Hook, NY, USA, 2018, p. 6391–6401.
- [28] X. Wang, H. Zhu, Artificial Intelligence in Image-based Cardiovascular Disease Analysis: A Comprehensive Survey and Future Outlook, arXiv preprint arXiv:2402.03394 (2024).
- [29] T. Zhou, S. Ruan, S. Canu, A review: Deep learning for medical image segmentation using multi-modality fusion, Array 3-4 (2019) 100004.
- [30] L. Li, W. Ding, L. Huang, X. Zhuang, V. Grau, Multi-modality cardiac image computing: A survey, Medical Image Analysis 88 (2023) 102869.
- [31] C. Zhao, K. Liu, W. Chen, Z. Pei, Y. Feng, Multi-Modality Brain Tumor Segmentation Network Based on Collaborative Feature Fusion, in: 2022 IEEE 17th Conference on Industrial Electronics and Applications (ICIEA), IEEE, Chengdu, China, 2022, pp. 1122–1127.
- [32] J. E. Iglesias, M. R. Sabuncu, Multi-atlas segmentation of biomedical images: A survey, Medical Image Analysis 24 (1) (2015) 205–219.
- [33] C. Chen, C. Qin, H. Qiu, G. Tarroni, J. Duan, W. Bai, D. Rueckert, Deep Learning for Cardiac Image Segmentation: A Review, Frontiers in cardiovascular medicine 7 (2020) 25.
- [34] W. Xu, J. Shi, Y. Lin, C. Liu, W. Xie, H. Liu, S. Huang, D. Zhu, L. Su, Y. Huang, et al., Deep learning-based image segmentation model using an MRI-based convolutional neural network for physiological evaluation of the heart, Frontiers in Physiology 14 (2023) 1148717.
- [35] A. Chartsias, G. Papanastasiou, C. Wang, S. Semple, D. E. Newby, R. Dharmakumar, S. A. Tsaftaris, Disentangle, Align and Fuse for Multimodal and Semi-Supervised Image Segmentation, IEEE Transactions on Medical Imaging 40 (3) (2021) 781–792.
- [36] Y. Fu, Y. Lei, T. Wang, W. J. Curran, T. Liu, X. Yang, Deep learning in medical image registration: a review, Physics in Medicine & Biology 65 (20) (2020) 20TR01.
- [37] F. Isensee, P. F. Jaeger, S. A. A. Kohl, J. Petersen, K. H. Maier-Hein, nnU-Net: a self-configuring method for deep learning-based biomedical image segmentation, Nature Methods 18 (2) (2021) 203–211.
- [38] O. Ronneberger, P. Fischer, T. Brox, U-Net: Convolutional networks for biomedical image segmentation, in: Medical Image Computing and Computer-Assisted Intervention – MICCAI 2015, Springer International Publishing, 2015, pp. 234–241.
- [39] X. Hu, X. Xu, Y. Shi, How to Efficiently Adapt Large Segmentation Model(SAM) to Medical Images, arXiv preprint arXiv:2306.13731 (2023).
- [40] D. Caldarola, B. Caputo, M. Ciccone, Improving Generalization in Federated Learning by Seeking Flat Minima, in: Computer Vision – ECCV 2022, Springer Nature Switzerland, 2022, pp. 654–672.
- [41] A. Gu, T. Dao, Mamba: Linear-Time Sequence Modeling with Selective State Spaces, arXiv preprint arXiv:2312.00752 (2023).
- [42] A. Dosovitskiy, L. Beyer, A. Kolesnikov, D. Weissenborn, X. Zhai, T. Unterthiner, M. Dehghani, M. Minderer, G. Heigold, S. Gelly, J. Uszkoreit, N. Houlsby, An Image is Worth 16x16 Words: Transformers for Image Recognition at Scale, in: 9th International Conference on Learning Representations, ICLR 2021, Virtual Event, Austria, May 3-7, 2021, OpenReview.net, 2021.
- [43] Z. Wang, J.-Q. Zheng, Y. Zhang, G. Cui, L. Li, Mamba-UNet: UNet-Like Pure Visual Mamba for Medical Image Segmentation, arXiv preprint arXiv:2402.05079 (2024).
- [44] Z. Wang, C. Ma, Weak-Mamba-UNet: Visual Mamba Makes CNN and ViT Work Better for Scribble-based Medical Image Segmentation, arXiv preprint arXiv:2402.10887 (2024).
- [45] I. Mariam, X. Xue, K. Gadson, A Retinal Vessel Segmentation Method Based on the Sharpness-Aware Minimization Model, Sensors 24 (13) (2024).
- [46] M. Hassan, A. Vakanski, M. Xian, Do Sharpness-based Optimizers Improve Generalization in Medical Image Analysis?, arXiv preprint arXiv:2408.04065 (2024).
- [47] Y. Liu, S. Mai, M. Cheng, X. Chen, C.-J. Hsieh, Y. You, Random Sharpness-Aware Minimization, in: Advances in Neural Information Processing Systems, Vol. 35, Curran Associates, Inc., 2022, pp. 24543–24556.
- [48] T. Li, P. Zhou, Z. He, X. Cheng, X. Huang, Friendly Sharpness-Aware Minimization, in: Proceedings of the IEEE/CVF Conference on Computer Vision and Pattern Recognition (CVPR), IEEE, Seattle, 2024, pp. 5631–5640.
- [49] A. Gu, I. Johnson, K. Goel, K. Saab, T. Dao, A. Rudra, C. Ré, Combining Recurrent, Convolutional, and Continuous-time Models with Linear State-Space Layers, in: Proceedings of the 35th International Conference on Neural Information Processing Systems, NIPS ’21, Curran Associates Inc., Red Hook, NY, USA, 2024.
- [50] A. Vaswani, N. Shazeer, N. Parmar, J. Uszkoreit, L. Jones, A. N. Gomez, L. Kaiser, I. Polosukhin, Attention is all you need, Advances in neural information processing systems 30 (2017).
- [51] Z. Liu, Y. Lin, Y. Cao, H. Hu, Y. Wei, Z. Zhang, S. Lin, B. Guo, Swin Transformer: Hierarchical Vision Transformer using Shifted Windows, in: 2021 IEEE/CVF International Conference on Computer Vision (ICCV), IEEE, Montreal, QC, Canada, 2021, pp. 9992–10002.
- [52] X. Zhao, F. Chen, S. Hu, J.-H. Cho, Uncertainty Aware Semi-Supervised Learning on Graph Data, Advances in Neural Information Processing Systems 33 (2020) 12827–12836.
- [53] X. Zhao, S. Hu, J.-H. Cho, F. Chen, Uncertainty-based Decision Making Using Deep Reinforcement Learning, in: 2019 22th International Conference on Information Fusion (FUSION), IEEE, Ottawa, ON, Canada, 2019, pp. 1–8.
- [54] A. Kendall, Y. Gal, What uncertainties do we need in Bayesian deep learning for computer vision?, in: Proceedings of the 31st International Conference on Neural Information Processing Systems, NIPS’17, Curran Associates Inc., Red Hook, NY, USA, 2017, p. 5580–5590.
- [55] J. Hu, Q. Fan, S. Hu, S. Lyu, X. Wu, X. Wang, UMedNeRF: Uncertainty-Aware Single View Volumetric Rendering For Medical Neural Radiance Fields, in: 2024 IEEE International Symposium on Biomedical Imaging (ISBI), IEEE, Athens, Greece, 2024, pp. 1–4.
- [56] X. Wang, S. Hu, H. Fan, H. Zhu, X. Li, Neural Radiance Fields in Medical Imaging: Challenges and Next Steps, arXiv preprint arXiv:2402.17797 (2024).
- [57] Y. Peng, H. Chen, C. Lin, G. Huang, J. Hu, H. Guo, B. Kong, S. Hu, X. Wu, X. Wang, Uncertainty-Aware Explainable Recommendation with Large Language Models, arXiv preprint arXiv:2402.03366 (2024).
- [58] S. Hu, Y. Ying, S. Lyu, et al., Learning by Minimizing the Sum of Ranked Range, Advances in Neural Information Processing Systems 33 (2020) 21013–21023.
- [59] S. Hu, Y. Ying, X. Wang, S. Lyu, Sum of ranked range loss for supervised learning, Journal of Machine Learning Research 23 (112) (2022) 1–44.
- [60] S. Hu, X. Wang, S. Lyu, Rank-Based Decomposable Losses in Machine Learning: A Survey, IEEE Transactions on Pattern Analysis and Machine Intelligence 45 (11) (2023) 13599–13620.
- [61] J. Chen, Y. Lu, Q. Yu, X. Luo, E. Adeli, Y. Wang, L. Lu, Y. Zhou, Y. Wang, A. Yuille, TransUNet: Transformers Make Strong Encoders for Medical Image Segmentation, arXiv preprint arXiv:2102.04306 (2021).
- [62] H. Cao, Y. Wang, J. Chen, D. Jiang, X. Zhang, Q. Tian, M. Wang, Swin-Unet: Unet-Like Pure Transformer for Medical Image Segmentation, in: ECCV Workshops, Springer-Verlag, Berlin, Heidelberg, 2023, pp. 205–218.
- [63] H.-Y. Zhou, J. Guo, Y. Zhang, X. Han, L. Yu, L. Wang, Y. Yu, nnFormer: Volumetric Medical Image Segmentation via a 3D Transformer, IEEE Transactions on Image Processing 32 (2023) 4036–4045.
- [64] J. Ahrens, B. Geveci, C. Law, ParaView: An End-User Tool for Large Data Visualization, in: Visualization Handbook, Elesvier, 2005, ISBN 978-0123875822.
- [65] U. Ayachit, A. Bauer, B. Geveci, P. O’Leary, K. Moreland, N. Fabian, J. Mauldin, Paraview catalyst: Enabling in situ data analysis and visualization, in: Proceedings of the First Workshop on In Situ Infrastructures for Enabling Extreme-Scale Analysis and Visualization (ISAV 2015), 2015, pp. 25–29.
- [66] U. Ayachit, A. C. Bauer, B. Boeckel, B. Geveci, K. Moreland, P. O’Leary, T. Osika, Catalyst Revised: Rethinking the ParaView in Situ Analysis and Visualization API, in: High Performance Computing, 2021, pp. 484–494.