Vertical, Temporal, and Horizontal Scaling of Hierarchical Hypersparse GraphBLAS Matrices
Abstract
Hypersparse matrices are a powerful enabler for a variety of network, health, finance, and social applications. Hierarchical hypersparse GraphBLAS matrices enable rapid streaming updates while preserving algebraic analytic power and convenience. In many contexts, the rate of these updates sets the bounds on performance. This paper explores hierarchical hypersparse update performance on a variety of hardware with identical software configurations. The high-level language bindings of the GraphBLAS readily enable performance experiments on simultaneous diverse hardware. The best single process performance measured was 4,000,000 updates per second. The best single node performance measured was 170,000,000 updates per second. The hardware used spans nearly a decade and allows a direct comparison of hardware improvements for this computation over this time range; showing a 2x increase in single-core performance, a 3x increase in single process performance, and a 5x increase in single node performance. Running on nearly 2,000 MIT SuperCloud nodes simultaneously achieved a sustained update rate of over 200,000,000,000 updates per second. Hierarchical hypersparse GraphBLAS allows the MIT SuperCloud to analyze extremely large streaming network data sets.
Index Terms:
streaming graphs, hypersparse matrices, vertical scaling, horizontal scaling, GraphBLASI Introduction
††footnotetext: This material is based upon work supported by the Assistant Secretary of Defense for Research and Engineering under Air Force Contract No. FA8702-15-D-0001, National Science Foundation CCF-1533644, and United States Air Force Research Laboratory Cooperative Agreement Number FA8750-19-2-1000. Any opinions, findings, conclusions or recommendations expressed in this material are those of the author(s) and do not necessarily reflect the views of the Assistant Secretary of Defense for Research and Engineering, the National Science Foundation, or the United States Air Force. The U.S. Government is authorized to reproduce and distribute reprints for Government purposes notwithstanding any copyright notation herein.Streaming data plays a critical role in protecting computer networks, tracking the spread of diseases, optimizing financial markets, and ad-placement in social media. The volumes of data in these applications is significant and growing. For example, the global Internet is expected to exceed 100 terabytes per second (TB/s) creating significant performance challenges for the monitoring necessary to improve, maintain, and protect the Internet [1, 2, 3, 4, 5]. As in other applications hypersparse matrices are a natural way to represent network traffic and rapidly constructing these traffic matrix databases is a significant productivity, scalability, representation, and performance challenge [6, 7, 8, 9, 10, 11, 12, 13, 14].
The SuiteSparse GraphBLAS library is an OpenMP accelerated C implementation of the GraphBLAS.org sparse matrix standard [15, 16, 17] and makes widely available the benefits of hypersparse capabilities [18, 19, 20]. Python, Julia, and Matlab/Octave bindings allow the performance benefits of the SuiteSparse GraphBLAS C library to be realized in these highly productive programming environments. Our team has developed a high-productivity scalable platform—the MIT SuperCloud—for providing scientists and engineers the tools they need to analyze large-scale dynamic data [21, 22, 23]. The MIT SuperCloud provides interactive analysis capabilities accessible from high level programming environments (Python, Julia, Matlab/Octave) that scale to thousands of processing nodes. MIT SuperCloud maintains a diverse set of hardware running an identical software stack that allows direct comparison of hardware from different eras.
This paper builds on our prior work [24] with hierarchical hypersparse GraphBLAS matrices by more thoroughly exploring the vertical, temporal, and horizontal scaling performance of hierarchical hypersparse construction. The vertical benchmarking explores how different numbers of GraphBLAS processes and threads perform on different multicore compute nodes. The temporal benchmarking compares the performance of compute nodes from different eras. The horizontal benchmarking examines the aggregate performance achieved by running on thousands of diverse compute nodes.
II Hierarchical Hypersparse Matrices
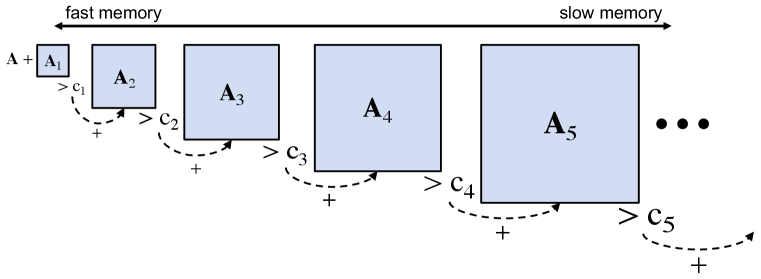
Streaming updates to a large hypersparse matrix can be accelerated with a hierarchical implementation optimized to the memory hierarchy (see Fig. 1). Rapid updates are performed on the smallest hypersparse matrices in the fastest memory. The strong mathematical properties of the GraphBLAS allow a hierarchical implementation of hypersparse matrices to be implemented via simple addition. All creation and organization of hypersparse row and column indices are handled naturally by the GraphBLAS mathematics. Hierarchical matrices are implemented with a simple heuristic. If the number of nonzero (nnz) entries in the matrix at layer exceeds the cut threshold , then is added to and is cleared. The overall usage is as follows
-
•
Initialize -level hierarchical hypersparse matrix with cuts
-
•
Update by adding new data to lowest layer
-
•
If , then
and reset to an empty hypersparse matrix of appropriate dimensions.
The above steps are repeated until or . To complete all pending updates for analysis, all the layers are added together
Hierarchical hypersparse matrices dramatically reduce the number of updates to slow memory. Upon query, all layers in the hierarchy are summed into the hypersparse matrix. The cut values can be selected so as to optimize the performance with respect to particular applications. The majority of the updating is performed by using the existing GraphBLAS addition operation. The corresponding Matlab/Octave GraphBLAS code for performing the update is a direct translation of the above mathematics as follows
function Ai = HierAdd(Ai,A,c);
Ai{1} = Ai{1} + A;
for i=1:length(c)
if (GrB.entries(Ai{i}) > c(i))
Ai{i+1} = Ai{i+1} + Ai{i};
Ai{i} = Ai{length(c)+2};
end
end
end
The goal of hierarchical arrays are to manage the memory footprint of each level, so the GraphBLAS GrB.entries() command returns the number of entries in the GraphBLAS hypersparse matrix, which may include some materialized zero values. In addition, GrB.entries() executes much faster than the GraphBLAS number of nonzeros command nnz(). The last hypersparse matrix stored in the hierarchical array is empty and is used to reinitialize layers whose entries have been cascaded to a subsequent layer.
III Computer Hardware
MIT SuperCloud maintains a diverse set of hardware running an identical modern software stack providing an unique platform for comparing performance over different eras.
![[Uncaptioned image]](https://cdn.awesomepapers.org/papers/db379e7e-6cf1-47b7-bbfb-13f924dc1e57/x2.png)
The GraphBLAS benchmarking code was implemented using the Matlab/Octave bindings with the pMatlab parallel library [26]. A typical run could be launched in a few seconds using the MIT SuperCloud triples-mode hierarchical launching system [23]. The launch parameters were [Nnodes Nprocess Nthread], corresponding to Nnodes nodes, Nprocess Matlab/Octave processes per node, and Nthread OpenMP threads per process. On each node, each of the Nprocess processes and their corresponding Nthread threads were pinned to adjacent cores to minimize interprocess contention and maximize cache locality for the GraphBLAS OpenMP threads [27]. Within each Matlab/Octave process, the underlying GraphBLAS OpenMP parallelism is used. At the end of the processing the results were aggregated using asynchronous file-based messaging [28]. Triples mode makes it easy to explore horizontal scaling across nodes, vertical scaling by examining combinations of processes and threads on a node, and temporal scaling by running on diverse hardware from different eras.
The computing hardware consists of five different types of nodes acquired over a decade (see Table I). The nodes are all multicore x86 compatible with comparable total memory. The MIT SuperCloud maintains the same modern software across all nodes, which allows for direct comparison of hardware performance differences.
IV Parameter Tuning
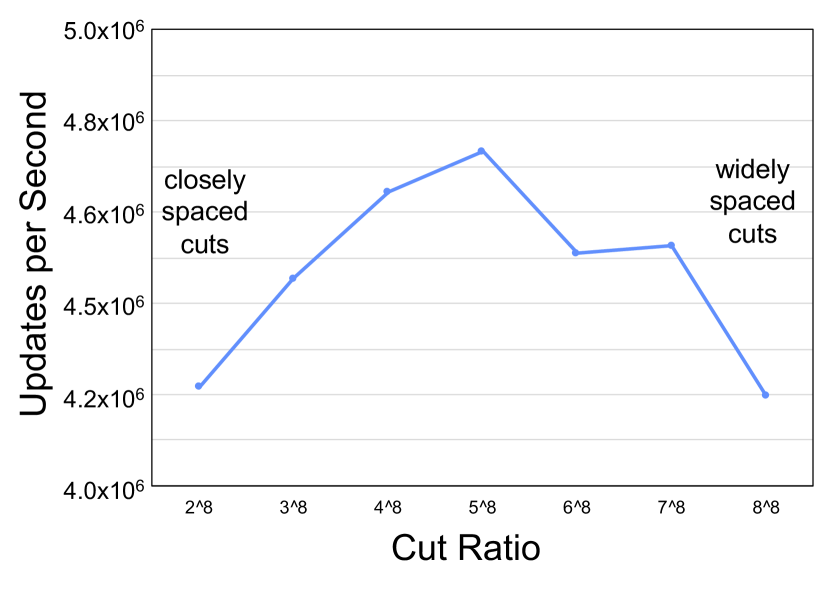
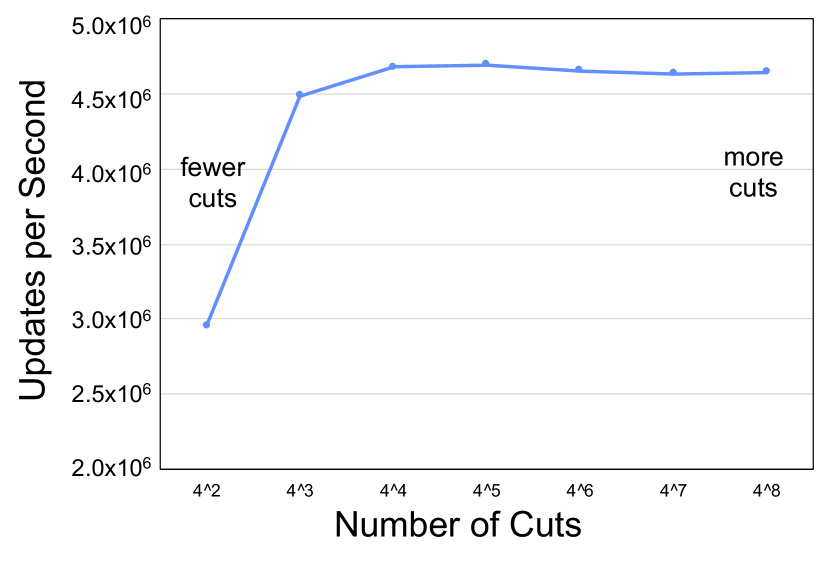
The performance of a hierarchical GraphBLAS for any particular problem is determined by the number of layers and the cut values . The parameters are tuned to achieve optimal performance for a given problem. These parameters were explored using simulated Graph500.org R-Mat power-law network data containing 100,000,000 connections that are inserted in groups of 100,000. Examples of different sets of cut values with different and different ratios between cut values are shown in Figure 2. These sets of cut values allow exploration of the update performance of closely spaced cuts versus widely spaced cuts. For both and there are fairly broad ranges of comparable optimal performance.
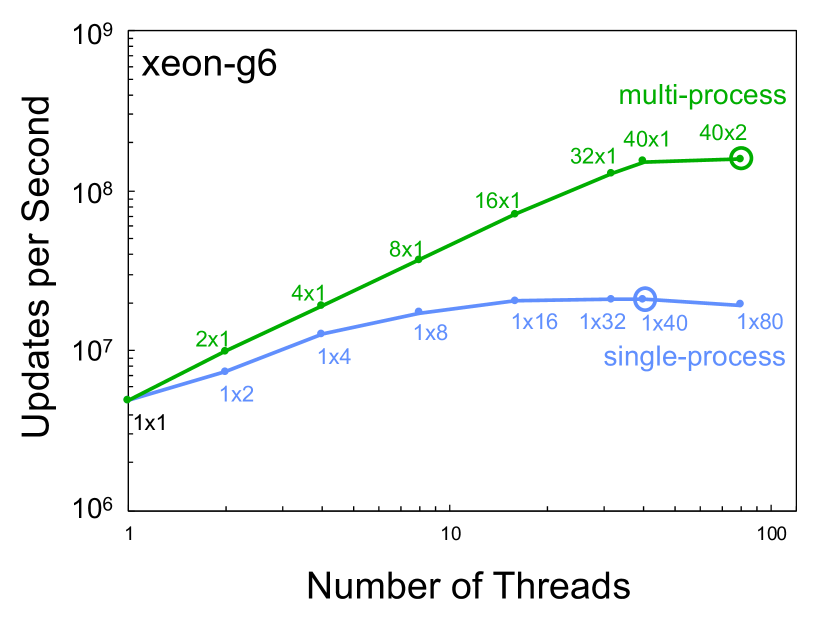
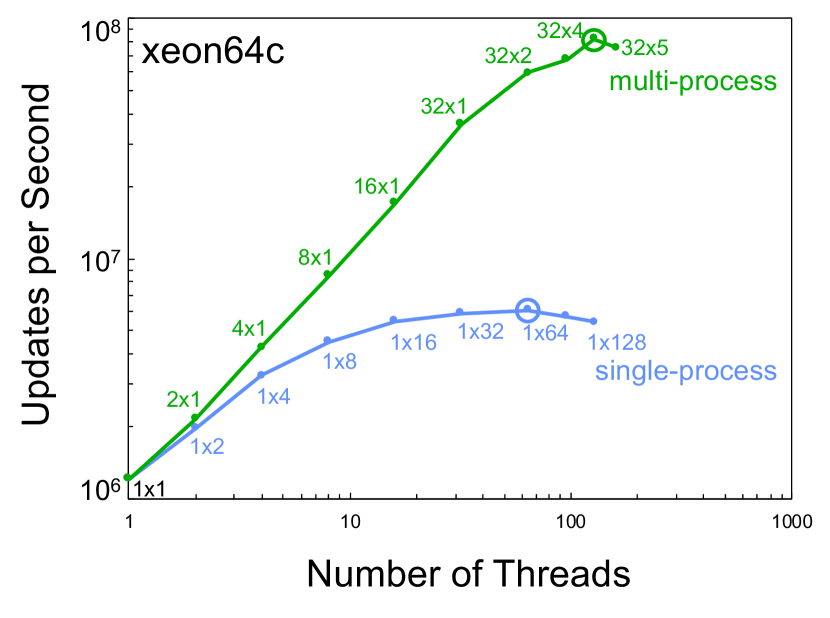
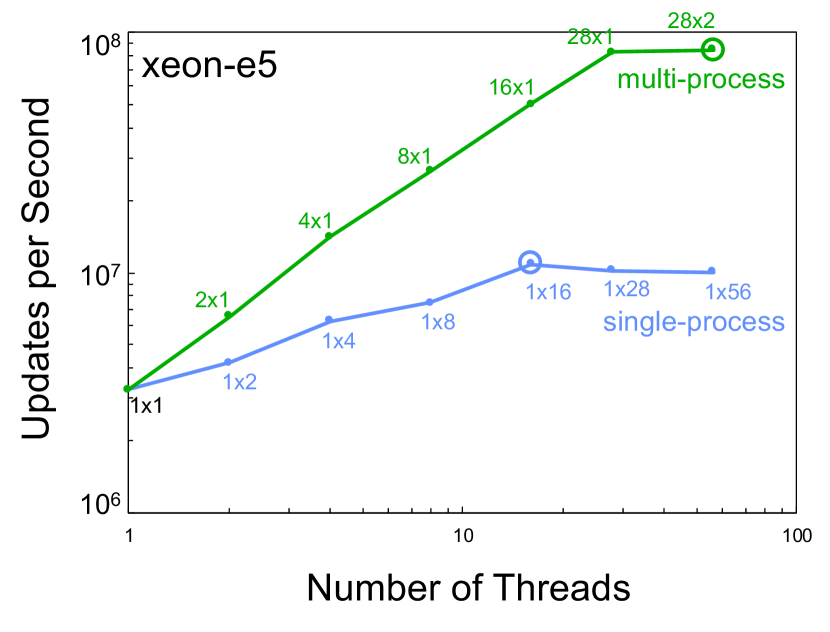
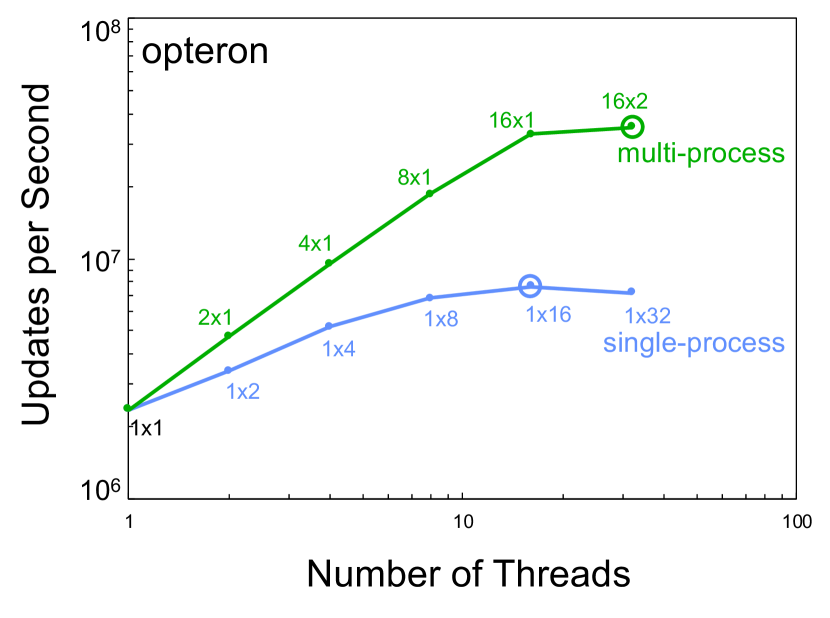
V Vertical Scaling
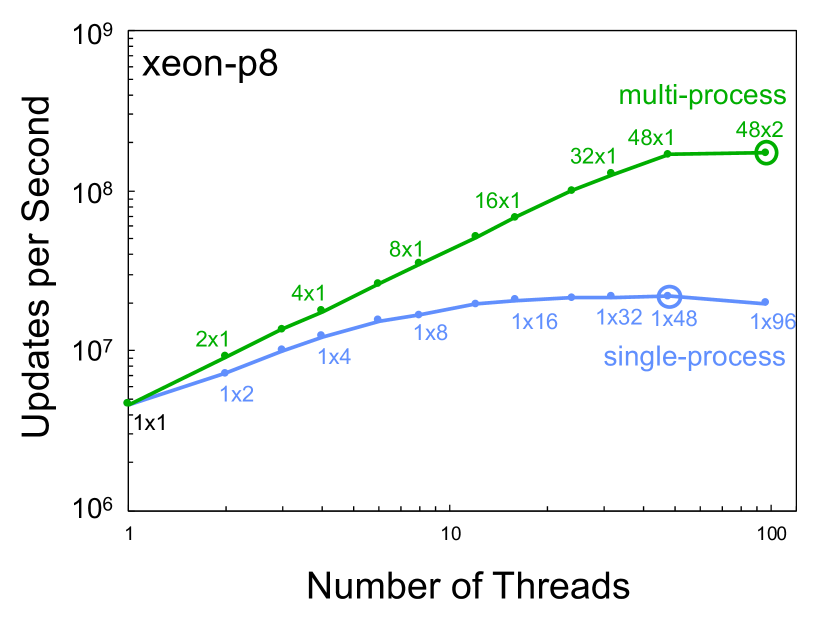
Vertical benchmarking explores how different numbers of GraphBLAS processes and threads perform on different multicore compute nodes. This type of benchmarking is generally useful in most projects as it allows the determination of the best combination processing and threads prior to significant computation. The number of processes and threads used for a given benchmark is denoted by Nprocess Nthreads whose product is equal to total number threads used in the computation. The GraphBLAS computation described in the previous section was repeated for two sets of parameters: single-process and multi-process. In the single-process case the parameters tested are
In the multi-process case the parameters tested are
Figure 3 shows the single node performance using different numbers of processes and threads for the different servers listed in Table I. In all cases, the multi-process scaling provided greater aggregate performance and the single-process scaling provided a maximum of a 4x speedup over case.
VI Temporal Scaling
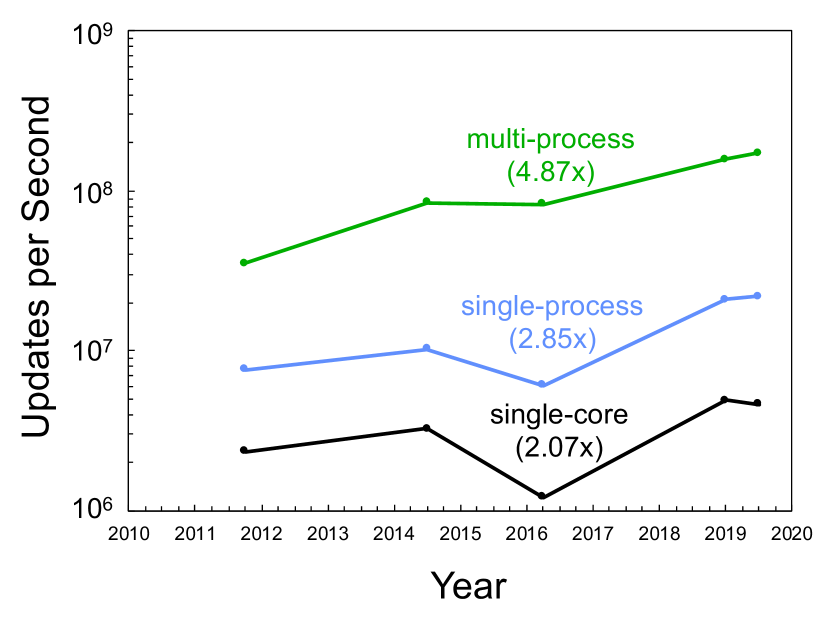
Temporal benchmarking compares the performance of computing hardware from different eras. The MIT SuperCloud provides a unique ability to directly compare hardware from different eras using exactly the same modern software stack. Figure 4 shows the single core, best single-process, and best multi-process performance taken from Figure 3 and plotted versus the year the computing hardware became available. These data show a 2x increase in single-core performance, a 3x increase in single process performance, and a 5x increase in single node performance.
VII Horizontal Scaling
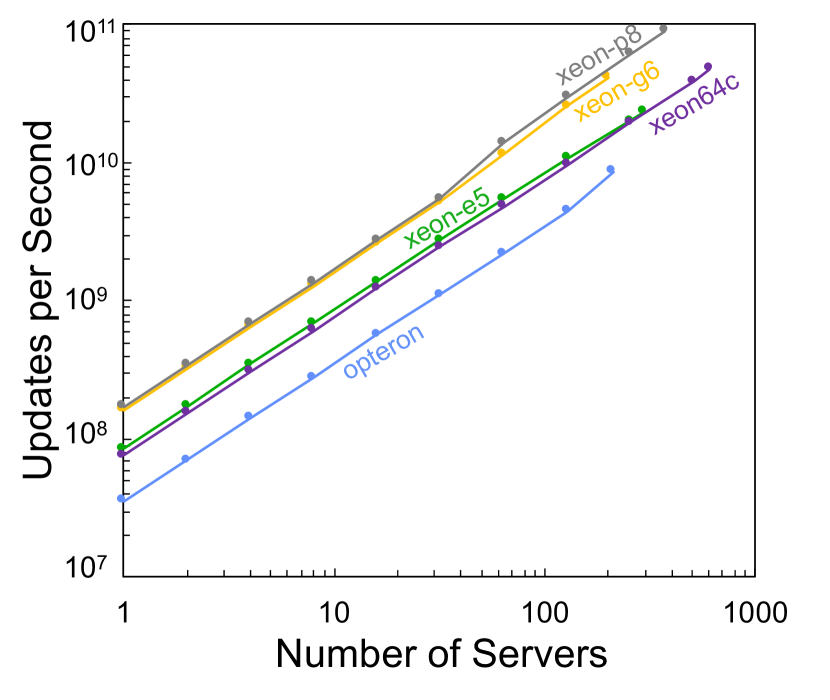
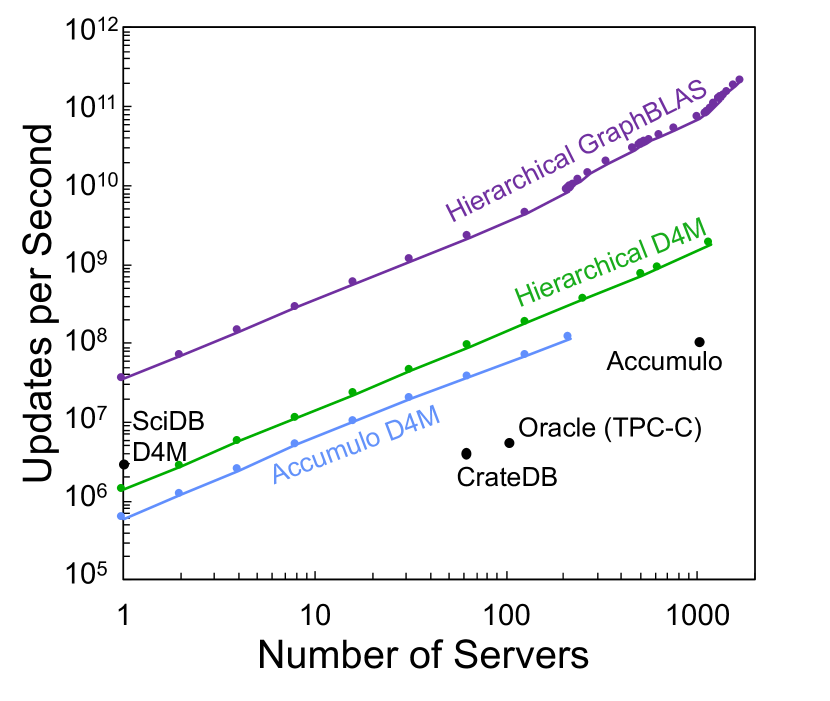
Horizontal benchmarking examines the aggregate performance achieved by running on thousands of diverse compute nodes. The scalability of the hierarchical hypersparse matrices are tested using a power-law graph of 100,000,000 entries divided up into 1,000 sets of 100,000 entries. These data were then simultaneously loaded and updated using a varying number of processes on varying number of nodes on the MIT SuperCloud. The horizontal scaling for each type of hardware is shown in Figure 5. Running on nearly two thousand MIT SuperCloud nodes simultaneously achieved a sustained update rate of over 200,000,000,000 updates per second and is shown in Figure 5 with other technologies ranging such as in-memory index stores (D4M), NoSQL (Accumulo), NewSQL (SciDB, CrateDB), and SQL (Oracle) databases. The achieved update rate of over 200,000,000,000 updates per second is significantly larger than the rate in prior published results [24]. This capability allows the MIT SuperCloud to analyze extremely large streaming network data sets.
VIII Conclusion
A variety of network, health, finance, and social applications can be enabled by hypersparse GraphBLAS matrices. Hierarchical hypersparse GraphBLAS matrices enable rapid streaming updates while preserving algebraic analytic power and convenience. The rate of these updates sets the bounds on performance in many contexts. The GraphBLAS readily enable performance experiments on simultaneous diverse hardware via high-level language bindings to Matlab/Octave, Python, and Julia. A peak single process performance was measured at over 4,000,000 updates per second. The peak single node performance measured was 170,000,000 updates per second. The diverse MIT SuperCloud hardware used spans nearly a decade shows a 2x increase in single-core performance, a 3x increase in single process performance, and a 5x increase in single node performance over this era. Running on nearly two thousand MIT SuperCloud nodes simultaneously achieved a sustained update rate of over 200,000,000,000 updates per second. Hierarchical hypersparse GraphBLAS allows the MIT SuperCloud to analyze extremely large streaming network data sets.
Acknowledgement
The authors wish to acknowledge the GraphBLAS community and the following individuals for their contributions and support: Bob Bond, Alan Edelman, Nathan Frey, Jeff Gottschalk, Tucker Hamilton, Chris Hill, Hayden Jananthan, Mike Kanaan, Tim Kraska, Charles Leiserson, Dave Martinez, Mimi McClure, Joseph McDonald, Christian Prothmann, John Radovan, Steve Rejto, Daniela Rus, Allan Vanterpool, Matthew Weiss, Marc Zissman.
References
- [1] V. Cisco, “Cisco visual networking index: Forecast and trends, 2017–2022,” White Paper, vol. 1, 2018.
- [2] H. Allcott and M. Gentzkow, “Social media and fake news in the 2016 election,” Journal of Economic Perspectives, vol. 31, no. 2, pp. 211–36, 2017.
- [3] “https://www.neosit.com/files/neos_distil_bad_bot_report_2018.pdf.”
- [4] k. claffy and D. Clark, “Workshop on internet economics (wie 2019) report,” SIGCOMM Comput. Commun. Rev., vol. 50, p. 53–59, May 2020.
- [5] J. Kepner, J. Bernays, S. Buckley, K. Cho, C. Conrad, L. Daigle, K. Erhardt, V. Gadepally, B. Greene, M. Jones, R. Knake, B. Maggs, P. Michaleas, C. Meiners, A. Morris, A. Pentland, S. Pisharody, S. Powazek, A. Prout, P. Reiner, K. Suzuki, K. Takhashi, T. Tauber, L. Walker, and D. Stetson, “Zero botnets: An observe-pursue-counter approach.” Belfer Center Reports, 6 2021.
- [6] V. G. Castellana, M. Minutoli, S. Bhatt, K. Agarwal, A. Bleeker, J. Feo, D. Chavarría-Miranda, and D. Haglin, “High-performance data analytics beyond the relational and graph data models with gems,” in 2017 IEEE International Parallel and Distributed Processing Symposium Workshops (IPDPSW), pp. 1029–1038, IEEE, 2017.
- [7] F. Busato, O. Green, N. Bombieri, and D. A. Bader, “Hornet: An efficient data structure for dynamic sparse graphs and matrices on gpus,” in 2018 IEEE High Performance extreme Computing Conference (HPEC), pp. 1–7, IEEE, 2018.
- [8] A. Yaar, S. Rajamanickam, M. Wolf, J. Berry, and U. V. Catalyurek, “Fast triangle counting using cilk,” in 2018 IEEE High Performance extreme Computing Conference (HPEC), pp. 1–7, Sep. 2018.
- [9] Y. Hu, H. Liu, and H. H. Huang, “High-performance triangle counting on gpus,” in 2018 IEEE High Performance extreme Computing Conference (HPEC), pp. 1–5, Sep. 2018.
- [10] M. Bisson and M. Fatica, “Update on static graph challenge on gpu,” in 2018 IEEE High Performance extreme Computing Conference (HPEC), pp. 1–8, Sep. 2018.
- [11] R. Pearce and G. Sanders, “K-truss decomposition for scale-free graphs at scale in distributed memory,” in 2018 IEEE High Performance extreme Computing Conference (HPEC), pp. 1–6, Sep. 2018.
- [12] S. Samsi, V. Gadepally, M. Hurley, M. Jones, E. Kao, S. Mohindra, P. Monticciolo, A. Reuther, S. Smith, W. Song, D. Staheli, and J. Kepner, “Static graph challenge: Subgraph isomorphism,” in High Performance Extreme Computing Conference (HPEC), IEEE, 2017.
- [13] E. Kao, V. Gadepally, M. Hurley, M. Jones, J. Kepner, S. Mohindra, P. Monticciolo, A. Reuther, S. Samsi, W. Song, et al., “Streaming graph challenge: Stochastic block partition,” in 2017 IEEE High Performance Extreme Computing Conference (HPEC), pp. 1–12, IEEE, 2017.
- [14] J. Kepner, C. Meiners, C. Byun, S. McGuire, T. Davis, W. Arcand, J. Bernays, D. Bestor, W. Bergeron, V. Gadepally, R. Harnasch, M. Hubbell, M. Houle, M. Jones, A. Kirby, A. Klein, L. Milechin, J. Mullen, A. Prout, A. Reuther, A. Rosa, S. Samsi, D. Stetson, A. Tse, C. Yee, and P. Michaleas, “Multi-temporal analysis and scaling relations of 100,000,000,000 network packets,” in 2020 IEEE High Performance Extreme Computing Conference (HPEC), pp. 1–6, 2020.
- [15] J. Kepner, P. Aaltonen, D. Bader, A. Buluç, F. Franchetti, J. Gilbert, D. Hutchison, M. Kumar, A. Lumsdaine, H. Meyerhenke, S. McMillan, C. Yang, J. D. Owens, M. Zalewski, T. Mattson, and J. Moreira, “Mathematical foundations of the graphblas,” in 2016 IEEE High Performance Extreme Computing Conference (HPEC), pp. 1–9, Sep. 2016.
- [16] T. A. Davis, “Algorithm 1000: Suitesparse:graphblas: Graph algorithms in the language of sparse linear algebra,” ACM Trans. Math. Softw., vol. 45, pp. 44:1–44:25, Dec. 2019.
- [17] T. A. Davis, “Graph algorithms via SuiteSparse: GraphBLAS: triangle counting and k-truss,” in 2018 IEEE High Performance extreme Computing Conference (HPEC), pp. 1–6, Sep. 2018.
- [18] A. Buluç and J. R. Gilbert, “On the representation and multiplication of hypersparse matrices,” in 2008 IEEE International Symposium on Parallel and Distributed Processing, pp. 1–11, IEEE, 2008.
- [19] J. Kepner and J. Gilbert, Graph algorithms in the language of linear algebra. SIAM, 2011.
- [20] A. Buluç and J. R. Gilbert, “Parallel sparse matrix-matrix multiplication and indexing: Implementation and experiments,” SIAM Journal on Scientific Computing, vol. 34, no. 4, pp. C170–C191, 2012.
- [21] J. Kepner, W. Arcand, W. Bergeron, N. Bliss, R. Bond, C. Byun, G. Condon, K. Gregson, M. Hubbell, J. Kurz, et al., “Dynamic distributed dimensional data model (d4m) database and computation system,” in 2012 IEEE International Conference on Acoustics, Speech and Signal Processing (ICASSP), pp. 5349–5352, IEEE, 2012.
- [22] V. Gadepally, J. Kepner, L. Milechin, W. Arcand, D. Bestor, B. Bergeron, C. Byun, M. Hubbell, M. Houle, M. Jones, et al., “Hyperscaling internet graph analysis with d4m on the mit supercloud,” in 2018 IEEE High Performance extreme Computing Conference (HPEC), pp. 1–6, IEEE, 2018.
- [23] A. Reuther, J. Kepner, C. Byun, S. Samsi, W. Arcand, D. Bestor, B. Bergeron, V. Gadepally, M. Houle, M. Hubbell, M. Jones, A. Klein, L. Milechin, J. Mullen, A. Prout, A. Rosa, C. Yee, and P. Michaleas, “Interactive supercomputing on 40,000 cores for machine learning and data analysis,” in 2018 IEEE High Performance extreme Computing Conference (HPEC), pp. 1–6, Sep. 2018.
- [24] J. Kepner, T. Davis, C. Byun, W. Arcand, D. Bestor, W. Bergeron, V. Gadepally, M. Hubbell, M. Houle, M. Jones, A. Klein, P. Michaleas, L. Milechin, J. Mullen, A. Prout, A. Rosa, S. Samsi, C. Yee, and A. Reuther, “75,000,000,000 streaming inserts/second using hierarchical hypersparse graphblas matrices,” in 2020 IEEE International Parallel and Distributed Processing Symposium Workshops (IPDPSW), pp. 207–210, 2020.
- [25] J. Kepner, V. Gadepally, L. Milechin, S. Samsi, W. Arcand, D. Bestor, W. Bergeron, C. Byun, M. Hubbell, M. Houle, M. Jones, A. Klein, P. Michaleas, J. Mullen, A. Prout, A. Rosa, C. Yee, and A. Reuther, “Streaming 1.9 billion hypersparse network updates per second with d4m,” in 2019 IEEE High Performance Extreme Computing Conference (HPEC), pp. 1–6, Sep. 2019.
- [26] J. Kepner, Parallel MATLAB for Multicore and Multinode Computers. SIAM, 2009.
- [27] C. Byun, J. Kepner, W. Arcand, D. Bestor, W. Bergeron, M. Hubbell, V. Gadepally, M. Houle, M. Jones, A. Klein, L. Milechin, P. Michaleas, J. Mullen, A. Prout, A. Rosa, S. Samsi, C. Yee, and A. Reuther, “Optimizing xeon phi for interactive data analysis,” in 2019 IEEE High Performance Extreme Computing Conference (HPEC), pp. 1–6, 2019.
- [28] C. Byun, J. Kepner, W. Arcand, D. Bestor, B. Bergeron, V. Gadepally, M. Houle, M. Hubbell, M. Jones, A. Klein, P. Michaleas, J. Mullen, A. Prout, A. Rosa, S. Samsi, C. Yee, and A. Reuther, “Large scale parallelization using file-based communications,” in 2019 IEEE High Performance Extreme Computing Conference (HPEC), pp. 1–7, 2019.
- [29] J. Kepner, W. Arcand, D. Bestor, B. Bergeron, C. Byun, V. Gadepally, M. Hubbell, P. Michaleas, J. Mullen, A. Prout, A. Reuther, A. Rosa, and C. Yee, “Achieving 100,000,000 database inserts per second using accumulo and d4m,” in High Performance Extreme Computing Conference (HPEC), IEEE, 2014.
- [30] S. Samsi, L. Brattain, W. Arcand, D. Bestor, B. Bergeron, C. Byun, V. Gadepally, M. Hubbell, M. Jones, A. Klein, et al., “Benchmarking scidb data import on hpc systems,” in High Performance Extreme Computing Conference (HPEC), pp. 1–5, IEEE, 2016.
- [31] R. Sen, A. Farris, and P. Guerra, “Benchmarking apache accumulo bigdata distributed table store using its continuous test suite,” in Big Data (BigData Congress), 2013 IEEE International Congress on, pp. 334–341, IEEE, 2013.
- [32] CrateDB, “Big Bite: Ingesting Performance of Large Clusters.” https://crate.io/a/big-cluster-insights-ingesting/, 2016. [Online; accessed 01-December-2018].