Visual Orbits of Wolf-Rayet Stars II: The Orbit of the Nitrogen-Rich WR Binary WR 138 measured with the CHARA Array
Abstract
Classical Wolf-Rayet stars are descendants of massive OB-type stars that have lost their hydrogen-rich envelopes, and are in the final stages of stellar evolution, possibly exploding as type Ib/c supernovae. It is understood that the mechanisms driving this mass-loss are either strong stellar winds and or binary interactions, so intense studies of these binaries including their evolution can tell us about the importance of the two pathways in WR formation. WR 138 (HD 193077) has a period of just over 4 years and was previously reported to be resolved through interferometry. We report on new interferometric data combined with spectroscopic radial velocities in order to provide a three-dimensional orbit of the system. The precision on our parameters tend to be about an order of magnitude better than previous spectroscopic techniques. These measurements provide masses of the stars, namely and . The derived orbital parallax agrees with the parallax from Gaia, namely with a distance of 2.13 kpc. We compare the system’s orbit to models from BPASS, showing that the system likely may have been formed with little interaction but could have formed through some binary interactions either following or at the start of a red supergiant phase, but with the most likely scenario occurring as the red supergiant phase starts for a star.
1 Introduction
Classical Wolf-Rayet (WR) stars are evolved massive stars that are core helium-burning and have lost their hydrogen-rich envelope. These stars were first observed at the Paris Observatory by Wolf & Rayet (1867). There are two evolutionary pathways to create these stars, through single-star or binary-star evolution. In the single star evolutionary pathway, the star lost its envelope through a strong stellar wind in what is now often called the “Conti scenario” (Conti, 1975). This scenario has strong stellar winds throughout the main-sequence lifetime followed by potential eruptions during a luminous blue variable stage leading to the observed WR star. This scenario may be dominant in some environments, as is evidenced in the recent study of WR stars in the SMC (Schootemeijer et al., 2024).
The second scenario involves the WR star being formed through interactions with a companion star. In this scenario, the WR star progenitor evolved to fill its Roche lobe and then was stripped of its outer envelope. Recent multiplicity surveys of massive stars have shown that a vast majority of O stars are formed in systems where Roche lobe overflow or mergers may occur for 75% of O stars (Sana et al., 2012, 2013, 2014). This formation mechanism is likely to dominate for WR stars in orbits with periods shorter than 1 year. However, the exact binary separation or period where the formation channel has to be either through stellar winds with larger separations or binary interactions with smaller orbits remains somewhat ambiguous. For example, Thomas et al. (2021a) studied the massive binary WR 140 to measure a precise orbit with long-baseline interferometry and optical spectroscopy and compared the results to models from the Binary Population and Spectral Synthesis model grid to show that the WR star in that system formed primarily through mass-loss in the stellar winds. Despite a long 7.93-yr period and a high eccentricity of 0.8993, there was still a moderate amount of mass lost or transferred through binary interactions to form the current system, where the eccentricity could have been the byproduct of imparted “kicks” near periastron like the models of Sepinsky et al. (2007b).
Short-period WR binaries are readily studied with photometric, spectroscopic, and polarimetric techniques. However, the amplitudes of variability for all of these techniques become increasingly smaller with longer-period systems. Long-baseline interferometry offers the capabilities of resolving the individual stars moving about each other in longer-period WR binaries that are within 2-3 kpc. Recently, Richardson et al. (2021) demonstrated that the technique of interferometry could resolve an orbit smaller than 1 mas in separation with the CHARA Array with the first visual orbit of the nitrogen-rich WR binary WR 133 (WN5oO9I; the “o” suffix denotes no measurable hydrogen in the WR spectrum). Richardson et al. (2016a) resolved two other WR binaries with the CHARA Array, but those observations represent a single epoch and not full orbits. Further observations of WR 137 have resolved the orbit and helped describe the geometry of the dust formation in the binary (Richardson et al., submitted).
This paper revisits WR 138 (HD 193077; WN5o+O9V) which was resolved by Richardson et al. (2016a) with the CHARA Array. It is one of eight relatively bright WR stars () located in the constellation Cygnus. Although absorption lines in the spectrum of WR 138 have been recognized by (Hiltner, 1945), the system’s multiplicity remained a topic of debate until recently. Massey (1980) determined that there was no orbital motion for emission lines with an amplitude larger than 30 km s-1 over a period of six months during his studies of WR stars with absorption lines present. This led him to suggest that the broad absorption lines, which have an estimated km s-1, were intrinsic to the WN star itself and not formed in the atmosphere of a companion O star.
Lamontagne et al. (1982) collected a more extensive set of photographic spectra and then performed a period search and adopted a period of 2.32380.0001 days as the period of the WN suggested that WR 138 is a triple system consisting of the WN6 star orbited by an unseen companion star, potentially a neutron star, every 2.32 days. Both of these objects are orbiting a fainter, rapidly rotating, late-O type main-sequence star every 1763 days. Following this analysis, Annuk (1990) collected additional spectra of the system. They found no evidence of the short period suggested by Lamontagne et al. (1982) and found that the star was a binary with the OB star in a wide orbit with a period of 1538 d (4.2 yr). These results were confirmed by Palate et al. (2013), who studied both optical and X-ray data on the system.
Richardson et al. (2016a) resolved WR 138 into a binary system using band CHARA interferometry, deriving a wide separation of 12.4mas, marking the first time a WN binary was resolved with interferometry. They suggested that the system might have gone through a previous mass-transfer episode, which created the WR star and presented a spectral model of the system using the non-LTE code PoWR, measuring the mass-loss rates and properties of the two stars in the system. Inspired by the stars being resolved with CHARA, Rauw et al. (2023) examined spectra taken of the system spanning nearly three orbits. They also confirmed that there is no signal in the radial velocity time series at frequencies around the 2.3238 day period found by Lamontagne et al. (1982). After analyzing the results provided by Richardson et al. (2016a), Rauw et al. (2023) identified discrepancies between the CHARA observations and their own spectroscopic radial velocity solution. They suggested that the secondary star resolved through interferometry was not responsible for the orbital motion of the WN6o star with a period of 1559 days, but rather the interferometric companion was a putative third component that does not undergo significant RV variations.
The aim of our study is to better characterize the WR 138 binary system, determining the orbital parameters and masses of both stars through a combination of spectroscopy and new interferometry from the CHARA Array. We present the observations in Section 2, along with our astrometric and spectroscopic measurements in Section 3. Then, in Section 3, we present the 3-dimensional orbit. We discuss our results in Section 4 and conclude this study in Section 5.
2 Observations
2.1 Long-baseline infrared interferometry with the CHARA Array
Following the tentative detection of the resolved binary by Richardson et al. (2016a), we began a long-term program with the CHARA Array (ten Brummelaar et al., 2005) to measure the orbital motion of the system with long-baseline interferometry. We collected data with the CLIMB beam combiner (ten Brummelaar et al., 2013) both with the observations reported by Richardson et al. (2016a) taken in 2013 August and on three additional epochs in 2018 June, July, and August. These new CLIMB measurements, as well as the data published by Richardson et al. (2016a) suffer from poor coverage and limited measurements of the squared visibility () and closure phases ().
In 2019, our program began using measurements with the Michigan InfraRed Combiner - eXeter (MIRC-X) beam combiner on the CHARA Array (Anugu et al., 2020). This instrument utilizes up to all six telescopes of the Array and was an upgrade to the four- and then six-telescope combiner MIRC (Monnier et al., 2006; Che et al., 2012). MIRC-X was used with the PRISM50 mode, allowing for 8 spectral channels across the band, with a spectral resolving power of . Often the spectral channels at the edges of the band are rejected due to low signal-to-noise, meaning we end up with 6 spectral channels in each data-set. Unlike the CLIMB data, the coverage was much improved with a single observation and the resulting measurements of and of exceptional quality resulting in measurements of the separation and position angle with precision close to 10 as (see Section 3).
In August 2021, the CHARA Array commissioned a second six-telescope beam combiner, the Michigan Young Star Imager at CHARA (MYSTIC; Setterholm et al., 2023). MYSTIC observes in the -band and operates simultaneously with MIRC-X. We used MYSTIC in PRISM49 mode, providing 11 spectral channels across the band with a spectral resolving power of . Similarly to MIRC-X, the channels at the edges of the bandpass are often rejected, leaving us with nine useful wavelength channels across the band.
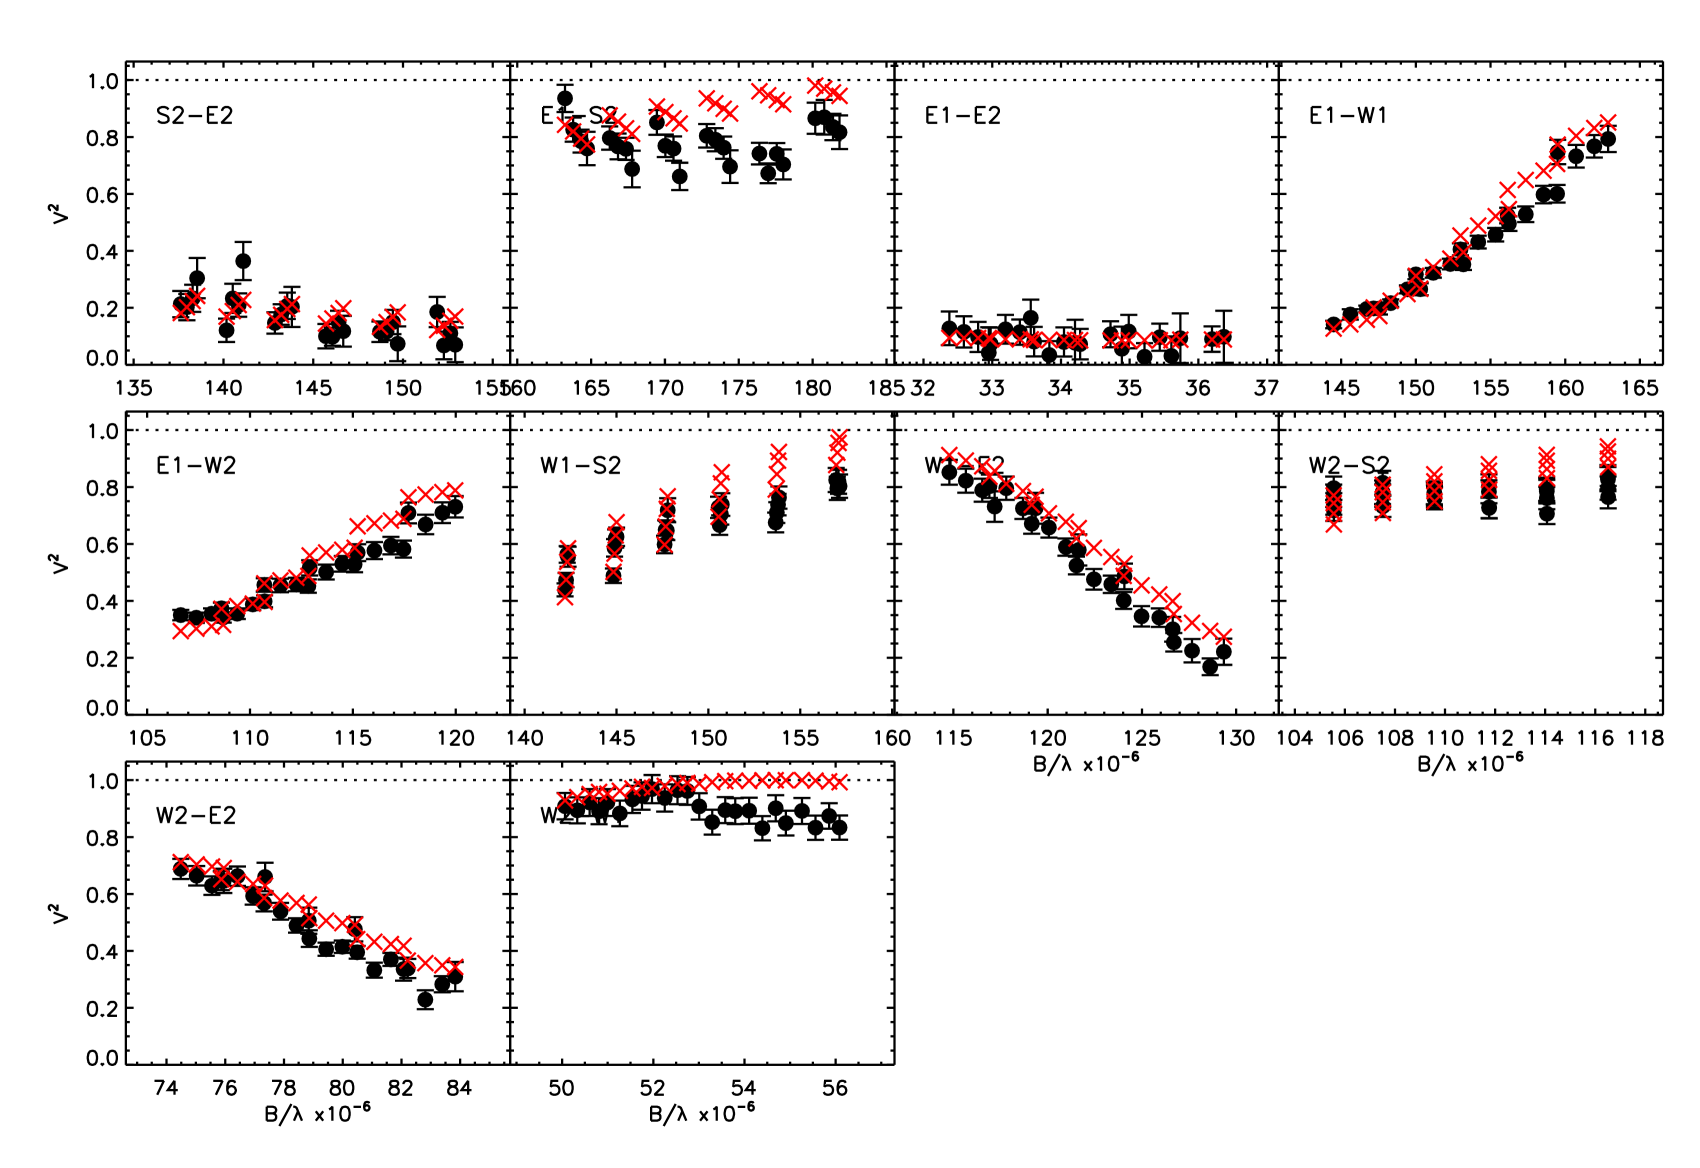
All MIRC-X and MYSTIC data were reduced using the pipeline111https://gitlab.chara.gsu.edu/lebouquj/mircx_pipeline (version 1.3.3–1.3.5) developed by Jean-Baptiste Le Bouquin and the MIRC-X team (Le Bouquin et al., 2024), which splits each 10-minutes data sequence into four 2.5-minute bins. These reductions produce squared visibilities () for each baseline and s for each closed triangle of telescopes. The use of 6 telescopes simultaneously allows for measurements of the squared visibility across 15 baselines with a simultaneous measurement of 20 different closure phases. We show the calibrators used and their diameters in Table 1.
| Calibrator star | (mas) | (mas) | 2019 Jul 01 | 2019 Jul 02 | 2019 Sep 5 | 2021 Aug 02 |
|---|---|---|---|---|---|---|
| HD 178538 | 0.248715 | 0.249373 | ||||
| HD 191703 | 0.218459 | 0.219038 | ||||
| HD 192536 | 0.166190 | 0.166553 | ||||
| HD 201614 | 0.317421 | 0.318844 | ||||
| HD 197176 | 0.241453 | 0.242173 | ||||
| HD 192732 | 0.400280 | 0.402075 | ||||
| (continued) | 2021 Oct 22 | 2022 Jul 19 | 2022 Aug 23 | 2023 Jun 03 | 2023 Aug 14 | |
| HD 178538 | ||||||
| HD 191703 | ||||||
| HD 192536 | ||||||
| HD 201614 | ||||||
| HD 197176 | ||||||
| HD 192732 |
For each MIRC-X/MYSTIC night, we compared the calibrators against each other and found no evidence for binarity after visually inspecting the data, allowing us to know that our calibrations and subsequent binary measurements were of high quality. We applied wavelength correction factors by dividing the wavelengths in the MIRC-X OIFITS files by a factor of 1.0054 0.0006 and those in the MYSTIC OIFITS files by 1.0067 0.0007 (Gardner et al., 2022, Monnier, priv. comm).
2.2 Spectroscopy
Many of our spectroscopic measurements were taken from previously published data for the orbit of the system. Our team has also collected spectra from the Dominican Astronomical Observatory 1.8-m telescope (DAO), with a resolving element of 1.33 angstroms over a span of approximately 27 years. Unfortunately, the resolving power of near blaze maximum (Å), yielded measurements that were not precise enough to better constrain the orbital motion and hence not used here. We also used the Keck observatory and the Echellette Spectrograph and Imager (ESI; Sheinis et al., 2002). These data were taken over a range of three years. These four spectra have a resolving power of nearly 10,000, with a typical signal-to-noise ratio (SNR) of 120. To better constrain the motion of both stars, we also used the data from Dsilva et al. (2022), which has a resolving power of and a typical SNR of 75. We summarize our spectroscopic measurements in Table 2. We did not use the more limited data sets reported by Massey (1980) or Lamontagne et al. (1982) due to their coverage not spanning a full orbit of the system, along with the photgraphic plate measurements having larger errors. The measurements from Annuk (1990) did not include details like resolving power or the full wavelength range, where it is just listed as “blue” but the emission line kinematics were from N IV 4057 and He II 4686.
| Telescope | Spectrograph | Resolving | Wavelength | Date Range | Ref. | |
|---|---|---|---|---|---|---|
| Power | Range () | (HJD-2440000) | ||||
| Tartu 1.5 m | Cassegrain | … | 73 | … | 4485.371 - 7029.470 | Annuk (1990) |
| Mercator 1.2 m | HERMES | 40 | 4000 - 9000 | 16126.456 - 19024.6 | Dsilva et al. (2022) | |
| OHP | Aurélie | 8 | 4448 - 4886 | 15827.801 - 19853.787 | Rauw et al. (2023) | |
| TIGRE | HEROS | 37 | 3760 - 8700 | 17508.938 - 20043.958 | Rauw et al. (2023) | |
| KECK | ESI | 4 | 5200 - 6000 | 19024.106 - 20150.093 | This paper |
3 Measurements and determination of the orbit
3.1 Astrometric measurements with the CHARA Array
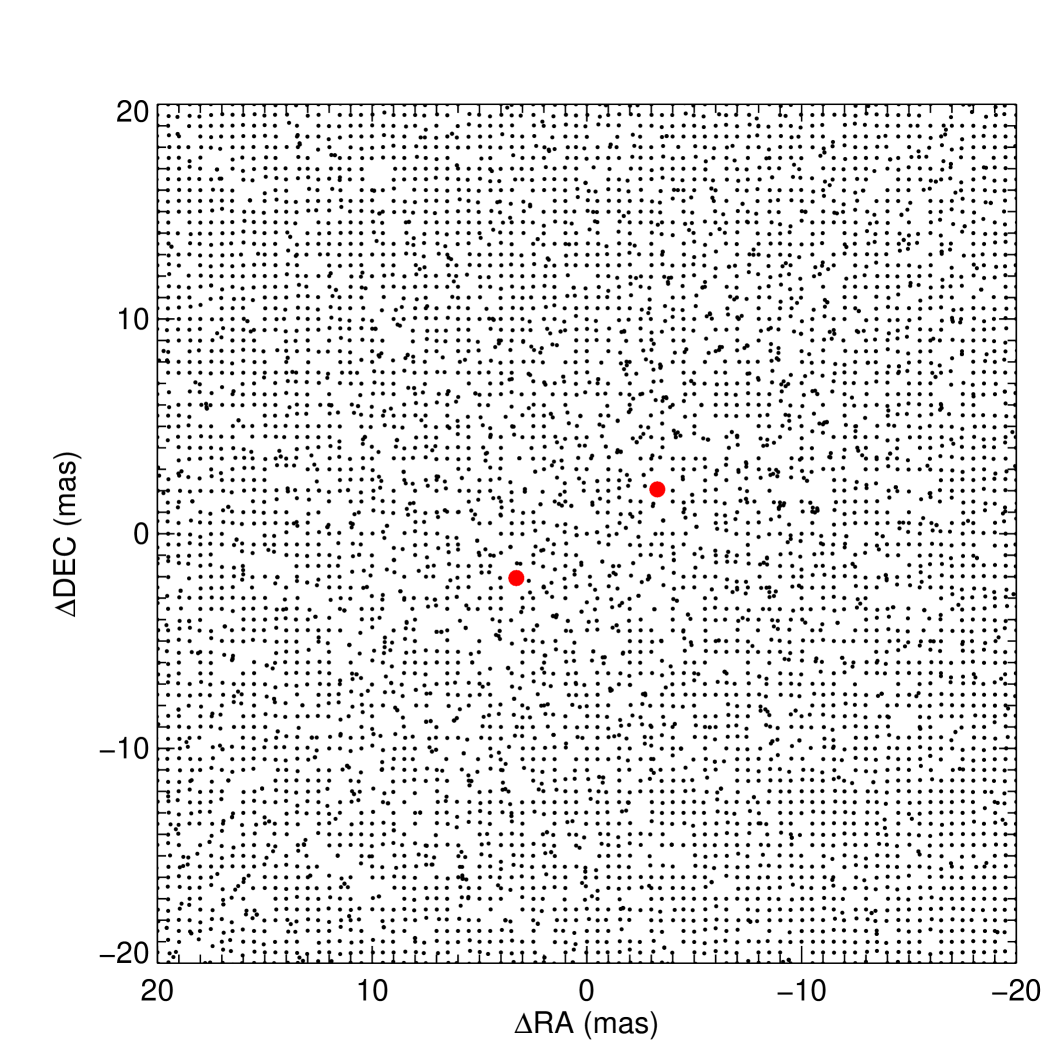
We follow the procedures developed by Schaefer et al. (2016) to fit the interferometric measurements of WR 138 made with the CHARA Array, as has been done in past orbits of WR stars measured with CHARA (Richardson et al., 2016a, 2021; Thomas et al., 2021b). The binary positions are fitted using a grid-search code222The code is available at https://www.chara.gsu.edu/analysis-software/binary-grid-search/.. This code uses both and , which helps to remove a 180∘ ambiguity from the position angle. The visibility amplitudes measure the size and shape of the source, while the closure phases are sensitive to asymmetries in the light distribution. Both the and are used to measure the binary separation and flux ratio. With each fit, there are two options based on whether we have the brighter or fainter star as the central star. The approach calculates a statistic for the data based on a binary model for a large grid of separations in right ascension and declination. At each step in the grid, the IDL mpfit package (Markwardt, 2009) is used to optimize the binary position and flux ratio between the two stars. The global minimum across the grid is selected as the best fit solution. We did a thorough search by varying the separations in increments of 0.5 mas across a range of mas in the directions of both RA and DEC. The resulting plots are shown in a figure set in the appendix. The maps for the CLIMB data had many local minima and were not consistent with the measurements made with MIRC-X and MYSTIC and thus we did not include them in our analysis. Furthermore, this can explain the inconsistencies pointed out by Rauw et al. (2023). Our measured separations, position angles, error ellipses, and flux ratios are presented in Table 3.
| UT Date | HJD | Filter | Position | Separation | Comb. | |||||
|---|---|---|---|---|---|---|---|---|---|---|
| 2,400,000 | Angle (∘) | (mas) | (mas) | (mas) | (∘) | |||||
| 2019 July 1 | 58665.772 | 122.161 | 3.8777 | 0.0208 | 0.0134 | 1.29 | 0.65 | 0.35 | M | |
| 2019 July 1 | 58665.972 | 122.405 | 3.902 | 0.0083 | 0.0049 | 139.78 | 0.63 | 0.37 | M | |
| 2019 July 2 | 58666.807 | 122.577 | 3.9013 | 0.0102 | 0.0081 | 146.34 | 0.63 | 0.37 | M | |
| 2019 July 2 | 58666.995 | 122.666 | 3.9041 | 0.0093 | 0.0051 | 49.33 | 0.61 | 0.39 | M | |
| 2019 September 5 | 58731.867 | 124.337 | 3.8757 | 0.0095 | 0.0046 | 70.78 | 0.65 | 0.35 | M | |
| 2021 August 2 | 59428.887 | 306.829 | 4.1585 | 0.0079 | 0.0051 | 52.47 | 0.62 | 0.38 | M | |
| 2022 July 19 | 59779.982 | 346.235 | 0.7356 | 0.0076 | 0.0042 | 62.21 | 0.64 | 0.36 | M | |
| 2022 July 19 | 59779.982 | 347.508 | 0.726 | 0.0088 | 0.0035 | 77.66 | 0.69 | 0.32 | Y | |
| 2022 August 23 | 59814.812 | 28.815 | 0.4985 | 0.0090 | 0.0039 | 95.25 | 0.59 | 0.41 | M | |
| 2022 August 23 | 59814.812 | 30.42 | 0.5233 | 0.0176 | 0.0109 | 92.08 | 0.65 | 0.35 | Y | |
| 2023 June 3 | 60098.817 | 119.549 | 3.4243 | 0.0074 | 0.0032 | 129.21 | 0.64 | 0.36 | M | |
| 2023 June 3 | 60098.817 | 119.595 | 3.4272 | 0.0213 | 0.0141 | 136.16 | 0.70 | 0.30 | Y | |
| 2023 August 14 | 60170.768 | 121.824 | 3.8397 | 0.0079 | 0.0053 | 119.48 | 0.66 | 0.34 | M | |
| 2023 August 14 | 60170.768 | 121.731 | 3.832 | 0.0095 | 0.0072 | 112.47 | 0.70 | 0.30 | Y |
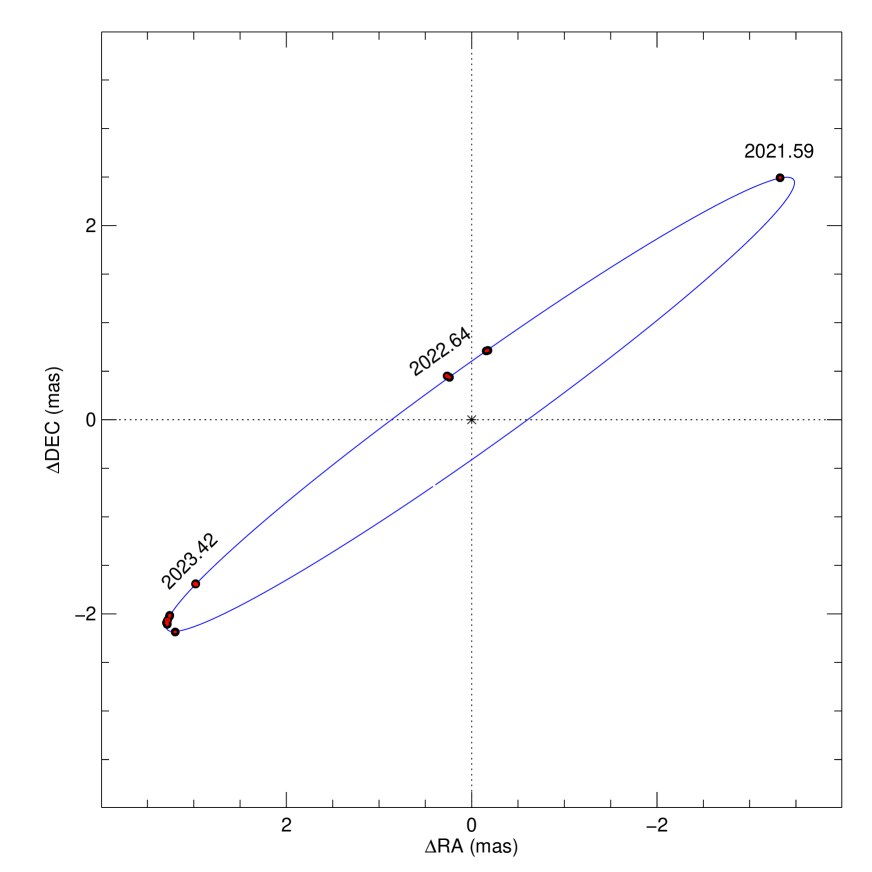
From these measurements, we were able to fit a visual orbit following the procedures333Available at http://www.chara.gsu.edu/analysis-software/orbfit-lib of Schaefer et al. (2006, 2016). With the formal errors from the binary position fits, we found an orbit with a period of 1529.31.5 d, , mas, and an inclination of 84.210.05∘. The reduced statistic from this fit had a value of 5.37, so we scaled the uncertainties to have a visual orbit fit have a reduced statistic of unity to help account for systematic errors in our data. We report these scaled error ellipses in Table 3.
3.2 Spectroscopic Measurements
In order to best fit the orbit of WR 138, we also wanted to incorporate the spectroscopic measurements of the stars into our fit. We began by trying a combined fit of the SB2 and visual orbit with the velocities from Rauw et al. (2023). We found that the low-amplitude values of the O star caused the orbit fitting routines to produce results that were not fitting the orbit compared with those of either Rauw et al. (2023) or our visual orbit. Given Rauw et al. (2023) did not fit an SB2 directly, but rather fit the WR component and then used a linear regression of the velocities of the two stellar components to infer a mass ratio in the system. This is justified here as the noise in the radial velocities of the O star measurements is large enough to prevent a good fit to the O star velocities. Therefore, we began our work by doing a visual and SB1 (Wolf-Rayet component) combined fit with the WR velocities reported by Rauw et al. (2023).
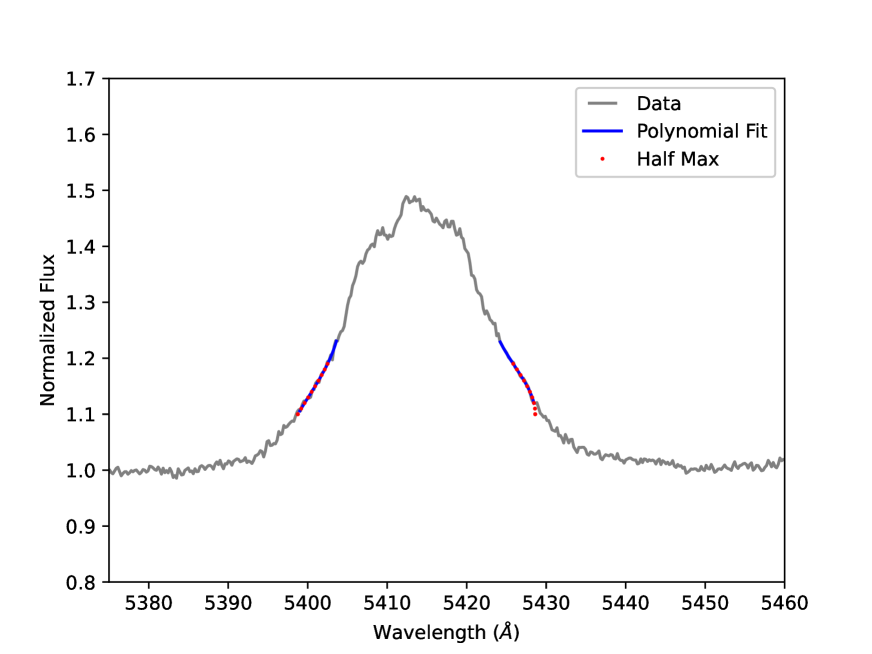
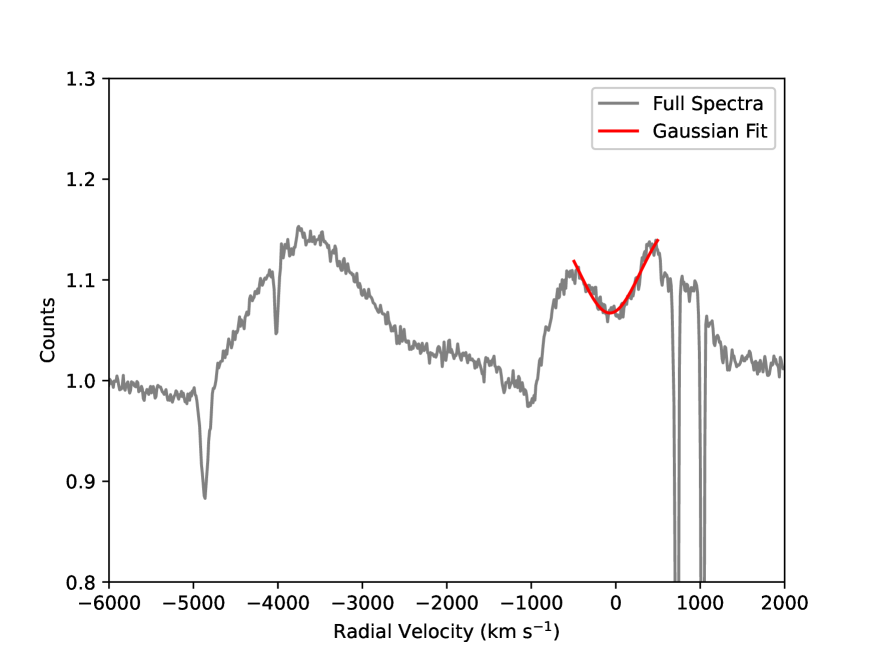
Once this orbital fit was successful, we combined in other data sets. In addition to the data from Rauw et al. (2023), we measured the spectra from Dsilva et al. (2022) and included the measurements of Annuk (1990). We also used the spectra we collected with Keck and the ESI. To measure the WR star’s velocity, we used the bisector technique for emission lines that has been used for many WR stars, with methods and code documented recently by Strawn et al. (2023). We show the bisector of an example spectrum around He II in Fig. 1. The O star’s velocities were measured using a Gaussian fit to the He I line, on the absorption between the radial velocity range of -500 and 500 km s (also shown in Fig. 1). We used the dispersion of the velocities in the interstellar Na I D lines to gauge the accuracy and precision of the wavelength calibrations of each spectrum.
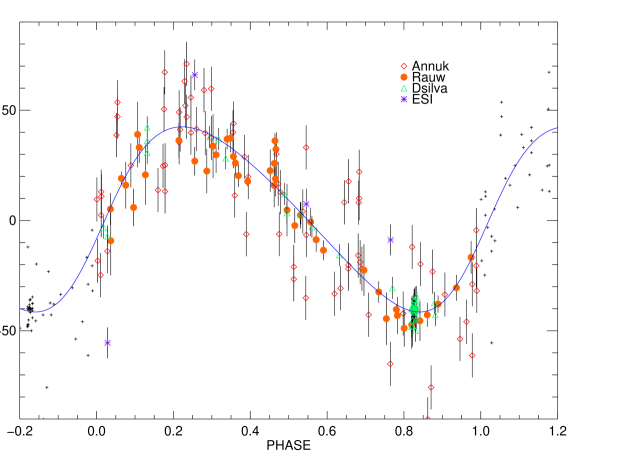
We found that the combined visual and single-lined spectroscopic fit still had a large scatter in the radial velocity orbit. In order to minimize the scatter, we used the derived orbital parameters to fit each subset of spectra with the same orbital elements varying only the -velocity. We then adjusted each subset of spectra to have the same -velocity of the data from Rauw et al. (2023). A third body could explain a change in the -velocity, but each dataset was measured differently and WR stars are difficult to measure radial velocities to high precision. Therefore, we do not report a -velocity in Table 4. With this larger dataset of spectroscopy, we were able to do a combined fit of the visual and spectroscopic orbit of the WR star. The orbital elements are presented in Table 4 and the fits are shown in Fig. 2. We compare the orbital elements of both Annuk (1990) and Rauw et al. (2023) in Table 4, which shows both our higher precision and highlights our ability to measure properties of the orbit such as the inclination and hence stellar masses.
| Measured Quantities | |||
|---|---|---|---|
| Orbital Element | Value | Annuk (1990) | Rauw et al. (2023) |
| (d) | 1527.99 1.01 | 1538 | 155314 |
| (yr) | 4.18 0.003 | 4.21 | 4.250.04 |
| (MJD) | 52868.62 4.98 | 4528439 | 5734366 |
| (yr) | 2003.629 0.013 | 1982.860.11 | 2015.880.18 |
| 0.191 0.0046 | 0.290.05 | 0.150.04 | |
| (mas) | 4.17 0.0087 | ||
| 84.21 0.06 | |||
| (∘) | 124.32 0.05 | ||
| (∘) | 258.00 0.36 | 27112 | 23316 |
| (km s-1) | 41.95 0.904 | 30.61.9 | |
| Derived Quantities | |||
| Quantity | Fit | ||
| () | 13.93 1.49 | ||
| () | 26.28 1.71 | ||
| (AU) | 5.81 0.125 | ||
| (AU) | 3.08 0.188 | ||
| (pc) | 2131.97 54.38 | ||
| Parallax (mas) | 0.469 0.012 | ||
To obtain a full three-dimensional orbit, we needed the semi-amplitude of the O star’s orbit as well. We compared the O and WR star velocities and performed a linear regression between them. These results showed that which is an identical result as that of Rauw et al. (2023), which is unsurprising as the majority of the data were also presented by Rauw et al. (2023).
With the orbital elements and the assumed semi-amplitude of the O star from the mass ratio, we were able to then infer masses for the O and WR stars to be 26.3 and 13.9 respectively, with errors shown in Table 4. The resulting orbital parallax is 0.469 mas, corresponding to a distance of 2.1320.054 kpc. We note that the distance according to the Bayesian inference of the Gaia EDR3 measurements is 2.134 kpc according to Bailer-Jones et al. (2021), providing confidence in our results.
4 Discussion
With our orbit, we can begin to explore the system and how it relates to other WR and O stars. We will begin the comparisons by examining how the system compares to other WN+O binaries as well as the masses from theoretical expectations. The Wolf-Rayet star in WR 138 has the same spectral type as the only other WN star with a visual orbit, WR 133 (Richardson et al., 2021), namely WN5o. In the WR 133 system, Richardson et al. (2021) found the mass of the WN star was 9.31.6 , which is considerably smaller than the WR star in WR 138 measuring 13.91.5 .
A better comparison to WN stars with measured masses could be made with short-period binaries with either geometric or wind eclipses. The largest sample of somewhat similar spectral types of WN stars is in the photometric analysis of Lamontagne et al. (1996), who modeled the wind eclipses in a sample of eleven short-period systems. The wind eclipses are caused by electon scattering as the WR star passes in front of the O star, with the ionized wind of the WR star having the free electrons to scatter the light of the O star. The resulting ‘v’-shaped eclipses are then dependent on orbital parameters measured from spectroscopy (e.g., , , ), along with the mass-loss rate of the WR star (free electrons), and the orbital inclination. In the cases of the WN4 and WN6 stars measured by Lamontagne et al. (1996), they had masses in the range of 15–19 , which is quite similar to our measurement of 13.9 .
We can also use the spectroscopic model for the system reported by Richardson et al. (2016a). With the modeled parameters, we can then use mass-luminosity relations such as those of Gräfener et al. (2011), which would place the WR star at 12.8 0.5 , close to that of our measurement. We do caution that this value is dependent on the luminosity of the star, which Richardson et al. (2016a) placed at a distance of 1.38 kpc, but our visual orbit and the Gaia measurements have both placed at a distance of 2.1 kpc. It is beyond the scope of this paper to recalculate the spectroscopic models of the system, but the general agreement of the WR mass with similar WR stars and the predictions of the mass-luminosity relations is promising.
For the O star, there are two plausible routes for comparing the measured mass of 26.31.7 to other O stars. First, we will use the spectroscopic models of the binary from Richardson et al. (2016a) again. In this case, the constraints come from the measured values of (cgs), which was 4.00.3 dex. Unfortunately, the large error on this parameter means that the O star mass from the spectroscopic models was 2919 , which obviously agrees with our value given the error in the spectroscopic models.
Another way to consider the mass of the secondary is to use its spectral type and the models for the O star masses, namely those of Martins et al. (2005). Richardson et al. (2016a) report the spectral type of the companion to be an O9V star. An O9V star should have a mass around 18 , which is a bit lower than our value of 26 . However, an O9III star would have a mass close to 23 , very similar to our measured value. We note that the spectral luminosity classification of O9 stars is largely done with weak lines in the blue such as Si IV 4089,4116 and N V 4379. These lines are weak in all luminosity classes, and would likely be very hard to detect with the combined spectrum of a WN star and a projected rotational velocity of the O star of 35030 km s-1 (Richardson et al., 2016a).
Palate et al. (2013) examined both the radial velocity and X-ray variability of the WR 138 system. The X-ray observations of WR 138 are sparse and taken with multiple satellites. The models of the six epochs of observations show some variation, but the largest variation was seen with ROSAT which had a very small energy range for which it was sensitive. It is likely that the system should show a variation dependent on the separation in the system, resulting in either an adiabatic cooling () or a radiative cooling dependency () as described by Cantó et al. (1996) and Gayley (2009). The observations presented by Palate et al. (2013) are not dense enough in phase coverage nor all of high enough quality for an appropriate fit of the cooling of the gas. We suggest that a dedicated X-ray variability campaign across an entire orbit of WR 138 should be a high-priority in order to best constrain the variability of the system and place constraints on how the wind collisions cool in orbits with well-established orbits.
Other observations of WR 138 could allow for better constraints on the colliding wind geometry and a better understanding of the way in which polarization is impacted by the geometry of the colliding winds. Fullard et al. (2020) examined many WR+O binaries with spectropolarimetry, finding a fairly small polarization for WR 138. The SMEX satellite Polstar is currently being proposed to NASA as a small mission to explore the wavelength-dependent polarization of stars in the ultraviolet. Compared to the mission expectations, WR 138 is fainter than most of the main targets. However, with selected epochs to observe the system and long (1 day) exposures, strong constraints on the polarization changes could provide insights into the wind collisions given the known orbital elements presented here (St-Louis et al., 2022) as well as the rapid rotation of the O star companion (Jones et al., 2022).
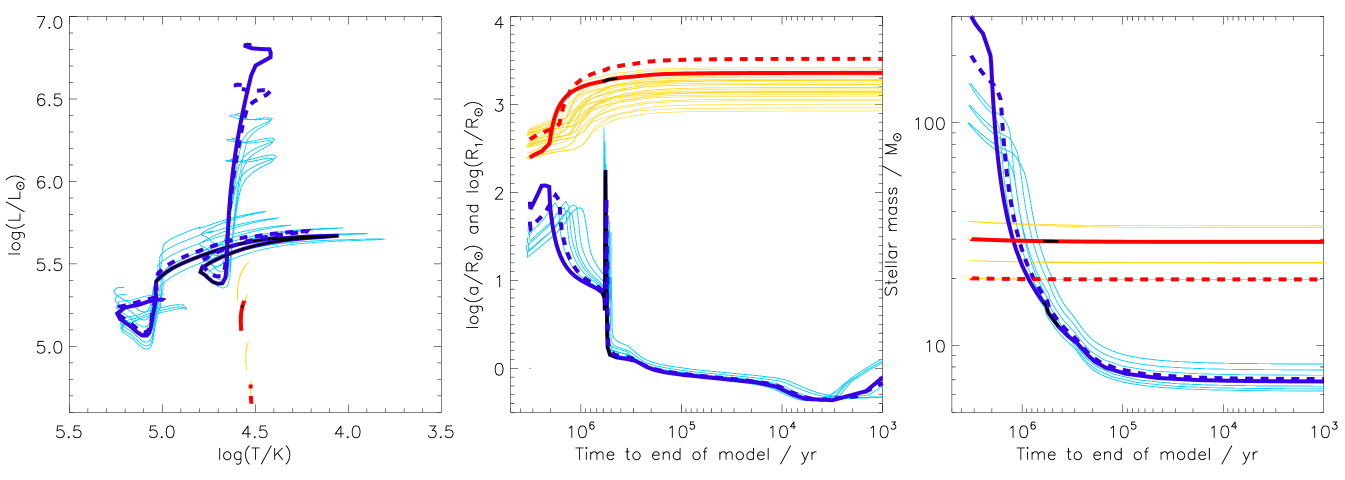
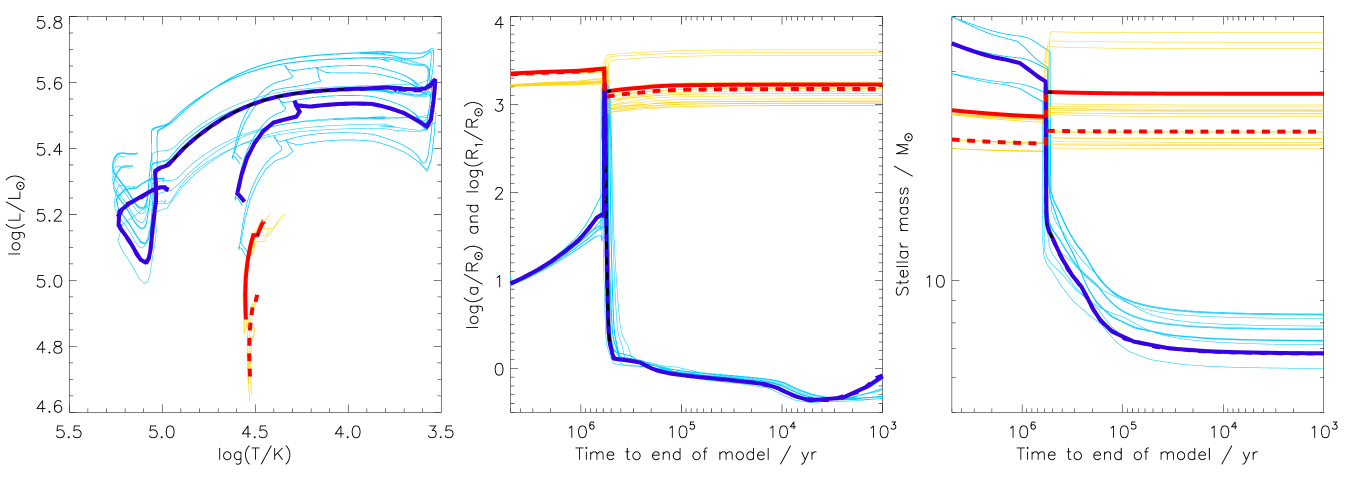
We compare the observational constraints for WR 138, including the current masses, the magnitudes and current circularized separation of the binary to BPASS v2.2 binary stellar evolution models (Eldridge et al., 2017; Stanway & Eldridge, 2018) at over the range of metallicities allowed in BPASS. The comparison to BPASS models reveals two main evolutionary pathways sets of models that agree with the current observed parameters which we show in Fig. 3. The first pathway has initial masses for the binary system of 17871 M⊙ and 28.22.8 M⊙ with initial periods of with a super-Solar metallicity mass fraction of . These systems do not interact and the primary star loses most of its mass by strong stellar winds on the main sequence, before any binary interaction can occur. This mass loss is what drives the system to such long observed periods. The current age predicted today is 2.88 Myrs.
The second pathway also shown in Fig. 3 has initial masses of the binary systems with of 37.47.5 M⊙ and 24.01.4 M⊙, initial periods of = 3.170.16 and a slightly lower metallicity of . These systems interact when the primary reaches its red supergiant phase. The interactions begin with some slight mass transfer before a common envelope phase reducing the orbit slightly to values observed today. The current age predicted today is 5.0 Myrs. Both sets of models will have the current O star accreting some material and angular momentum, aiding the star to becoming the rapid rotator we observe today, even though rotation is not fully accounted for in BPASS.
When considering the full set of models the best fitting initial parameters have an initial primary mass of 35 M⊙, a secondary mass of 24.5 M⊙ and an initial period of . While the higher mass model set are possible, we consider that the lower mass set is more representative of the binary system’s prior evolution, especially with the steep initial mass function for star formation. As discussed in the BPASS modeling of WR 140 (Thomas et al., 2021a), the caveats around these fits is that BPASS is currently unable to model eccentric orbits. However, as discussed by Hurley et al. (2002), orbits with the same semi-latus rectum evolve through similar pathways. Thus we have constrained our models to have the same circular orbital radius as the semi-latus rectum of the observed binary. Given the relatively low value of eccentricity, we expect this to be a good approximation in this case.
WR 138 is a member of a growing class of massive, eccentric binaries with observational and theoretical evidence of at least some binary interactions being necessary to form the system as observed today. Such systems have included the LBV candidates HD 326823 and MWC 314 (Richardson et al., 2011, 2016b) and even the prototype LBV binary Car (Hirai et al., 2021). With Car, the models indicate a merger that formed the modern day primary star after complex interactions with a third component. However, in the case of the short period systems HD 326823 and MWC 314, the eccentricity observed in these interacting binaries is hyopthesized to be driven through a transfer of angular momentum during a periastron passage that works to increase eccentricity with time. The process of increasing the eccentricity with time was modeled in a series of papers by Sepinsky et al. (2007a, b, 2009, 2010). Some evidence presented in the evolutionary analysis of WR 140 presented by Thomas et al. (2021a) also indicated that the high eccentricity (0.9) was driven by the angular momentum transfer at periastron increasing the eccentricity with time. If similar results are seen now with WR 138, it is an opportune time for theorists to model how these interactions can occur to build a growing number of eccentric binaries with both short and long periods.
5 Conclusions
We have presented the second visual orbit for a WN-type star in a binary system derived using a combination of long-baseline infrared interferometry and radial velocities from optical spectra. The resulting masses are in agreement with the masses expected from spectral modeling previously done for this system and the orbital parallax derived is in agreement with the Gaia parallax. The observations reported here show that the speculation of a third body in the system by Rauw et al. (2023) is not plausible although we adjusted different data sets’ -velocity to fit our orbit. We suspect that this adjustment only adjusts the various measuring techniques from different authors more than an intrinsic change in the -velocity with time, and furthermore we see no evidence of a third body in our interferometry. Furthermore, the system may have undergone some past interactions through a common envelope phase or mass transfer when the current WN star was in a red supergiant phase. Finding more systems like WR 138 that can be measured with both spectroscopy and interferometry will place strong constraints on the formation mechanisms for these stars and binaries in the future.
acknowledgments
We thank Peredur Williams for comments that improved this manuscript. This work is based upon observations obtained with the Georgia State University Center for High Angular Resolution Astronomy Array at Mount Wilson Observatory. The CHARA Array is supported by the National Science Foundation under Grant No. AST-1636624 and AST-2034336. Institutional support has been provided from the GSU College of Arts and Sciences and the GSU Office of the Vice President for Research and Economic Development. Time at the CHARA Array was granted through the NOIRLab community access program (NOIRLab PropIDs: 2017B-0088, 2021B-0159, and 2023A-452855; PI: N. Richardson). This research has made use of the Jean-Marie Mariotti Center Aspro and SearchCal services.
Some of the data presented herein were obtained at the W. M. Keck Observatory, which is operated as a scientific partnership among the California Institute of Technology, the University of California and the National Aeronautics and Space Administration. The Observatory was made possible by the generous financial support of the W. M. Keck Foundation. The authors wish to recognize and acknowledge the very significant cultural role and reverence that the summit of Maunakea has always had within the indigenous Hawaiian community. We are most fortunate to have the opportunity to conduct observations from this mountain.
AMH is grateful for support through Embry-Riddle Aeronautical University’s Undergraduate Research Institute and the NASA Arizona Space Grant program. NDR is grateful for support from the Cottrell Scholar Award #CS-CSA-2023-143 sponsored by the Research Corporation for Science Advancement. SK acknowledges funding for MIRC-X received funding from the European Research Council (ERC) under the European Union’s Horizon 2020 research and innovation programme (Starting Grant No. 639889 and Consolidated Grant No. 101003096). JDM acknowledges funding for the development of MIRC-X (NASA-XRP NNX16AD43G, NSF-AST 1909165) and MYSTIC (NSF-ATI 1506540, NSF-AST 1909165). JM acknowledges funding from a Royal Society - Science Foundation Ireland University Research Fellowship.
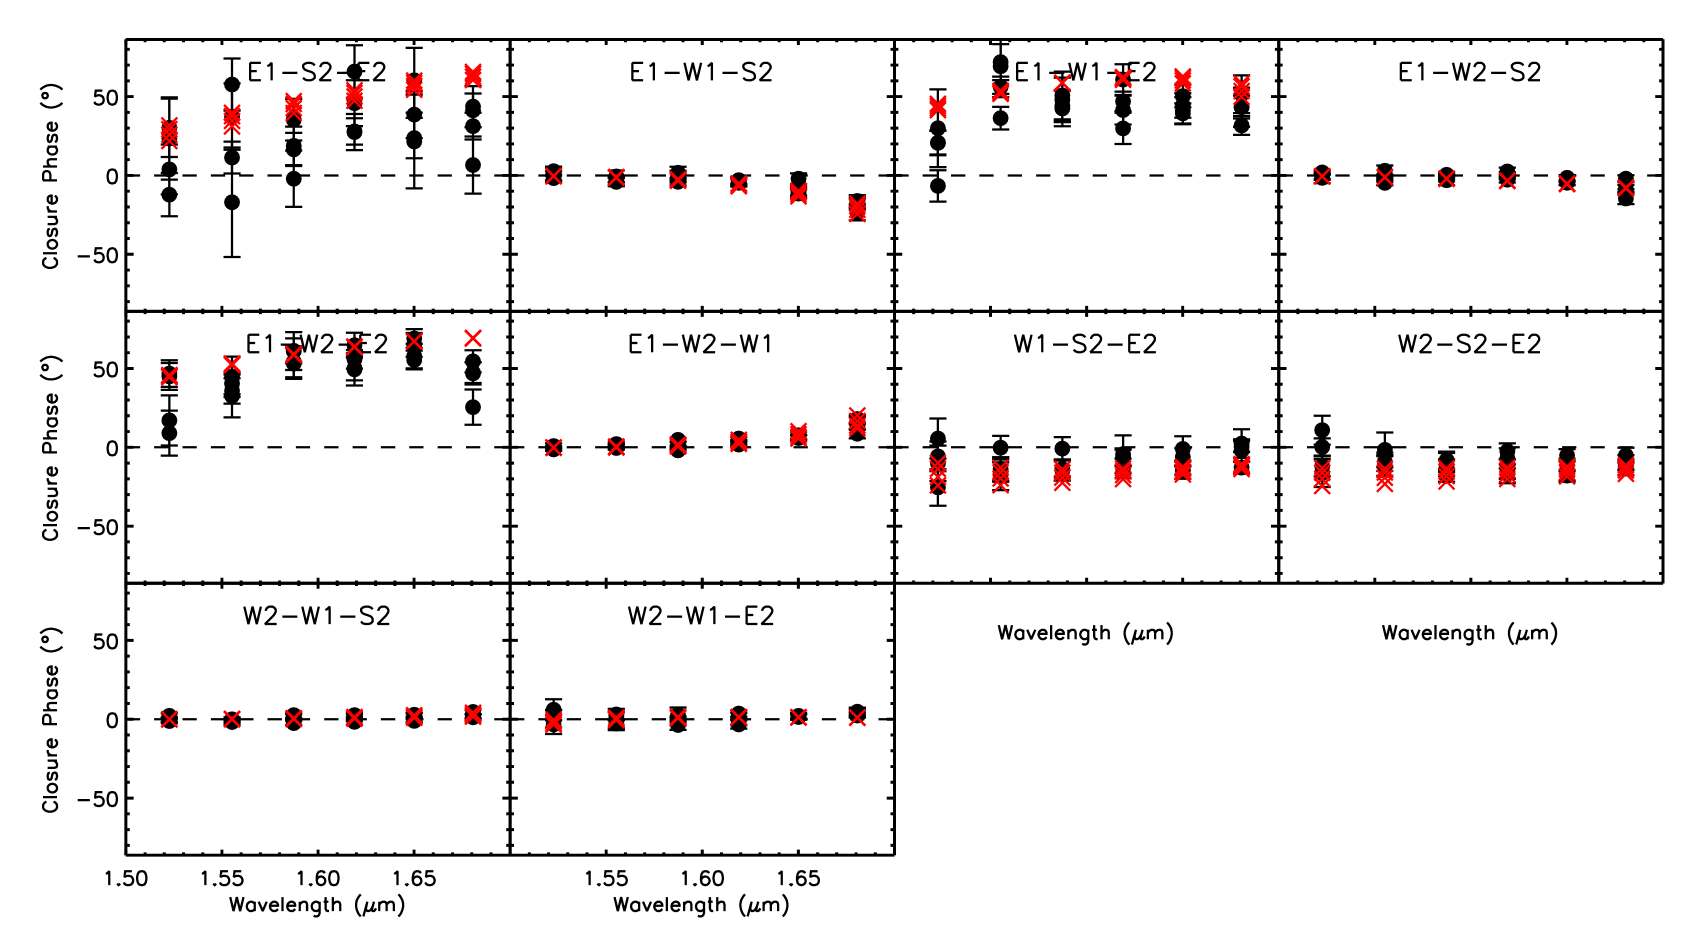
The appendix includes Figure Set 4 showing the interferometric data and the binary fits for each epoch of MIRC-X and MYSTIC. Each figure in the set shows the () coverage, the map from the binary grid search, the visibilities, and the closure phases. The maps are centered at the predicted location based on the updated orbit fit. The nights with reliable detections show a clear minimum in the indicated by the colored circles. The large red, orange, yellow, green, blue, purple, and black symbols show solutions within a interval of 1, 4, 9, 16, 25, 36, and 49 from the minimum . The small black circles show solutions where the difference in the is greater than 49. Similar plots are shown in the appendix of Richardson et al. (2024) and show that the high-quality interferometric data from MIRC-X and MYSTIC frequently will only show the best fit, and hence only red points.
NOTE for arXiv readers: These figures make the pdf too large for arXiv and we only include one. A full copy can be requested from the corresponding author until the paper is published in ApJ.

References
- Annuk (1990) Annuk, K. 1990, Acta Astron., 40, 267
- Anugu et al. (2020) Anugu, N., Le Bouquin, J.-B., Monnier, J. D., et al. 2020, AJ, 160, 158, doi: 10.3847/1538-3881/aba957
- Astropy Collaboration et al. (2013) Astropy Collaboration, Robitaille, T. P., Tollerud, E. J., et al. 2013, A&A, 558, A33, doi: 10.1051/0004-6361/201322068
- Astropy Collaboration et al. (2018) Astropy Collaboration, Price-Whelan, A. M., Sipőcz, B. M., et al. 2018, AJ, 156, 123, doi: 10.3847/1538-3881/aabc4f
- Bailer-Jones et al. (2021) Bailer-Jones, C. A. L., Rybizki, J., Fouesneau, M., Demleitner, M., & Andrae, R. 2021, AJ, 161, 147, doi: 10.3847/1538-3881/abd806
- Bonneau et al. (2011) Bonneau, D., Delfosse, X., Mourard, D., et al. 2011, A&A, 535, A53, doi: 10.1051/0004-6361/201015124
- Bonneau et al. (2006) Bonneau, D., Clausse, J. M., Delfosse, X., et al. 2006, A&A, 456, 789, doi: 10.1051/0004-6361:20054469
- Cantó et al. (1996) Cantó, J., Raga, A. C., & Wilkin, F. P. 1996, ApJ, 469, 729, doi: 10.1086/177820
- Che et al. (2012) Che, X., Monnier, J. D., Kraus, S., et al. 2012, in Society of Photo-Optical Instrumentation Engineers (SPIE) Conference Series, Vol. 8445, Optical and Infrared Interferometry III, ed. F. Delplancke, J. K. Rajagopal, & F. Malbet, 84450Z, doi: 10.1117/12.926909
- Conti (1975) Conti, P. S. 1975, Memoires of the Societe Royale des Sciences de Liege, 9, 193
- Dsilva et al. (2022) Dsilva, K., Shenar, T., Sana, H., & Marchant, P. 2022, A&A, 664, A93, doi: 10.1051/0004-6361/202142729
- Eldridge et al. (2017) Eldridge, J. J., Stanway, E. R., Xiao, L., et al. 2017, PASA, 34, e058, doi: 10.1017/pasa.2017.51
- Fullard et al. (2020) Fullard, A. G., St-Louis, N., Moffat, A. F. J., et al. 2020, AJ, 159, 214, doi: 10.3847/1538-3881/ab8293
- Gardner et al. (2022) Gardner, T., Monnier, J. D., Fekel, F. C., et al. 2022, AJ, 164, 184, doi: 10.3847/1538-3881/ac8eae
- Gayley (2009) Gayley, K. G. 2009, ApJ, 703, 89, doi: 10.1088/0004-637X/703/1/89
- Gräfener et al. (2011) Gräfener, G., Vink, J. S., de Koter, A., & Langer, N. 2011, A&A, 535, A56, doi: 10.1051/0004-6361/201116701
- Hiltner (1945) Hiltner, W. A. 1945, ApJ, 101, 356, doi: 10.1086/144726
- Hirai et al. (2021) Hirai, R., Podsiadlowski, P., Owocki, S. P., Schneider, F. R. N., & Smith, N. 2021, MNRAS, 503, 4276, doi: 10.1093/mnras/stab571
- Hurley et al. (2002) Hurley, J. R., Tout, C. A., & Pols, O. R. 2002, MNRAS, 329, 897, doi: 10.1046/j.1365-8711.2002.05038.x
- Jones et al. (2022) Jones, C. E., Labadie-Bartz, J., Cotton, D. V., et al. 2022, Ap&SS, 367, 124, doi: 10.1007/s10509-022-04127-5
- Lamontagne et al. (1996) Lamontagne, R., Moffat, A. F. J., Drissen, L., Robert, C., & Matthews, J. M. 1996, AJ, 112, 2227, doi: 10.1086/118175
- Lamontagne et al. (1982) Lamontagne, R., Moffat, A. F. J., Koenigsberger, G., & Seggewiss, W. 1982, ApJ, 253, 230, doi: 10.1086/159627
- Le Bouquin et al. (2024) Le Bouquin, J.-B., Anugu, N., Davies, C. L., et al. 2024, CHARA MIRC-X and MYSTIC Data Reduction Pipeline, Zenodo, doi: 10.5281/zenodo.12735292
- Markwardt (2009) Markwardt, C. B. 2009, in Astronomical Society of the Pacific Conference Series, Vol. 411, Astronomical Data Analysis Software and Systems XVIII, ed. D. A. Bohlender, D. Durand, & P. Dowler, 251, doi: 10.48550/arXiv.0902.2850
- Martins et al. (2005) Martins, F., Schaerer, D., & Hillier, D. J. 2005, A&A, 436, 1049, doi: 10.1051/0004-6361:20042386
- Massey (1980) Massey, P. 1980, ApJ, 236, 526, doi: 10.1086/157770
- Monnier et al. (2006) Monnier, J. D., Pedretti, E., Thureau, N., et al. 2006, in Society of Photo-Optical Instrumentation Engineers (SPIE) Conference Series, Vol. 6268, Society of Photo-Optical Instrumentation Engineers (SPIE) Conference Series, ed. J. D. Monnier, M. Schöller, & W. C. Danchi, 62681P, doi: 10.1117/12.671982
- Palate et al. (2013) Palate, M., Rauw, G., De Becker, M., Nazé, Y., & Eenens, P. 2013, A&A, 560, A27, doi: 10.1051/0004-6361/201322162
- Rauw et al. (2023) Rauw, G., Nazé, Y., & Gosset, E. 2023, New A, 104, 102062, doi: 10.1016/j.newast.2023.102062
- Richardson et al. (2011) Richardson, N. D., Gies, D. R., & Williams, S. J. 2011, AJ, 142, 201, doi: 10.1088/0004-6256/142/6/201
- Richardson et al. (2016a) Richardson, N. D., Shenar, T., Roy-Loubier, O., et al. 2016a, MNRAS, 461, 4115, doi: 10.1093/mnras/stw1585
- Richardson et al. (2016b) Richardson, N. D., Moffat, A. F. J., Maltais-Tariant, R., et al. 2016b, MNRAS, 455, 244, doi: 10.1093/mnras/stv2291
- Richardson et al. (2021) Richardson, N. D., Lee, L., Schaefer, G., et al. 2021, ApJ, 908, L3, doi: 10.3847/2041-8213/abd722
- Sana et al. (2012) Sana, H., de Mink, S. E., de Koter, A., et al. 2012, Science, 337, 444, doi: 10.1126/science.1223344
- Sana et al. (2013) Sana, H., de Koter, A., de Mink, S. E., et al. 2013, A&A, 550, A107, doi: 10.1051/0004-6361/201219621
- Sana et al. (2014) Sana, H., Le Bouquin, J. B., Lacour, S., et al. 2014, ApJS, 215, 15, doi: 10.1088/0067-0049/215/1/15
- Schaefer et al. (2006) Schaefer, G. H., Simon, M., Beck, T. L., Nelan, E., & Prato, L. 2006, AJ, 132, 2618, doi: 10.1086/508935
- Schaefer et al. (2016) Schaefer, G. H., Hummel, C. A., Gies, D. R., et al. 2016, AJ, 152, 213, doi: 10.3847/0004-6256/152/6/213
- Schootemeijer et al. (2024) Schootemeijer, A., Shenar, T., Langer, N., et al. 2024, arXiv e-prints, arXiv:2406.01420, doi: 10.48550/arXiv.2406.01420
- Sepinsky et al. (2007a) Sepinsky, J. F., Willems, B., & Kalogera, V. 2007a, ApJ, 660, 1624, doi: 10.1086/513736
- Sepinsky et al. (2007b) Sepinsky, J. F., Willems, B., Kalogera, V., & Rasio, F. A. 2007b, ApJ, 667, 1170, doi: 10.1086/520911
- Sepinsky et al. (2009) —. 2009, ApJ, 702, 1387, doi: 10.1088/0004-637X/702/2/1387
- Sepinsky et al. (2010) —. 2010, ApJ, 724, 546, doi: 10.1088/0004-637X/724/1/546
- Setterholm et al. (2023) Setterholm, B. R., Monnier, J. D., Le Bouquin, J.-B., et al. 2023, Journal of Astronomical Telescopes, Instruments, and Systems, 9, 025006, doi: 10.1117/1.JATIS.9.2.025006
- Sheinis et al. (2002) Sheinis, A. I., Bolte, M., Epps, H. W., et al. 2002, PASP, 114, 851, doi: 10.1086/341706
- St-Louis et al. (2022) St-Louis, N., Gayley, K., Hillier, D. J., et al. 2022, Ap&SS, 367, 118, doi: 10.1007/s10509-022-04102-0
- Stanway & Eldridge (2018) Stanway, E. R., & Eldridge, J. J. 2018, MNRAS, 479, 75, doi: 10.1093/mnras/sty1353
- Strawn et al. (2023) Strawn, E., Richardson, N. D., Moffat, A. F. J., et al. 2023, MNRAS, 519, 5882, doi: 10.1093/mnras/stad018
- ten Brummelaar et al. (2005) ten Brummelaar, T. A., McAlister, H. A., Ridgway, S. T., et al. 2005, ApJ, 628, 453, doi: 10.1086/430729
- ten Brummelaar et al. (2013) ten Brummelaar, T. A., Sturmann, J., Ridgway, S. T., et al. 2013, Journal of Astronomical Instrumentation, 2, 1340004, doi: 10.1142/S2251171713400047
- Thomas et al. (2021a) Thomas, J. D., Richardson, N. D., Eldridge, J. J., et al. 2021a, MNRAS, 504, 5221, doi: 10.1093/mnras/stab1181
- Thomas et al. (2021b) —. 2021b, MNRAS, 504, 5221, doi: 10.1093/mnras/stab1181
- Wolf & Rayet (1867) Wolf, C. J. E., & Rayet, G. 1867, Academie des Sciences Paris Comptes Rendus, 65, 292