Zooming Into the Darknet: Characterizing Internet Background Radiation and its Structural Changes
Abstract.
Network telescopes or “Darknets” provide a unique window into Internet-wide malicious activities associated with malware propagation, denial of service attacks, scanning performed for network reconnaissance, and others. Analyses of the resulting data can provide actionable insights to security analysts that can be used to prevent or mitigate cyber-threats. Large Darknets, however, observe millions of nefarious events on a daily basis which makes the transformation of the captured information into meaningful insights challenging. We present a novel framework for characterizing Darknet behavior and its temporal evolution aiming to address this challenge. The proposed framework: (i) Extracts a high dimensional representation of Darknet events composed of features distilled from Darknet data and other external sources; (ii) Learns, in an unsupervised fashion, an information-preserving low-dimensional representation of these events (using deep representation learning) that is amenable to clustering; (iv) Performs clustering of the scanner data in the resulting representation space and provides interpretable insights using optimal decision trees; and (v) Utilizes the clustering outcomes as “signatures” that can be used to detect structural changes in the Darknet activities. We evaluate the proposed system on a large operational Network Telescope and demonstrate its ability to detect real-world, high-impact cybersecurity incidents.
1. Introduction
Cyber-attacks present one of the most severe threats to the safety of citizenry and the security of the nation’s critical infrastructure (e.g., energy grid, transportation network, health system, food and water supply networks). A critical phase in cyber-attack is “reconnaissance”, which often involves “scanning” for potentially vulnerable machines or devices on the internet so that that these vulnerabilities may be exploited in later phases of the cyber-attack. Similarly, malware that attempt to propagate from one compromised machine to other vulnerable devices are also engaged in malicious scanning activities. Such actions are difficult to be identified in an operational network because they are oftentimes low-volume and interwoven with normal network traffic, behaving similarly lest they are detected.
Characterizing these scanning behaviors can provide important information for network security analysts because they may reveal change of attack strategies, new vulnerabilities that are being exploited, and unauthorized use of Internet resources. Network telescopes (caida_telescope_report, ), also known as “Darknets”, provide a unique opportunity for characterizing and detecting Internet-wide malicious activities. A Darknet receives and records unsolicited traffic—coined as Internet Background Radiation (IBR)—destined to an unused but routed address space. This “dark IP space” hosts no services or devices, and therefore any traffic arriving to it is inherently malicious. No regular user traffic reaches the Darknet. Thus, Darknets have been frequently used by the networking and security communities to shed light into dubious malware propagation and interminable network scanning activities (Durumeric:2014:IVI:2671225.2671230, ; Wustrow2010IBRrevisted, ; Pang2004IBR_active_responses, ; Iglesias2017IBRpatterns, ; ScannersDarknet2019, ). They have also been used to detect cyber-threats, e.g., botnets (MiraiUSENIX2017, ), DDoS and other types of attacks (Fachkha2015DDoS, ; Ban2012LongTermAttack, ; Nishikaze2015TAP, ), and to detect novel attack patterns (Ban2016MiningClustering, ).
Our team has access to a large network telescope for gathering observations of scanning activity across the Internet. The resulting data can be used to characterize these scanning events, and to gain actionable insights for preventing or mitigating such cyber-threats. An important task in this context has to do with characterizing the different Darknet scanners, based on their traffic profile, the characteristics of their targets, their port scanning patterns, etc., and then employing these characterizations as signatures to detect temporal changes in the evolution of the Darknet. This problem can be reformulated as a problem of unsupervised clustering. However, the resulting clustering problem presents several non-trivial challenges: (i) The data are heterogeneous with regard to the types of observations included. For example, some of the observations are categorical while others are numeric. However, standard clustering methods are typically designed to handle a single type of data, which renders them not directly applicable to the problem of clustering the scanner data; (ii) The number of observed variables, e.g., the ports scanned over the duration of monitoring, for each scanner can be in the order of thousands, resulting in extremely high-dimensional data. Distance calculations are known to be inherently unreliable in high-dimensional settings (aggarwal2001surprising, ), making it challenging to apply standard clustering methods that rely on measuring distance between data samples to cluster them; (iii) Linear dimensionality reduction techniques such as Principal Component Analysis (PCA) (jolliffe2016principal, ) fail to cope with non-linear interactions between the observed variables; (iv) interpreting the clustering outcome, that may include hundreds of clusters with high-dimensional features, can be a non-trivial task.
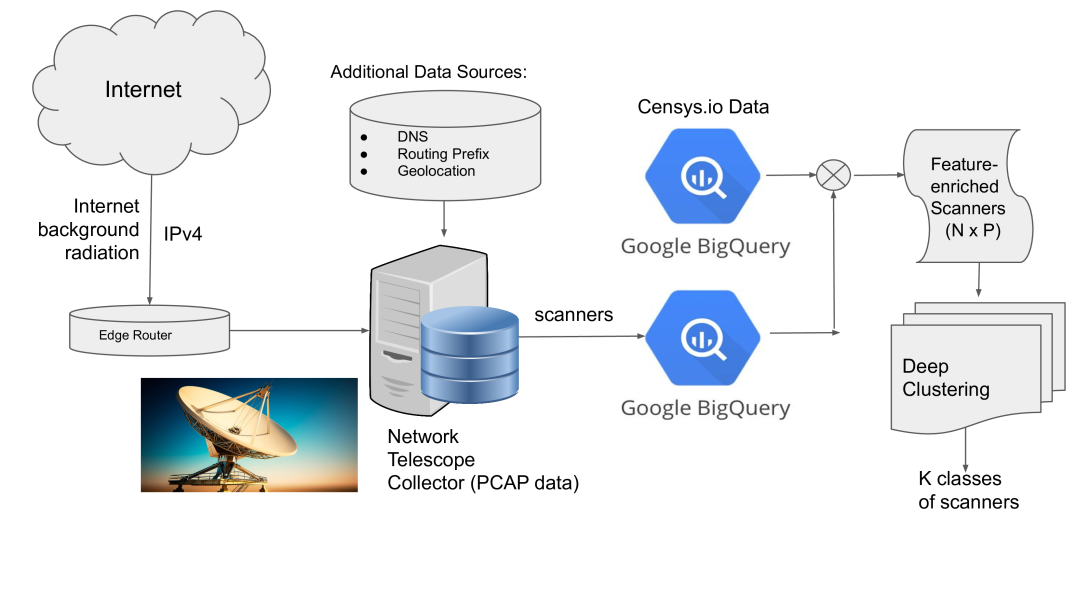
Against this background, this paper explores a novel unsupervised approach to characterizing network scanners using observations from a Network Telescope, that overcomes the aforementioned challenges. Our system (see Figure 1) starts with unstructured, raw packet data collected in our Darknet, identifies all Darknet scanning events within the monitoring interval of our interest, annotates these events with external data sources such as routing, DNS, geo-location and data from Censys.io (censys, ), distills an array of features to profile the behavior of each scanner, and passes the set of feature-rich scanners to an unsupervised clustering method. The output of clustering is a grouping of the scanners into a number of clusters based on their scanning profiles.
The key contributions of the paper are as follows: We leverage the recent advances in deep neural networks (DNN) and employ powerful “embedding” or “representation learning” methods (bengio2013representation, ) to automate the construction of low-dimensional vector space representations of heterogeneous, complex, high-dimensional network scanner data. We apply standard clustering methods e.g., -means, to the resulting information-preserving embedding of the data. We then introduce the use of optimal classification trees as a means for interpreting the clustering outcome and for understanding the structure of the underlying data. To automate the detection of structural changes in the Darknet, we propose the use of a Wasserstein metric to help us assess the similarity or “distance“ between the clustering outcomes of interest (e.g., comparing Darknet clusters between consecutive days). Finally, we evaluate the proposed framework on real-world Darknet activities that span a period of three months.
The rest of the paper is organized as follows: Section 2 describes existing work related to this research. Section 3 describes the Network Telescope data used in our work and the pipeline for enriching them with additional data sources, e.g., geolocation, data from Censys.io, etc. Section 4 describes our approach to learning low-dimensional, information-preserving representations of the resulting high-dimensional data, which is then used for clustering Darknet events. In Section 5 we discuss tuning and evaluation of the proposed deep learning tasks. Section 6 introduces the usage of decision trees for clustering interpretation and in Section 7 we discuss the “Earth Mover’s Distance” formulation used as the Wasserstein metric for assessing inter-cluster similarity and helping with “novelty detection” of temporal patterns. Section 8 presents case-studies and insights from real-world events detected with the proposed approach and we conclude the paper with a brief summary of our contributions along with some directions for future research.
2. Related Work
As noted above, Darknets provide a unique perspective into Internet-wide scanning activities involved in malware propagation, network reconnaissance, Denial of Service (DoS) attacks, misconfigurations, etc. (Durumeric:2014:IVI:2671225.2671230, ; jonker2017millions, ; Dainotti2014botnetIBR, ; Wustrow2010IBRrevisted, ; Herwig2019HajimeIRB, ; ScannersDarknet2019, ). Darknet data have been utilized to study DDoS attacks (Czyz2014NTPDDoS, ; Fachkha2015DDoS, ; chiang2000fault, ; Wang2018DDoS, ), DoS attacks and BGP blackholing (Jonker2018DoS_BGP_IBR, ), IPv6 routing instabilities (Czyz2013IPv6IBR, ), and long-term cyber attacks (Ban2012LongTermAttack, ). Application-level responses to IBR observed in Darknet have also been used to characterize Internet-wide scanning activities (Pang2004IBR_active_responses, ).
Of particular interest in this context is the use of Darknet data for detecting and characterizing new malware. The Mirai botnet, for instance, is known to have started its malware propagation activity by first scanning port 23 (Telnet) for potential victims in the Internet (MiraiUSENIX2017, ). Over time, and as Internet-of-Things (IoT) devices had proven to be very susceptible in getting compromised by malware infection, its scanning behavior changed as well. It proceeded to scan port 2323, and eventually 10 other ports (MiraiUSENIX2017, ). Hence, reliably detecting and responding to such attacks calls for effective methods for rapid identification of novel signatures of malware behavior. Volumetric attacks on a target, e.g., as part of a distributed DoS attack through IP spoofing, i.e., forging the source IP address of a packet, are also identifiable in a Darknet and referred as backscatter (moore01inferring, ). Recent work has shown that thousands of victims of DoS attacks can be identified by analyzing Darknet backscatter data (jonker2017millions, ; Iglesias2017IBRpatterns, ).
Clustering offers a powerful approach to the analyses of Darknet data to identify novel attack patterns, victims of attacks, novel network scanners, etc. (Nishikaze2015TAP, ; Ban2016MiningClustering, ; Iglesias2017IBRpatterns, ). For example, Nishikaze et al. (Nishikaze2015TAP, ) encode Darknet traffic using 27 network features associated with blocks / subnets of the IP space and cluster the resulting data to cluster the subnets according to their traffic profiles. Ban et al. (Ban2016MiningClustering, ) have shown how clustering of Darknet data, followed by frequent pattern mining and visualization can be used to detect novel attack patterns. Iglesias and Szeby (Iglesias2017IBRpatterns, ) have shown how to cluster IBR data from Darknet based on a novel representation of network traffic to identify network traffic patterns that are characteristic of activities such as long term scanning, as well as bursty events from targeted attacks and short term incidents. Finally, Sarabi and Liu (10.1145/3278532.3278545, ) employ deep learning for obtaining lightweight embeddings to characterize the population of Internet hosts as observed by scanning services such as Censys.io.
3. Network Telescope Data
Network telescopes offer a unique vantage point into macroscopic Internet-wide activities. Specifically, they offer the ability to detect a broad range of dubious scanning activities; from high-intensity scanning to low-speed, seemingly innocuous nefarious behaviors, which are much harder to detect in a large-scale operational network. Typical approaches to detecting scanning in an operational network set a (somewhat arbitrary) threshold on the number of packets received from a suspicious host within a time period or a threshold on the number of unique destinations contacted by the host (e.g., 25 unique destinations with 5 minutes) as the detection criterion for suspected malicious behaviors. While this approach can indeed catch some dubious activities, it fails to capture those that occur at a frequency that is below the set threshold. On the other hand, lowering the threshold would inevitably include many more non-malicious events, hence overwhelming the analysts (i.e., high-alert “fatigue”) and significantly increase the complexity of further analyses aiming at distinguishing malicious events from normal ones. Because benign real-user network traffic does not reach the Darknet, scanning activities gathered at the Darknet do not need to be filtered, thus obviating the need to set an arbitrary threshold. Hence, even low-speed malicious activities can be easily detected in a Darknet that is sufficiently large (caida_telescope_report, ).
In this section we describe the networking and processing instrumentation that provide us with a near-real-time pipeline for extracting and annotating scanners. Packets arriving in our /13 dark IP space are collected in PCAP format on an hourly basis. During a typical day, more than 100 GB of compressed Darknet data is collected consisting of some 3 billion packets on average. As Figure 1 depicts, the PCAP data is processed to extract Darknet events (such as scanning and backscatter) and annotate them with external data sources such as DNS, geolocation information using the MaxMind databases (GeoIP, ) and routing information from CAIDA’s prefix to AS mapping dataset (pf2as, ). A Darknet event is identified by i) the observed source IP, the ii) protocol flags used and iii) the targeted port. We employ caching to keep ongoing scanners and other events in memory. When an event remains inactive for a period of about 10 minutes, it “expires” from the cache and gets recorded to disk. Note here that scanners that target multiple ports and/or protocols would be tracked in multiple separate events. This is a key observation and plays an important role in the construction of scanning features that we will introduce in the sequel.
All identified Darknet events are also uploaded in near-real-time to Google’s BigQuery (bq, ) for efficient analysis, further processing and also ease of data sharing. In addition, storing the extracted events into BigQuery tables enables easy integration with extra data sources also available in BigQuery, namely Censys.io data (censys, ; Durumeric:2015:SEB:2810103.2813703, ). Censys actively scans the whole IPv4 space and their data provide a unique perspective on the nature of a scanner since they potentially include information about the open ports and services at the scanning host itself. Such coupling of information helped the authors in (MiraiUSENIX2017, ) to identify device types and manufacturer information of the infected Mirai population. We use Censys data in a similar manner and employ them to enrich the scanner features we use for our clustering task. The Darknet data and integrated data sources are aggregated on a daily basis to construct clustering features for the Darknet events, as described in the next section.
4. Clustering Darknet Events
We designed the feature set having the following two considerations in mind: First, the dimensionality of the feature space is very high (i.e., in the order of thousands). Second, the evaluation and interpretation of the clustering results of scanners could be challenging because we have no “ground truth” or clustering labels. One therefore needs to use semantics extracted from the data itself. In this section, we describe our approach for addressing the high dimensionality challenges through a combination of 1) one-hot encoding of high-dimensional features (e.g., ports), and 2) deep learning for extracting a low-dimension latent representation. Section 5 will describe our methodology for clustering evaluation.
4.1. Feature Design for Darknet Events
Table 1 summarizes the features used to represent Darknet activity. As mentioned earlier, Darknet events in this study are aggregated on a daily basis. For example, a scanner identified times within a given day—possibly scanning multiple ports and protocols—will be represented in the clustering input as a single entry annotated with the features of Table 1. The chosen features fall into the following categories: 1) intensity of the activity (e.g., total number of packets captured in the Darknet for a given scanner within the day, total duration of scanning, number of ports scanned, etc.), 2) scanning intentions (i.e., the set of ports and protocols involved), 3) scanning strategy (i.e., information about the unique destinations reached in the Darknet, both in terms of IPs and /24 prefixes), and 4) external threat intelligence for the scanner itself (i.e., information gathered from Censys.io). We also annotate each event with BGP routing information, organizational and geolocation features, DNS-based features and others to help the analyst interpret the clustering results.
Notice here that several features used are extremely high dimensional; e.g., the number of unique TCP/UDP ports is . Therefore, we chose an one-hot encoding scheme for these high-dimensional features where only the top values (ranked according to the number of distinct source IPs involved) of each feature are encoded for the task at hand.
We emphasize here that the feature set could be easily expanded (e.g., to include time-series data for each Darknet scanner or encoding DNS information, when available) and the proposed framework could easily accommodate the added features. We leave this feature expansion as part of future work.
| ID | Feature | Description |
| 1 | Total Packets | Aggregate number of packets sent in the monitoring interval |
| 2 | Total Bytes | Aggregate number of bytes sent in the monitoring interval |
| 3 | Total Lifetime | Total time span of scanning activity for the scanner |
| 4 | Number of ports scanned | The number of unique ports scanned by the scanner |
| 5 | Average Lifetime | The average time interval that a scanner was active |
| 6 | Average Packet Size | The average packet size sent by a scanner in the Darknet |
| 7 | Set of protocols scanned | One-hot-encoded set of all protocols scanned by a scanner |
| 8 | Set of ports scanned | One-hot-encoded set of ports scanned by a scanner |
| 9 | Unique Destinations (Min, Max) | Min and Max number of Darknet hosts scanned |
| 10 | Unique /24 Prefixes (Min, Max) | Min and Max number of Darknet /24 prefixes scanned |
| 11 | Set of open ports at the scanner | One-hot-encoded open ports/services at the scanner per Censys.io |
| 12 | Scanner’s tags (e.g., device type) | One-hot-encoded tags (extracted from the scanner’s banner, etc.) per Censys.io |
4.2. Representation Learning
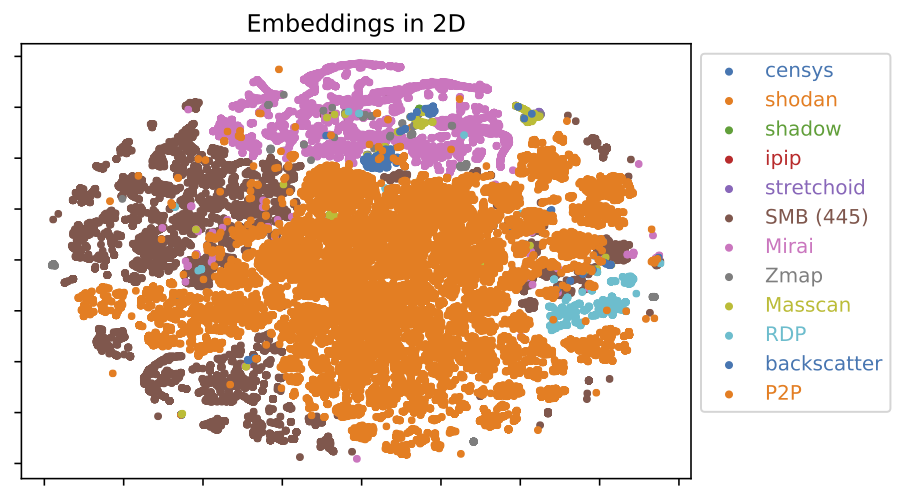
Motivated by the recent success of deep representation learning, we employ the idea of autoencoders (pmlr-v70-yang17b, ; 10.1145/3278532.3278545, ; 2013arXiv1312.6114K, ) to learn low-dimensional numerical embeddings of the input data. The resulting heterogeneity of the input data features, their high dimensionality, and the need to cope with potentially non-linear interactions between features motivated us to employ deep representation learning to address these challenges. Figure 2 illustrates how the proposed approach can “learn” meaningful features and map them into a low-dimension latent space, while keeping representations of similar points close together in the latent space. These low-dimension embeddings are then passed as input to a traditional K-means clustering algorithm to get the sought clusters. The workflow is shown in Figure 3.
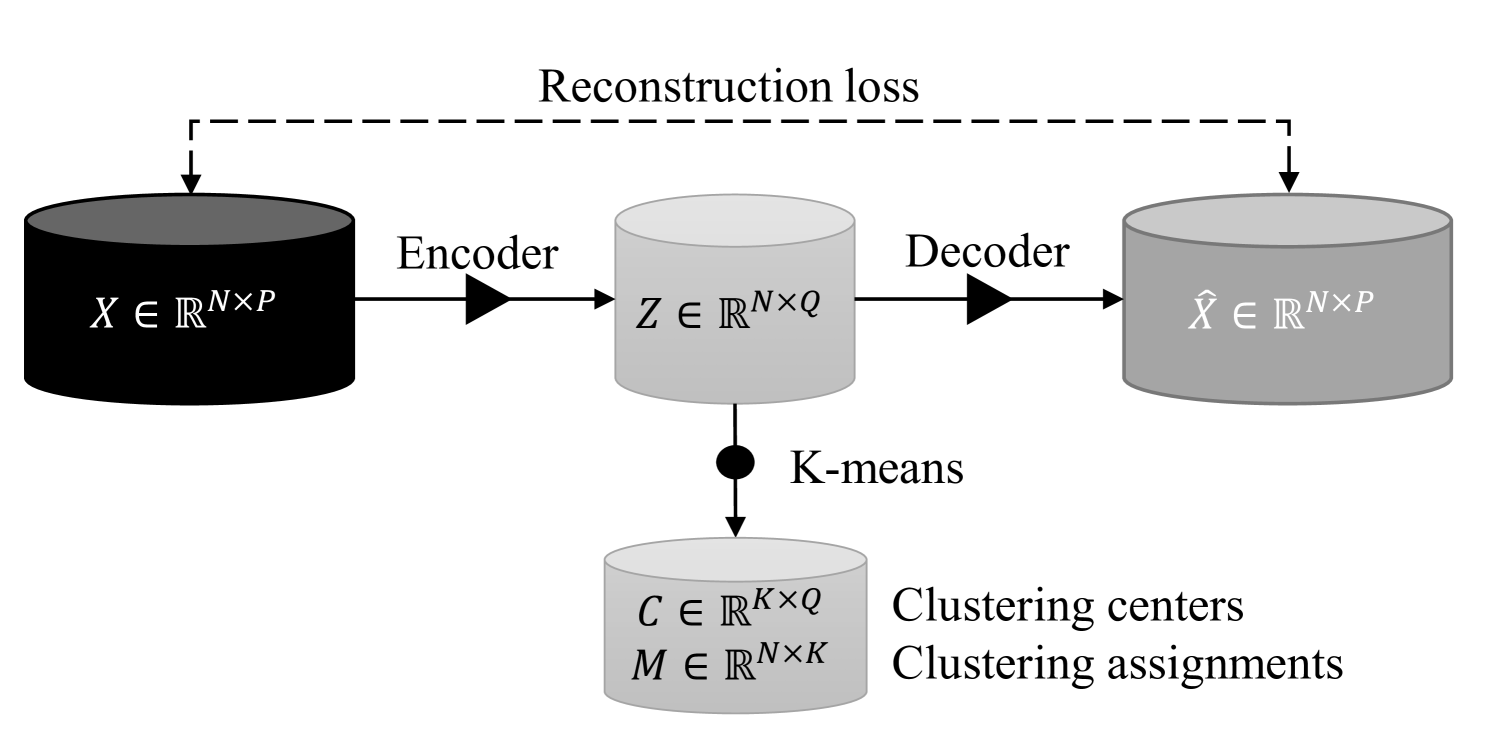
Multilayer Perceptron for Autoencoding: We now provide a short overview of the idea of representation learning using a Multilayer Perceptron (MLP) architecture. Let be a nonlinear encoder function parameterized by that maps the input data to a representation space, and be a nonlinear decoder function parameterized by that maps the data points from the representation space to the input space, such that:
One can employ fully-connected MLP neural networks for the implementation of both mapping functions . In order to learn representations that preserve the information of input data, we consider minimizing the reconstruction loss:
| (1) |
where the is a loss function that quantifies the reconstruction error. For simplicity, we choose the Euclidean distance . is a regularization term for the model parameters to help us avoid “overfitting” the data. In this work, we adopt the squared norm, such that . is the regularization coefficient. All model parameters, i.e., , can be jointly learned using standard stochastic gradient-based optimization methods, such as Adam (kingma2014adam, ). The dimension of the latent space, the number and size of inner layers of the MLP architecture and other hyper-parameters (such as the regularization coefficient) are tuned using the procedure outlined in the sequel (see Section 5.2).
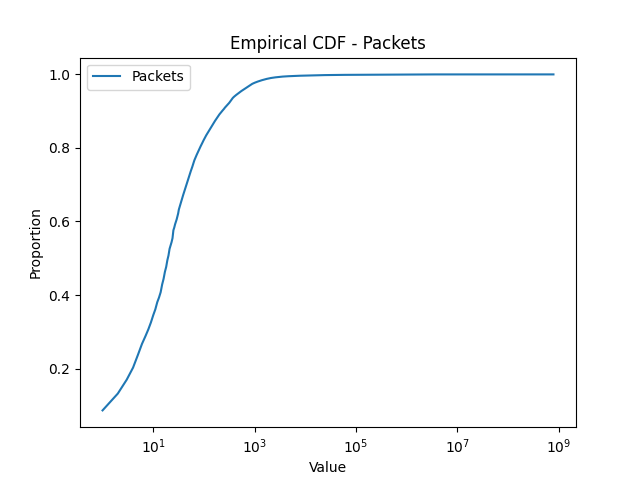
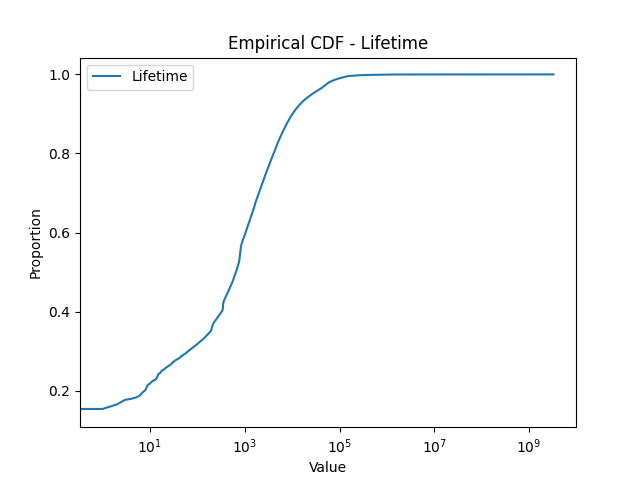
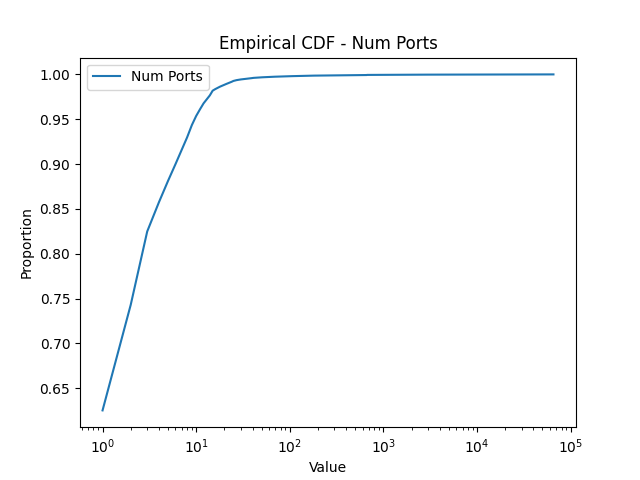
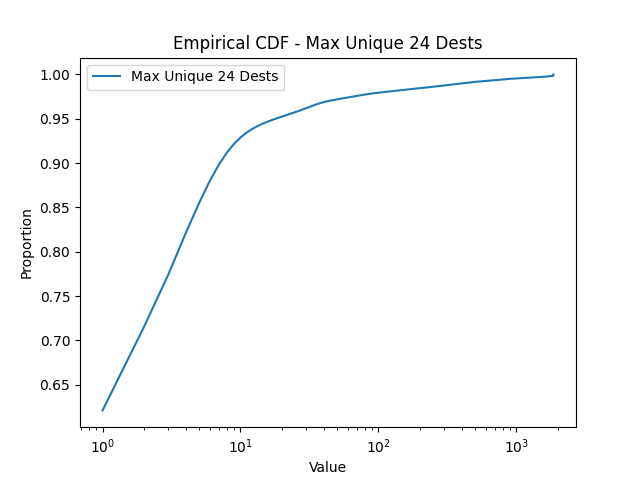
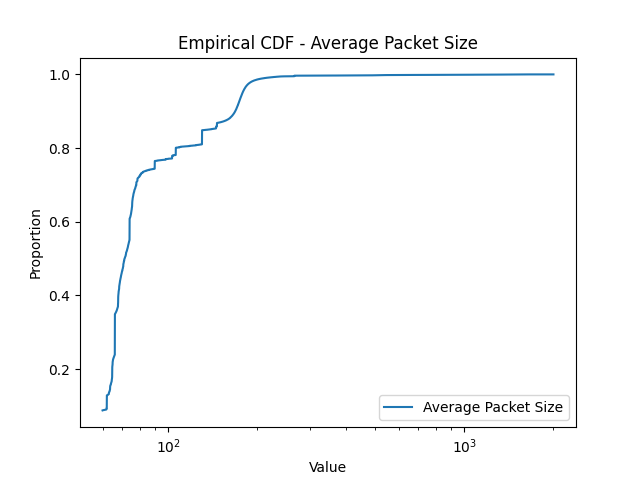
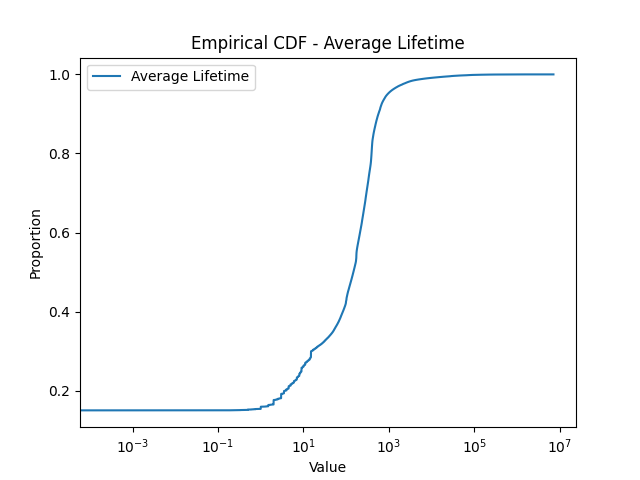
Thermometer Encoding: One challenge associated with encoding scanner profiles for representation learning is that a scanner profile includes, in addition to one-hot encoded binary features, numerical features (e.g., the number of ports scanned, the number of packets sent, etc). Mixing these two types of features might be problematic because a distance measure designed for one type of feature (e.g., Euclidean distance for numerical feature, Hamming distance for binary features) might not be suitable for the other type. To test this hypothesis, we also implemented an MLP network where all (numerical) input features are encoded as binary ones using thermometer encoding (thermometerEncoding, ). To construct the “bins” for the thermometer encoding, we utilize the empirical distribution of our numerical features, shown in Figure 4, compiled from a dataset ranging from Nov. 1st, 2020 to Jan. 20th, 2021. As depicted in the figure, many features, such as the one for the number of ports scanned, exhibit a long-tail distribution. For instance, a very large percentage of scanners (about 70%) scan only 1 or 2 ports, while a very small percentage of scanners scan a huge number of ports. The latter group, while small in number, is of high interest to network analysts due to their aggressive scanning behaviors. Therefore, we adopt log-based thermometer encoding, which enables fine-grained partition of high intensity vertical scanners.
4.3. K-means Clustering
We perform standard K-means clustering directly on the low-dimensional representation to partition the data. Formally, in this step, we aim to minimize the following clustering loss:
| (2) | ||||
where is the clustering assignment matrix, the entries of which are all binary. is the matrix of clustering centers that lie in the representation space. is a -dimensional column vector of ones. We utilized broadly available libraries for the implementation of the representation learning and clustering steps, such as PyTorch and scikit-learn.
5. Evaluation of Clustering and Representation Learning
5.1. Clustering Quality Measures
To evaluate the quality of the clustering results, we utilized the silhouette score, which is the standard measure for clustering quality, along with two additional evaluation metrics to obtain a more comprehensive assessment: the Jaccard score (halkidi2001survey, ) that is based on a set of external labels (created for evaluation purpose, and not used by clustering) based on domain knowledge (e.g., known fingerprints of Mirai malware, known port vulnerabilities such as port 445 associated with the attacks on the SMB protocol, known heavy scanners such as shodan.io, Censys.io, etc.) to determine the similarity of the clustering outcomes with the partition formed by the labels; and a stability score that evaluates the stability of clustering results by comparing the similarity of clusters generated by different sub-samples.
Silhouette Coefficient: The silhouette coefficient is frequently used for assessing the performance of unsupervised clustering algorithms (Rousseeuw87Silhouettes, ). Clustering outcomes with “well defined” clusters (i.e., clusters that are tight and well-separated from peer clusters) get a higher silhouette coefficient score. Formally, the silhouette coefficient is obtained as
| (3) |
where is the average distance between a sample and all the other points in the same cluster and is the average distance between a sample and all points in the next nearest cluster.
Jaccard Score: The Jaccard index or Jaccard similarity coefficient is a commonly used distance metric to assess the similarity of two finite sets. It measures this similarity as the ratio of intersection and union of the sets. This metric is, thus, suitable for quantitative evaluation of the clustering outcomes. Given that there is a domain inspired predefined partitioning of the data, the distance or the Jaccard Score of the clustering result on the same data is computed as (halkidi2001survey, ):
| (4) |
where is the total number of pair of points that belong to the same group in as well as the same group in , is the total number of pair of points that belong to the different groups in but to same group in and is the total number of pair of points that belong to the same group in but to different groups in .
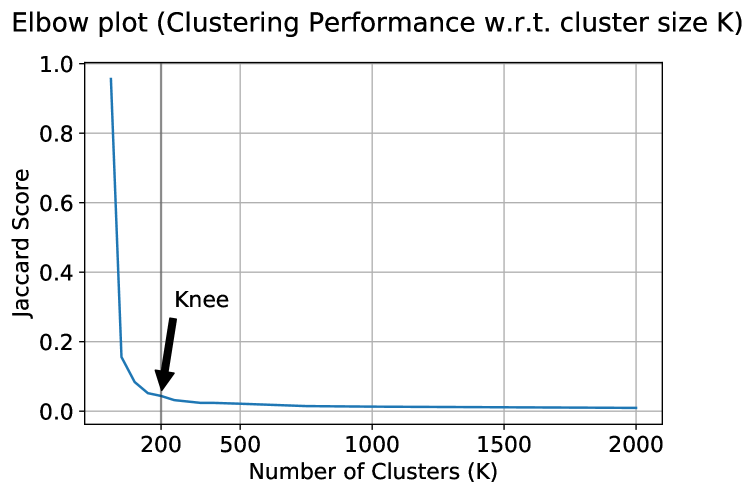
This cluster evaluation metric incorporates domain knowledge (such as Mirai, Zmap and Masscan scanners, that can identified by their representative packet header signatures (MiraiUSENIX2017, ; Durumeric:2014:IVI:2671225.2671230, ), and other partitions as outlined earlier) and measures how compliant the clustering results are with the known partitions. Jaccard score decreases as we increase the number of clusters used for clustering. This decrease is drastic at the beginning and slows down eventually forming a “knee” (see Figure 5). The “knee” where the significant local change in the metric occurs reveals the underlying number of groupings in the data (halkidi2001survey, ).
Cluster Stability Score: Quantifying cluster stability is important because it assesses how clustering results vary due to different sub sampling from the data. A clustering result that is not sensitive to sub-sampling, hence more stable, is certainly more desirable. In other words, the cluster structure uncovered by the clustering algorithm should be similar across different samples from the same data distribution (luxburg2010stability, ).
In order to analyze the stability of the clusters, we generate multiple subsampling versions of the data by using bootstrap resampling. These samples are clustered individually using the same clustering algorithm. The cluster stability score is, then, the average of the pairwise distances between the clustering outcomes of two different subsamples. For each cluster from one bootstrap sample, we identify its most similar cluster among clusters from another bootstrap sample using Jaccard index as the pairwise distance metric. In this case, the Jaccard index is simply the ratio of the intersection and union between the clusters. The average of these Jaccard scores across all pairs of samples provides a measure of how stable the clustering results are.
5.2. Hyper-parameter Tuning
Systematic tuning of the MLP hyper-parameters is critical to ensure that the network learns an information-preserving low dimension representation of the high dimensional input data. Following best practices for hyper-parameter tuning in machine learning, the set of hyper-parameters is adjusted to find parameter values that result in low autoencoder loss based on evaluation data not used in the training phase of the autoencoder. Hyper-parameters tuned include the size of the embeddings (i.e., latent space), the regularization coefficient, the “learning rate” used in stochastic gradient descent, the “dropout” probability employed to prevent over-fitting the training data, the number of “epochs” and the “batch size”.
We employed the Ray[Tune] framework (raytune, ) to tackle the important task of hyper-parameter tuning. Based on the tuning results, we choose the dimension of the latent space to be 50. The “best model” for both MLP and thermometer encoding MLP have a hidden layer of dimension 1000. Using 100 epochs, a batch size of 2000 data points and a value of 0.001 for learning rate, dropout probability and regularization weight provided optimal performance. All results presented in the following sections were generated using these tuned hyper-parameters settings.
5.3. Evaluating Clustering Results
| Autoencoder | Loss | Silhouette | Jaccard | Stability |
| MLP | 0.96 (1.71) | 0.44 (0.01) | 0.043 (0.001) | 0.40 (0.007) |
| Thermo-MLP | 24.97 (1.44) | 0.58 (0.02) | 0.012 (0.001) | 0.51 (0.008) |
To evaluate the clustering outcomes of the two autoencoder architectures we utilize the 3 metrics outlined earlier. We employ a Darknet dataset compiled for the day of January 9th, 2021, which includes about 2 million scanners. Figure 5 shows the clustering performance for different number of clusters (). Following the suggestions in (halkidi2001survey, ), we thus select the number of clusters for clustering Darknet data to be 200. A random sample of 500K scanners were used to perform 50 iterations of training autoencoders and k-means clustering, using 50K scanners in each iteration. The mean and standard deviation of the three clustering evaluation metrics, as well as the mean and standard deviation of the loss function (L2 for MLP, Hamming distance for thermometer-encoding-based MLP (TMLP)), are shown in Table 2.
The results indicated that the TMLP autoencoder led to better clustering results based on the silhouette and stability scores. However, a smaller Jaccard score was reported when compared to the MLP autoencoder. By inspecting the clusters generated, we noticed that this is probably due to the fact that TMLP tended to group scanners into smaller clusters that are similar in size. I.e., it generated multiple fine-grained clusters that correspond to a common large external label used for external validity measure (i.e., the Jaccard score). Because our current Jaccard score computation does not take into account the hierarchical structure of external label, fine-grained partition of external labels are penalized, even though they can provide valuable characteristics of subgroups in a malware family (e.g., Mirai). Henceforth, though, we present results using the MLP architecture that scored very well on all metrics and provided more interpretable results.
6. Interpretation and Internal Structure of Clusters
Clustering interpretation is critical in explaining the clustering outcome to network analysts. Contrary to supervised learning tasks, there is no “correct” clustering assignment and the clustering outcome is a consequence of the features employed. Hence, it is germane to provide interpretable and simple rules that explain the clustering outcome to network analysts so that they are able to i) compare clusters and assess inter-cluster similarity, ii) understand what features (and values thereof) are responsible for the formation of a given cluster, and iii) examine the hierarchical relationship amongst the groups formed.
6.1. Optimal Decision Trees
We propose the use of decision trees (hastie01statisticallearning, ) for clustering interpretation. Decision trees are conceptually simple, yet powerful, for supervised learning tasks (i.e., when labels are available) and their simplicity makes them easily understandable by human analysts. Specifically, we are interested in classification trees.
In a classification tree setting, one is given observations that consist of inputs, that is , and a target variable . The objective is to recursively partition the input space and assign the observations into a classification outcome taking values such that the classification error is minimized. For our application, the observations correspond to the Darknet events we had clustered and the labels correspond to the labels assigned by the clustering step. The input features are closely associated with the features used in the representation learning step (see Section 4). Specifically, we still employ all the numerical features but we also introduce the new binary variables / tags shown in Table 3. These “groupings”, based on domain knowledge, succinctly summarize some notable Darknet activities we are aware of (e.g., Mirai scanning, backscatter activities, etc.) and, we believe can help the analyst easily interpret the decision tree outcome.
Traditionally, classification trees are constructed using heuristics to split the input space (Breiman1983ClassificationAR, ; bertsimas17optimal, ; hastie01statisticallearning, ). These greedy heuristics though lead to trees that are “brittle”, i.e., trees that can drastically change even with the slightest modification in the input space and therefore do not generalize well. One can overcome this by using tree ensembles or “random forests” but this option is not suitable for the interpretation task at hand since one then needs to deal with multiple trees to interpret a clustering outcome. Hence, we decided to work with optimal classification trees (bertsimas17optimal, ) which are nowadays feasible to construct due to recent algorithmic advances in mixed-integer optimization and hardware improvements that speed-up computations.
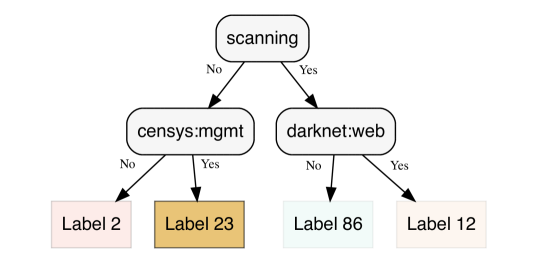
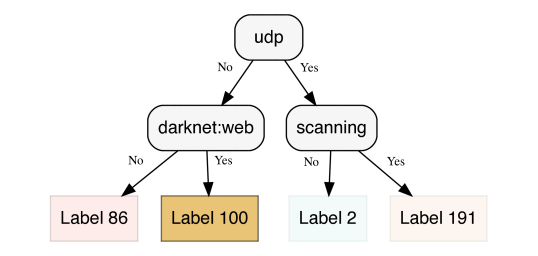
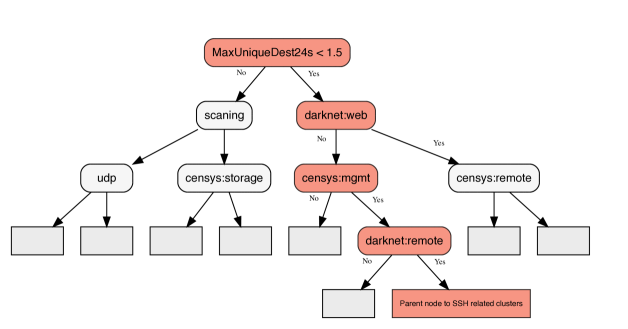
We used the software provided by interpretable.ai (interpretableai, ) to generate all optimal decision trees shown in the sequel. Figure 6 shows an example generated for 467,293 Darknet events for Sept. 14th, 2020. The structure of the tree, albeit minimal, is quire revealing. First, the leaves correspond to the largest 4 clusters (with sizes 14953, 11013, 10643 and 9422, respectively) found for Sept. 14th which means that the clusters with the most impact are captured. Another important observation is that the type of decision rules used to split the input space (namely, scanning, censys:mgtm and orion:remote) are indicative of the main Darknet activities during that day. Comparing with the non-optimal, heuristic-based decision tree of Figure 7, we recognize some important differences: 1) two new clusters have emerged (with labels 100 and 191) that do not rank within the top-4 clusters (they rank 8th and 10th, respectively, with 6977 and 6404 members); and 2) there is some “redundancy” in the decision rules used for splitting when both the tags UDP and “scanning” are present. This is because UDP and scanning (i.e., TCP SYN requests and ICMP Echo Requests) are usually complementary to each other.
| Feature | Description |
| darknet:web | Ports: 80, 443, 81 |
| darknet:remote | Ports: 22, 23 |
| darknet:mssql | Ports: 1433 |
| darknet:samba | Ports: 445 |
| darknet:rdp | Ports matching regex ’\d+3389\d+’ |
| darknet:quote | Port: 17 |
| darknet:p2p | Ports matching regex ’17\d\d\d’ |
| darknet:amplification | Ports: 123, 53, 161, 137, 1900, 19, 27960, 27015 |
| censys:web | Tags: http, https |
| censys:remote | Tags: ssh, telnet, remote |
| censys:mssql | Tags: mssql |
| censys: samba | Tags: smb |
| censys:embedded | Tags: embedded, DSL, model, iot |
| censys:mgmt | Tags: cwmp, snmp |
| censys:storage | Tags: ftp, nas |
| censys:amplification | Tags: dns, ntp, memcache |
| scanning | TCP and ICMP scanning |
| backscatter | Protocols / flags associated with backscatter |
| UDP | Whether its UDP |
| Unknown / other | Other protocols / flags |
6.2. Internal Structures of Clusters
One of the important challenges in clustering is identifying characteristics of a cluster that distinguish it from other clusters. While the center of a cluster is one useful way to represent a cluster, it can not clearly reveal the features and values that define the cluster. This is even more challenging for characterizing clusters of high-dimensional data, such as the scanner profiles in the Darknet. One can address this challenge by defining “internal structures” based on the decision trees learned.
Given a set of clusters that form a partition of a dataset , a disjunctive normal forms (DNF) is said to be an internal structure of cluster if any data items in D satisfying are more likely to be in than in any other clusters. Hence, an internal structure of a cluster captures characteristics of the cluster that distinguishes it from all other clusters. More specifically, the conjunctive conditions of a path in the decision tree to a leaf node that predicts cluster forms the conjunctive (AND) component of the internal structure of . Conjunctive path description from multiple paths in the decision tree that predict the same cluster (say ) are combined into a disjunctive normal form that characterizes the cluster . Hence, the DNF forms revealed by decision tree learning on a set of clusters expose the internal structures of these clusters. We plan to pursue detection of structural (di)similarities in the Darknet based on DNF forms applied on decision tree outcomes as part of future work.
7. Detecting Cluster Changes
Given the proposed clustering framework, one can readily obtain Darknet clusters on a daily basis (or at any other granularity of interest) and compare the clustering outcomes to glean insights on their similarities. This is critical to security analysts aiming to automatically track changes in the behavior of the Darknet, in order to detect new emerging threats or vulnerabilities in a timely manner.
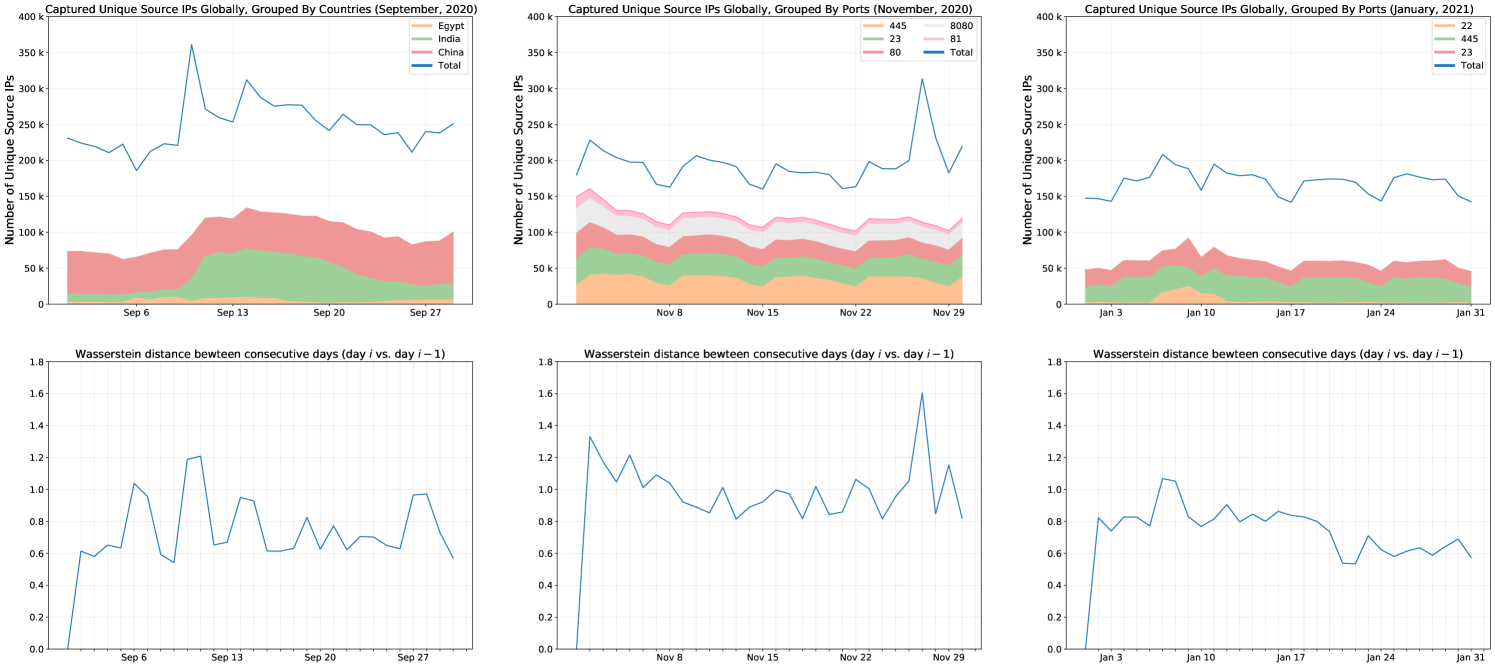
For example, Figure 8 (left panel) tracks the evolution of the Darknet for the whole month of September 2020. We compare the clustering outcome of consecutive days using a distance metric applied on the clustering profile of each pair of days. Specifically, we use the Earth Mover’s Distance (710701, ) which is a measure that captures the dissimilarity between two multi-dimensional distributions (also known as Wasserstein metric). Intuitively, by considering the two distributions as two piles of dirt spread in space, the Earth Mover’s Distance captures the minimum cost required to transform one pile to the other. The cost here is defined as the distance (Euclidean or other appropriate distance) travelled to transfer a unit amount of dirt times the amount of dirt transferred. This problem can be formulated as a linear optimization problem and several solvers are readily available (e.g., (pywasserstein, )).
In our setting, each clustering outcome defines a distribution or “signature” that can be utilized for comparisons. Specifically, denote the set of clusters obtained after the clustering step as and the centers of all clusters as where
, and . Then, the signature
can be employed, where represents the “weight“ of cluster which is equal to the fraction of items in that cluster over the total population of scanners. The results we present in the next section were compiled by applying this signature on the clustering outcome of each day; research on other signatures (possibly of lower dimensionality) is part of ongoing work.
8. Analysis of Real-world Events
We are now ready to demonstrate the entire methodology (i.e., clustering, detection of longitudinal structural changes using Earth Mover’s Distance (EMD), and decision trees for interpretation) when applied to three months of data from a large operational /13 Darknet. The objective of this section is to showcase that 1) important Internet-wide events were discovered using the proposed novelty detection approach (see Figure 8) and 2) to highlight the importance of clustering interpretation using decision trees. The case studies considered are summarized below:
-
•
September 2020: A large Mirai outbreak that emerged on September 6th, 2020, primarily originating from Egypt and India;
-
•
November 2020: A November 27th spike in the number of infected hosts appearing to scan our Darknet, attributed primarily to embedded devices;
-
•
January 2021: The emergence of a large number of infected CWMP-enabled devices, associated with a tier-1 US ISP, involved in aggressive SSH scanning activities.
To underline the importance of integrating external data sources in understanding Darknet data, all results presented henceforth are for Darknet scanners / IPs with available Censys-based features (see Table 1 for the list of our features).
8.1. The Mirai incident
Figure 8 (bottom row, left plot) shows a significant increase in the EMD distance between the clustering outcome of Sept. 5th and Sept. 6th. Figure 8 (top row, left plot) shows the aggregate number of unique scanners for the total month of September and a detailed view of the top-3 countries for that month (regarding unique scanners). With a bare eye we observe an increase in scanners originating from Egypt, but looking at a mere scanning volume cannot let us diagnose what really happened. We therefore look at the top clusters extracted for both days for an answer.
| Cluster Label | Cluster Size | Top Ports | Top Port Fraction | Top Tags | Top Tag Fraction | Mirai Coverage |
|---|---|---|---|---|---|---|
| 73 | 9587 | 54148 | 0.36 | telnet | 0.26 | 0.00 |
| 3 | 8513 | 445 | 0.73 | ftp | 0.44 | 0.00 |
| 57 | 8053 | 54148 | 0.77 | cwmp | 0.94 | 0.00 |
| 21 | 7293 | 8080 | 0.32 | cwmp | 0.94 | 0.00 |
| 188 | 5817 | 8080 | 0.28 | ftp | 0.46 | 0.00 |
| 87 | 5052 | 445 | 0.65 | http | 0.87 | 0.00 |
| 171 | 5024 | 17130 | 0.13 | cwmp | 0.96 | 0.00 |
| 106 | 4818 | 17140 | 0.50 | dns | 0.83 | 0.00 |
| 135 | 4602 | 23 | 0.27 | dns | 0.80 | 0.00 |
| 26 | 4550 | 54148 | 0.59 | http | 0.77 | 0.00 |
| Cluster Label | Cluster Size | Top Ports | Top Port Fraction | Top Tags | Top Tag Fraction | Mirai Coverage |
|---|---|---|---|---|---|---|
| 6 | 15457 | 52695 | 0.23 | smb | 0.18 | 0.00 |
| 49 | 11612 | 445 | 0.88 | smb | 0.29 | 0.00 |
| 17 | 9759 | 52695 | 0.46 | cwmp | 0.94 | 0.00 |
| 2 | 9744 | 0 | 0.98 | dns | 0.89 | 0.00 |
| 7 | 7335 | 23 | 0.92 | ftp | 0.40 | 0.88 |
| 47 | 6225 | 80 | 0.34 | cwmp | 0.94 | 0.00 |
| 53 | 6191 | 8080 | 0.15 | snmp | 0.42 | 0.01 |
| 38 | 6163 | 52695 | 0.05 | dns | 0.98 | 0.00 |
| 78 | 6065 | 8080 | 0.30 | snmp | 0.56 | 0.00 |
| 83 | 5311 | 0 | 0.91 | dns | 0.81 | 0.00 |
Tables 4 and 5 tabulate the top-10 clusters for each day. Notice that the column “Mirai Coverage” (which denotes the portion of Darknet scanners within that cluster that include the well-known Mirai fingerprint (MiraiUSENIX2017, ) in the packet header of the packets they emitted) is zero for all top clusters of Sept. 5th but a relatively large Mirai-related cluster emerges on Sept. 6th. Clearly, we now have a good indication about what might have caused the shift in the clustering structure between Sept. 5th and 6th.
Looking at our data more closely we found that there were 15970 total Mirai victims on Sept. 5 and 28261 on Sept. 6th. Table 6 shows the top Mirai-related clusters for Sept. 5th and Table 7 the top ones for the next day. As observed, the Mirai clusters have increased significantly. Notice also that Censys can provide some valuable information for interpreting each cluster; the largest Mirai cluster on Sept. 6th seems to be heavily associated with devices having the FTP port open.
Examining the distribution of countries affected by the Mirai malware (see Table 8, recall that we geo-annotate all scanners for result interpretation, but we don’t use this information as a clustering feature), we see Egypt emerging as the number one affected country. A few days later, India will be facing a similar Mirai outbreak (the large increase in unique scanners seen in Figure 8 for Sept. 10th is India’s Mirai outbreak with scanners having a similar profile like the ones observed in Egypt).
| Cluster Label | Cluster Size | Top Ports | Top Port Fraction | Top Tags | Top Tag Fraction | Mirai Coverage |
|---|---|---|---|---|---|---|
| 147 | 3183 | 2323 | 0.05 | http | 0.64 | 0.95 |
| 55 | 252 | 23 | 0.45 | http | 0.50 | 0.94 |
| 85 | 780 | 5555 | 0.53 | http | 0.73 | 0.92 |
| 92 | 1192 | 23 | 0.03 | http | 0.61 | 0.91 |
| 159 | 534 | 23 | 0.15 | http | 0.53 | 0.90 |
| Cluster Label | Cluster Size | Top Ports | Top Port Fraction | Top Tags | Top Tag Fraction | Mirai Coverage |
|---|---|---|---|---|---|---|
| 15 | 538 | 2323 | 0.76 | http | 0.52 | 0.98 |
| 103 | 3580 | 2323 | 0.02 | http | 0.76 | 0.93 |
| 178 | 2920 | 23 | 0.71 | http | 0.64 | 0.91 |
| 7 | 7335 | 23 | 0.92 | ftp | 0.40 | 0.89 |
| 40 | 1135 | 23 | 0.02 | http | 0.60 | 0.88 |
| Country | No. of Distinct IPs |
|---|---|
| Egypt | 3195 |
| Taiwan | 1502 |
| China | 1373 |
| Brazil | 1074 |
| France | 946 |
| Country | No. of Distinct IPs |
|---|---|
| Egypt | 15293 |
| Taiwan | 1933 |
| China | 1238 |
| Brazil | 1019 |
| France | 839 |
8.2. The embedded devices incident
| Port | No. of Distinct IPs |
|---|---|
| 23 | 61281 |
| 445 | 56971 |
| 59478 | 55741 |
| 80 | 48336 |
| 8080 | 46665 |
| Port | No. of Distinct IPs |
|---|---|
| 50668 | 53753 |
| 445 | 53109 |
| 23 | 50763 |
| 80 | 44250 |
| 8080 | 43016 |
| Port | Total Packets |
|---|---|
| 80 | 1287486 |
| 8080 | 1268836 |
| 23 | 1113426 |
| 445 | 782743 |
| 59478 | 718157 |
| Port | Total Packets |
|---|---|
| 80 | 1172944 |
| 8080 | 1156958 |
| 23 | 1009036 |
| 445 | 731203 |
| 50668 | 689067 |
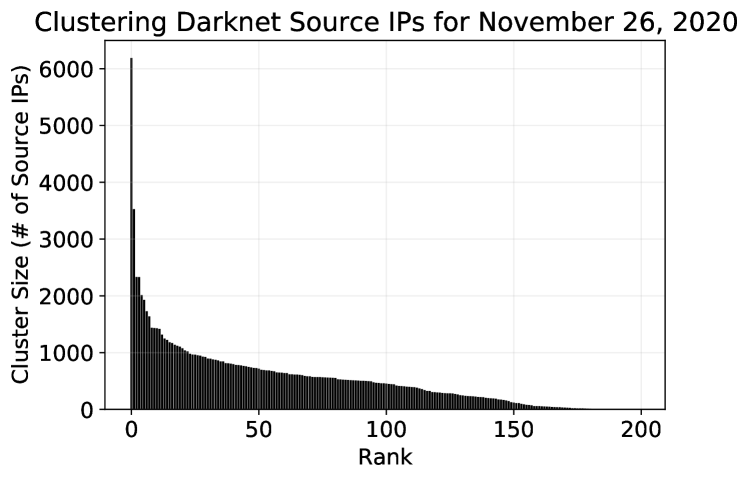
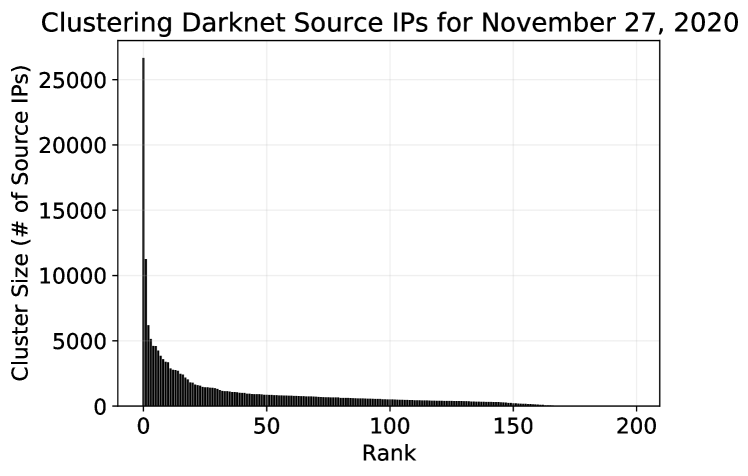
The second case study we examine is attributed to the large EMD spike detected on Nov. 27th (i.e., denoting a large difference in the clustering outcomes between that day and the day before). Figures 9 and 10 illustrate the distribution of the cluster sizes for these 2 days. There are two extremely large clusters formulated on Nov. 27th with sizes 26662 (cluster-1) and 11262 (cluster-19). The largest cluster on Nov. 26th had only about 6000 members (cluster-2). We here start to speculate that these 2 large clusters might be the culprits for the dramatic shift in the EMD distances, but we need to look deeper into the clustering results.
Figure 8 does not indicate that the change is associated with any of the top-5 ports for that month. Similarly, Table 9 and 10 that include the top-5 ports zoomed into both days do not provide any further insights. This illustrates that “group by” operations (performed frequently by forensic analysts when trying to troubleshoot an incident) might sometimes provide limited information. Further, when there are multiple categorical features (as is the case here, with categorical features being the ports scanned, protocols, Censys tags, Censys ports, countries, etc.) and multiple numerical features, forensics analysis and result interpretation might be challenging.
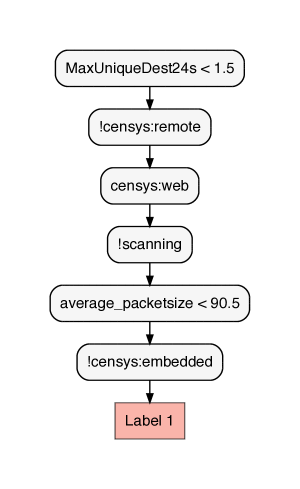
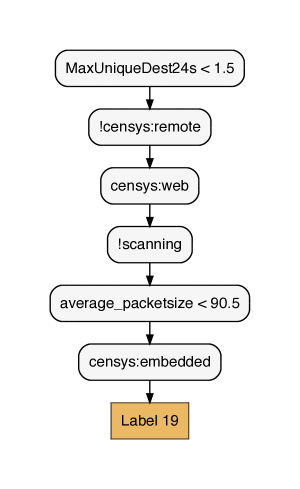
However, by reflecting on the decision tree paths depicted in Figure 11 we start to gain some understanding about what might be responsible for the structural clustering changes between the 2 days. The rule on the root for Nov. 26th immediately tells us that the top 2 clusters are events that are not associated with “Censys:Web” (meaning that ports 80 or 443 were not found open when Censys scanned the scanners belonging in these clusters; see Table 3). At the same time, the decision rule “Censys:Web” is active for the top-2 clusters for Nov. 27th. Hence, the top-2 very large clusters on Nov. 27th and the top-2 clusters on Nov. 26th are characterized by a distinctive feature (i.e., the “Censys:Web” grouping) and this very likely explains the clustering differences observed. Notably, the top cluster for Nov. 27th and the second-top cluster only differ on their last rule of their decision paths (i.e., the rule about “Censys: embedded”) which means the clusters are very similar except when it comes with the “embedded tag” assigned to them by Censys.
Examining Table 11, which ranks the scanners by their Censys-reported “open ports”, seems to validate that the culprits for the Nov. 27th events are scanners with ports 80 and 443 open that became compromised between the 2 days. Closer investigation of these scanners showed that the behavior was UDP-related (shown also in the decision paths as “!scanning”, i.e., not TCP or ICMP scanning; see Table 3) and the scanners were targeting a variety of randomly looking, high-value ephemeral ports. Further investigation is required to fully understand the intentions behind this event that was originating from several countries and BGP routing prefixes. We note, though, that only 606 source IPs from the top-cluster of Nov. 27th match with any of the scanners from the previous day suggesting the event of Nov. 27th involved newly infected hosts.
| Port | No. of Distinct IPs |
|---|---|
| 443 | 76585 |
| 80 | 65959 |
| 53 | 46299 |
| 22 | 39600 |
| 2000 | 38091 |
| Port | No. of Distinct IPs |
|---|---|
| 80 | 138727 |
| 443 | 125603 |
| 22 | 57086 |
| 53 | 45862 |
| 7547 | 43274 |
8.3. The SSH incident
The last case study involves heavy SSH scanning associated primarily with devices/hosts attributed to a US tier-1 ISP. Consulting Figure 8, we see a change-detection in the EMD chart between Jan. 6th and Jan. 7th. The SSH scanning activity peaks on Jan. 9th, as seen in the top-right panel of Figure 8, but the change in unique scanners between Jan. 6th and 7th is not that obvious when visualizing that plot. Indeed, looking at the top-5 ports of Table 12, we see that port 22 (SSH) is absent (port 22 ranked top-44th on Jan. 6th and top-13th on Jan. 7th).
Nevertheless, the clustering approach is able to capture this onset of this important event. Looking at Table 13, we observe that there was only a single cluster with port 22 as the top port within the cluster. However, the clustering structure changes significantly on Jan. 6th as evidenced by Table 14. We see several SSH-related ports emerging and many of the clusters are associated with the CWMP tag. This suggests that the infected devices might be ISP-managed modems that were susceptible and got compromised. We note here that, although not captured by the EMD detector, a similar SSH incident occurred back on Nov. 6th, 2020 that involved the same tier-1 ISP. In both cases we notified their “network abuse” team about the incidents.
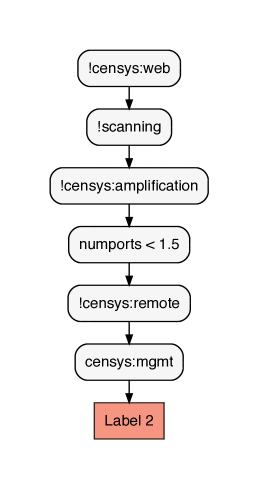
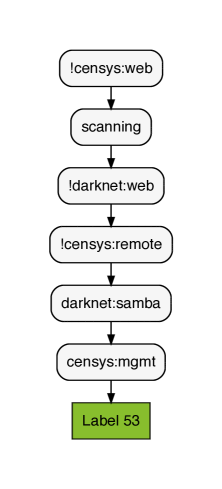
Figure 12 illustrates a pruned version of the optimal decision tree obtained for Jan. 7th (the full tree is of depth 7). It again demonstrates the utility of decision trees for clustering interpretation. Five out of six clusters associated with SSH activity are extensively explained by the decision tree path highlighted with the red nodes that leads to Node 90 in the tree. That set of rules explain the following fraction of scanners (see Table 14): for cluster-20: 2468/2647, for cluster-35: 5621/5739, for cluster-44 192/958, for cluster-66: 1367/1441, for cluster-74: 2/2023 and for cluster-105: 4233/4325.
| Port | No. of Distinct IPs |
|---|---|
| 445 | 54946 |
| 51974 | 52268 |
| 23 | 44244 |
| 80 | 40599 |
| 8080 | 38950 |
| Port | No. of Distinct IPs |
|---|---|
| 445 | 54791 |
| 63570 | 54067 |
| 23 | 45265 |
| 80 | 43097 |
| 8080 | 41201 |
| Cluster Label | Cluster Size | Top Ports | Top Port Fraction | Top Tags | Top Tag Fraction | Mirai Coverage |
|---|---|---|---|---|---|---|
| 96 | 703 | 22 | 0.34 | http | 0.28 | 0.36 |
| Cluster Label | Cluster Size | Top Ports | Top Port Fraction | Top Tags | Top Tag Fraction | Mirai Coverage |
|---|---|---|---|---|---|---|
| 35 | 5739 | 22 | 0.99 | cwmp | 0.95 | 0.00 |
| 105 | 4325 | 22 | 0.98 | cwmp | 0.84 | 0.01 |
| 20 | 2647 | 22 | 0.95 | embedded | 0.33 | 0.01 |
| 74 | 2023 | 22 | 0.93 | https | 0.49 | 0.01 |
| 66 | 1441 | 22 | 0.92 | cwmp | 0.75 | 0.08 |
| 44 | 958 | 22 | 0.45 | http | 0.22 | 0.26 |
9. Discussion and Future Directions
Security analysts have several opportunities to leverage this near-real-time clustering approach proposed here. First, the high intensity scanners identified can be combined with other scanning data collected by an organization to improve their network’s risk assessment. This is important because data collected by an enterprise may not be able to easily identify high-intensity scanners, as we discussed in section 3. Furthermore, the ports being scanned by high-intensity scanners can reveal information about potential vulnerabilities that may be exploited by adversaries. Subsequently, enterprise network security teams can be more proactive in revising risk assessment based on this new information and mitigation strategies for their network. Second, Indicators of Compromise (IoC) generated by an organization’s Intrusion Detection System can be filtered and prioritized using the clusters generated.
One of the important directions of this research is to extend the discussed clustering framework into an automated multi-pass clustering. Due to the high speed of scanning data arriving at the Darknet and the high dimensionality of its feature space, the size of clusters generated can still be large, which often includes scanners with different characteristics. For example, a high-intensity scanner that scans only a small number of ports may be grouped with other scanners that scan similar ports, but with much lower intensity. Hence, an automated multi-pass clustering of the proposed framework is needed to enable further clustering of clusters based on its size and/or the entropy of critical features (e.g., ports scanned).
10. Conclusion
This paper introduces a novel unsupervised clustering-based approach to characterizing Darknet scanning activity and its evolution over time. We exploit important information about the behaviors of Darknet scanners (e.g., the set of ports scanned by the scanner as well as information provided by Censys.io about the set of services open at the scanning IP) to encode the data. Such information is critical for characterizing Darknet events and can reveal vulnerabilities targeted by nefarious users. The resulting heterogeneity of the data features, the high dimensionality of the data, the need to cope with potentially non-linear interactions between features present challenges that are largely unaddressed by existing clustering-based approaches to analyses of Darknet data. Hence, we proposed a deep representation learning approach to clustering high dimensional data from network scanners. We also employed optimal classification trees for result interpretation and utilized the clustering outcomes as “signatures“ to help us detect structural Darknet changes over time.
Acknowledgements
This research is partially supported by a U.S. Department of Homeland Security Grant through Center for Accelerating Operational Efficiency (CAOE). The views and conclusions contained herein are those of the authors and should not be interpreted as representing the official policies, either expressed or implied, of the U.S. Department of Homeland Security.
References
- [1] Charu C Aggarwal, Alexander Hinneburg, and Daniel A Keim. On the surprising behavior of distance metrics in high dimensional space. In International conference on database theory, pages 420–434. Springer, 2001.
- [2] Manos Antonakakis, Tim April, Michael Bailey, Matt Bernhard, Elie Bursztein, Jaime Cochran, Zakir Durumeric, J. Alex Halderman, Luca Invernizzi, Michalis Kallitsis, Deepak Kumar, Chaz Lever, Zane Ma, Joshua Mason, Damian Menscher, Chad Seaman, Nick Sullivan, Kurt Thomas, and Yi Zhou. Understanding the mirai botnet. In 26th USENIX Security Symposium (USENIX Security 17), pages 1093–1110, Vancouver, BC, 2017. USENIX Association.
- [3] Tao Ban, Shaoning Pang, Masashi Eto, Daisuke Inoue, Koji Nakao, and Runhe Huang. Towards early detection of novel attack patterns through the lens of a large-scale darknet. In 2016 Intl IEEE Conferences on Ubiquitous Intelligence & Computing, Advanced and Trusted Computing, Scalable Computing and Communications, Cloud and Big Data Computing, Internet of People, and Smart World Congress (UIC/ATC/ScalCom/CBDCom/IoP/SmartWorld), pages 341–349. IEEE, 2016.
- [4] Tao Ban, Lei Zhu, Junpei Shimamura, Shaoning Pang, Daisuke Inoue, and Koji Nakao. Behavior analysis of long-term cyber attacks in the darknet. In International Conference on Neural Information Processing, pages 620–628. Springer, 2012.
- [5] Yoshua Bengio, Aaron Courville, and Pascal Vincent. Representation learning: A review and new perspectives. IEEE transactions on pattern analysis and machine intelligence, 35(8):1798–1828, 2013.
- [6] Dimitris Bertsimas and Jack Dunn. Optimal classification trees. Machine Learning, 106(7):1039–1082, 2017.
- [7] Leo Breiman, Jerome H. Friedman, Richard A. Olshen, and Charles J. Stone. Classification and Regression Trees. Chapman and Hall/CRC, 1984.
- [8] Center for Applied Internet Data Analysis. Routeviews prefix to as mappings dataset (pfx2as) for ipv4 and ipv6. https://www.caida.org/data/routing/routeviews-prefix2as.xml.
- [9] Leo H. Chiang, Evan L. Russell, and Richard D. Braatz. Fault Detection and Diagnosis in Industrial Systems. Advanced Textbooks in Control and Signal Processing. Springer London, 2000.
- [10] Jakub Czyz, Michael Kallitsis, Manaf Gharaibeh, Christos Papadopoulos, Michael Bailey, and Manish Karir. Taming the 800 pound gorilla: The rise and decline of ntp ddos attacks. In Proceedings of the 2014 Conference on Internet Measurement Conference, pages 435–448, 2014.
- [11] Jakub Czyz, Kyle Lady, Sam G Miller, Michael Bailey, Michael Kallitsis, and Manish Karir. Understanding ipv6 internet background radiation. In Proceedings of the 2013 conference on Internet measurement conference, pages 105–118, 2013.
- [12] Alberto Dainotti, Alistair King, Kimberly Claffy, Ferdinando Papale, and Antonio Pescapé. Analysis of a “/0” stealth scan from a botnet. IEEE/ACM Transactions on Networking, 23(2):341–354, 2014.
- [13] Zakir Durumeric, David Adrian, Ariana Mirian, Michael Bailey, and J. Alex Halderman. A search engine backed by internet-wide scanning (online: https://censys.io). In Proceedings of the ACM CCS ’15, pages 542–553, 2015.
- [14] Zakir Durumeric, Michael Bailey, and J. Alex Halderman. An internet-wide view of internet-wide scanning. In Proceedings of the 23rd USENIX Conference on Security Symposium, SEC’14, pages 65–78, Berkeley, CA, USA, 2014. USENIX Association.
- [15] Claude Fachkha, Elias Bou-Harb, and Mourad Debbabi. Inferring distributed reflection denial of service attacks from darknet. Computer Communications, 62:59–71, 2015.
- [16] Google, Inc. BigQuery: Cloud data warehouse. https://cloud.google.com/bigquery/.
- [17] Maria Halkidi, Yannis Batistakis, and Michalis Vazirgiannis. On clustering validation techniques. Journal of Intelligent Information Systems, 17(2-3):107–145, December 2001.
- [18] Trevor Hastie, Robert Tibshirani, and Jerome Friedman. The Elements of Statistical Learning. Springer Series in Statistics. Springer New York Inc., New York, NY, USA, 2001.
- [19] Stephen Herwig, Katura Harvey, George Hughey, Richard Roberts, and Dave Levin. Measurement and analysis of hajime, a peer-to-peer iot botnet. In NDSS, 2019.
- [20] Félix Iglesias and Tanja Zseby. Pattern discovery in internet background radiation. IEEE Transactions on Big Data, 2017.
- [21] Interpretable AI. Taking the guesswork out of artificial intelligence. https://www.interpretable.ai.
- [22] Yunho Jeon and Chong-Ho Choi. Thermometer coding for multilayer perceptron learning on continuous mapping problems. In Proceedings of IEEE International Joint Conference on Neural Networks (IJCNN’99), pages 1685–1690, 1999.
- [23] Ian T Jolliffe and Jorge Cadima. Principal component analysis: a review and recent developments. Philosophical Transactions of the Royal Society A: Mathematical, Physical and Engineering Sciences, 374(2065):20150202, 2016.
- [24] Mattijs Jonker, Alistair King, Johannes Krupp, Christian Rossow, Anna Sperotto, and Alberto Dainotti. Millions of targets under attack: a macroscopic characterization of the dos ecosystem. In Internet Measurement Conference (IMC), Nov 2017.
- [25] Mattijs Jonker, Aiko Pras, Alberto Dainotti, and Anna Sperotto. A first joint look at DoS attacks and BGP blackholing in the wild. In Proceedings of the Internet Measurement Conference 2018, pages 457–463, 2018.
- [26] Diederik P Kingma and Jimmy Ba. Adam: A method for stochastic optimization. arXiv preprint arXiv:1412.6980, 2014.
- [27] Diederik P Kingma and Max Welling. Auto-Encoding Variational Bayes. arXiv e-prints, page arXiv:1312.6114, December 2013.
- [28] Ulrike V Luxburg. Clustering stability: an overview. Found Trends Mach Learn, 2(3):235–274, 2010.
- [29] MaxMind. GeoIP products of MaxMind. https://dev.maxmind.com/geoip/geoip2/geolite2/.
- [30] David Moore, Colleen Shannon, Geoffrey Voelker, and Stefan Savage. Network telescopes: Technical report. Technical report, Cooperative Association for Internet Data Analysis (CAIDA), Jul 2004.
- [31] David Moore, Geoffrey M. Voelker, and Stefan Savage. Inferring internet denial-of-service activity. In USENIX Security Symposium, Washington, D.C., Aug 2001.
- [32] Hironori Nishikaze, Seiichi Ozawa, Jun Kitazono, Tao Ban, Junji Nakazato, and Jumpei Shimamura. Large-scale monitoring for cyber attacks by using cluster information on darknet traffic features. Procedia Computer Science, 53:175–182, 2015.
- [33] Ruoming Pang, Vinod Yegneswaran, Paul Barford, Vern Paxson, and Larry Peterson. Characteristics of internet background radiation. In Proceedings of the 4th ACM SIGCOMM conference on Internet measurement, pages 27–40, 2004.
- [34] Patrick T. Komiske III. Python Wasserstein package. https://pkomiske.github.io/Wasserstein/.
- [35] rai.io. Fast and Simple Distributed Computing. https://ray.io.
- [36] Philipp Richter and Arthur Berger. Scanning the scanners: Sensing the internet from a massively distributed network telescope. In Proceedings of the Internet Measurement Conference, pages 144–157, 2019.
- [37] Peter Rousseeuw. Rousseeuw, p.j.: Silhouettes: A graphical aid to the interpretation and validation of cluster analysis. comput. appl. math. 20, 53-65. Journal of Computational and Applied Mathematics, 20:53–65, 11 1987.
- [38] Yossi Rubner, Carlo Tomasi, and Leonidas J. Guibas. A metric for distributions with applications to image databases. In Proceedings of the Sixth International Conference on Computer Vision, ICCV ’98, pages 59–66. IEEE Computer Society, 1998.
- [39] Armin Sarabi and Mingyan Liu. Characterizing the internet host population using deep learning: A universal and lightweight numerical embedding. In Proceedings of the Internet Measurement Conference 2018, IMC ’18, page 133–146, New York, NY, USA, 2018. Association for Computing Machinery.
- [40] The Censys Team. Censys.io. https://censys.io.
- [41] Laurens van der Maaten and Geoffrey Hinton. Visualizing data using t-sne. Journal of Machine Learning Research, 9(86):2579–2605, 2008.
- [42] An Wang, Wentao Chang, Songqing Chen, and Aziz Mohaisen. Delving into internet ddos attacks by botnets: characterization and analysis. IEEE/ACM Transactions on Networking, 26(6):2843–2855, 2018.
- [43] Eric Wustrow, Manish Karir, Michael Bailey, Farnam Jahanian, and Geoff Huston. Internet background radiation revisited. In Proceedings of the 10th ACM SIGCOMM conference on Internet measurement, pages 62–74, 2010.
- [44] Bo Yang, Xiao Fu, Nicholas D. Sidiropoulos, and Mingyi Hong. Towards k-means-friendly spaces: Simultaneous deep learning and clustering. In Doina Precup and Yee Whye Teh, editors, Proceedings of the 34th International Conference on Machine Learning, volume 70 of Proceedings of Machine Learning Research, pages 3861–3870, International Convention Centre, Sydney, Australia, 06–11 Aug 2017. PMLR.